
Briefly: In our opinion, speculative short positions are favored (with stop-loss at 1,970, S&P 500 index)
Our intraday outlook is now bearish, and our short-term outlook is bearish, following a breakout below recent consolidation:
Intraday
(next 24 hours) outlook: bearish
Short-term (next 1-2 weeks) outlook: bearish
Medium-term (next 1-3 months) outlook: neutral
Long-term outlook (next year): bullish
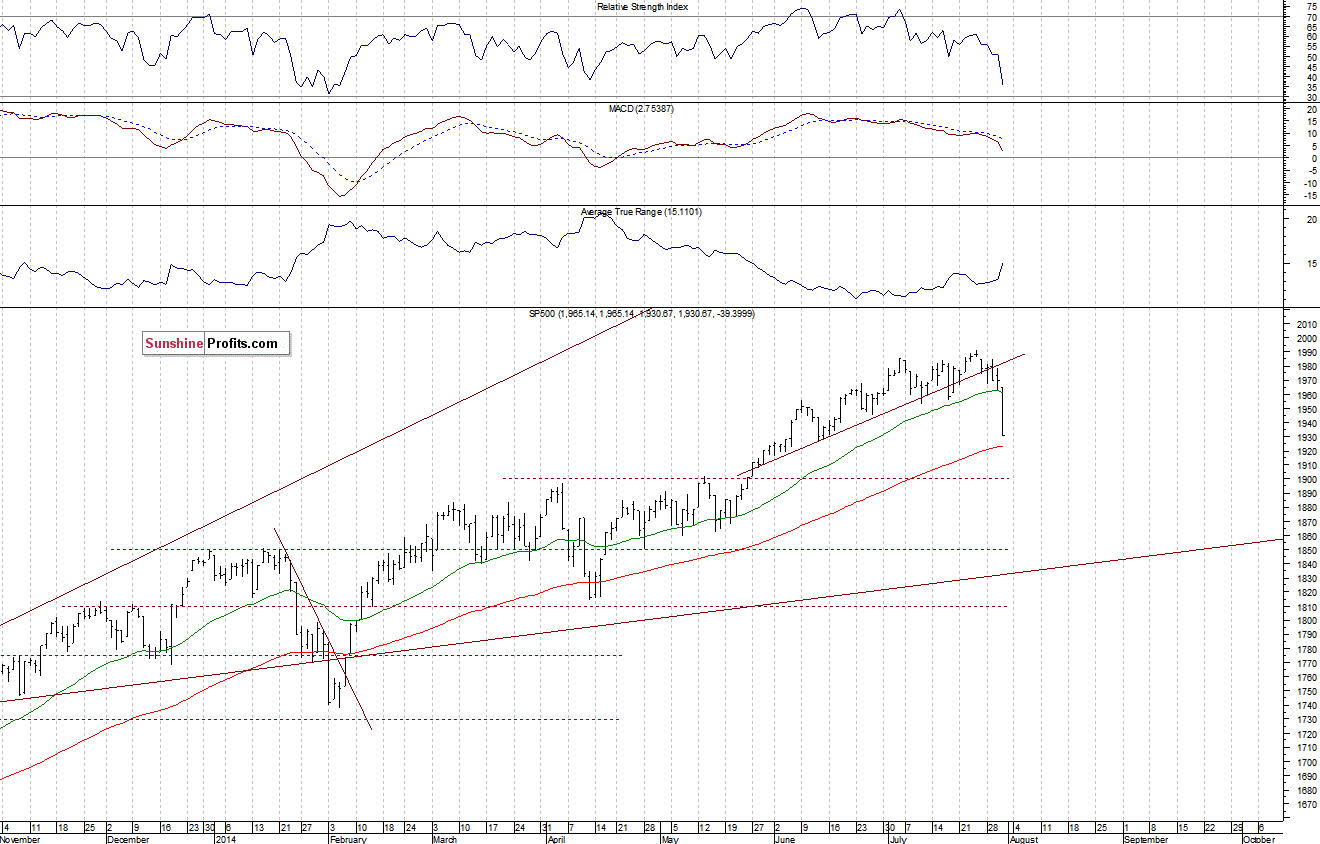
The main U.S. stock market indexes lost 1.9-2.1% on Thursday, as investors reacted negatively to Wednesday’s FOMC Decision release, geopolitical news, The S&P 500 index broke below its recent consolidation, which is a negative signal. The nearest important level of resistance is at 1,950-1,960, marked by previous support level. On the other hand, potential support level is at around 1,900-1,920, marked by previous local extremes. The index is in a short-term downtrend, as we can see on the daily chart:
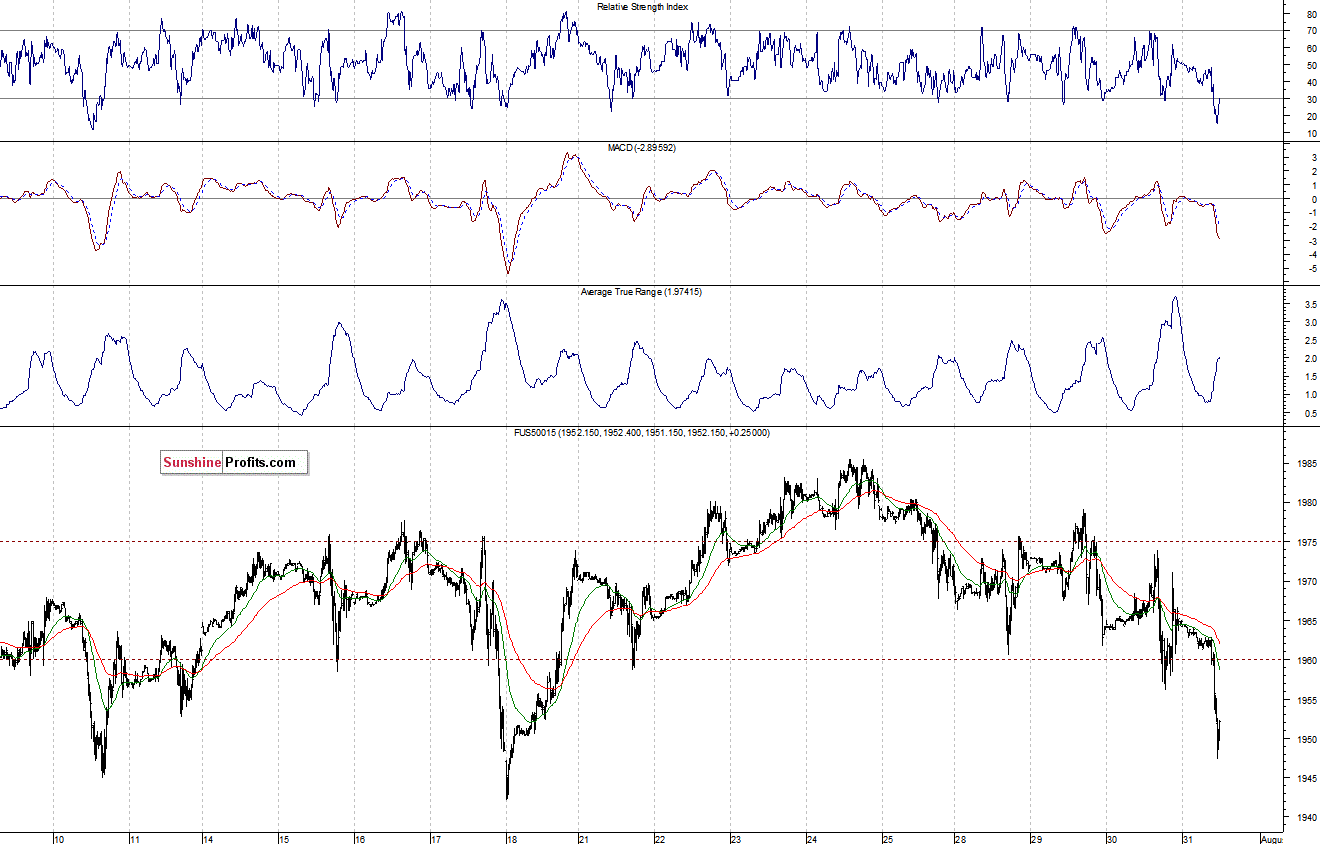
Expectations before the opening of today’s session are negative, with index futures currently down 0.7-0.8%. The European stock market indexes have lost between 1.4% and 1.9%. Investors will now wait for some key economic data announcements: Nonfarm Payrolls, Unemployment Rate, Personal Income, Personal Spending, PCE Prices – Core number at 8:30 a.m., Michigan Sentiment at 9:55 a.m., ISM Index, Construction Spending at 10:00 a.m. The monthly jobs report is the most important economic data point, and it is closely followed by the market. Therefore, we may see some increased volatility ahead of today’s trading session, especially following yesterday’s selloff. The S&P 500 futures contract (CFD) is in an intraday downtrend, as it trades closer to the level of 1,900, following yesterday’s breakout below the support level of 1,950-1,960. The nearest important support level is at around the psychological 1,900, and the resistance level is at 1,925-1,930, among others, as the 15-minute chart shows:
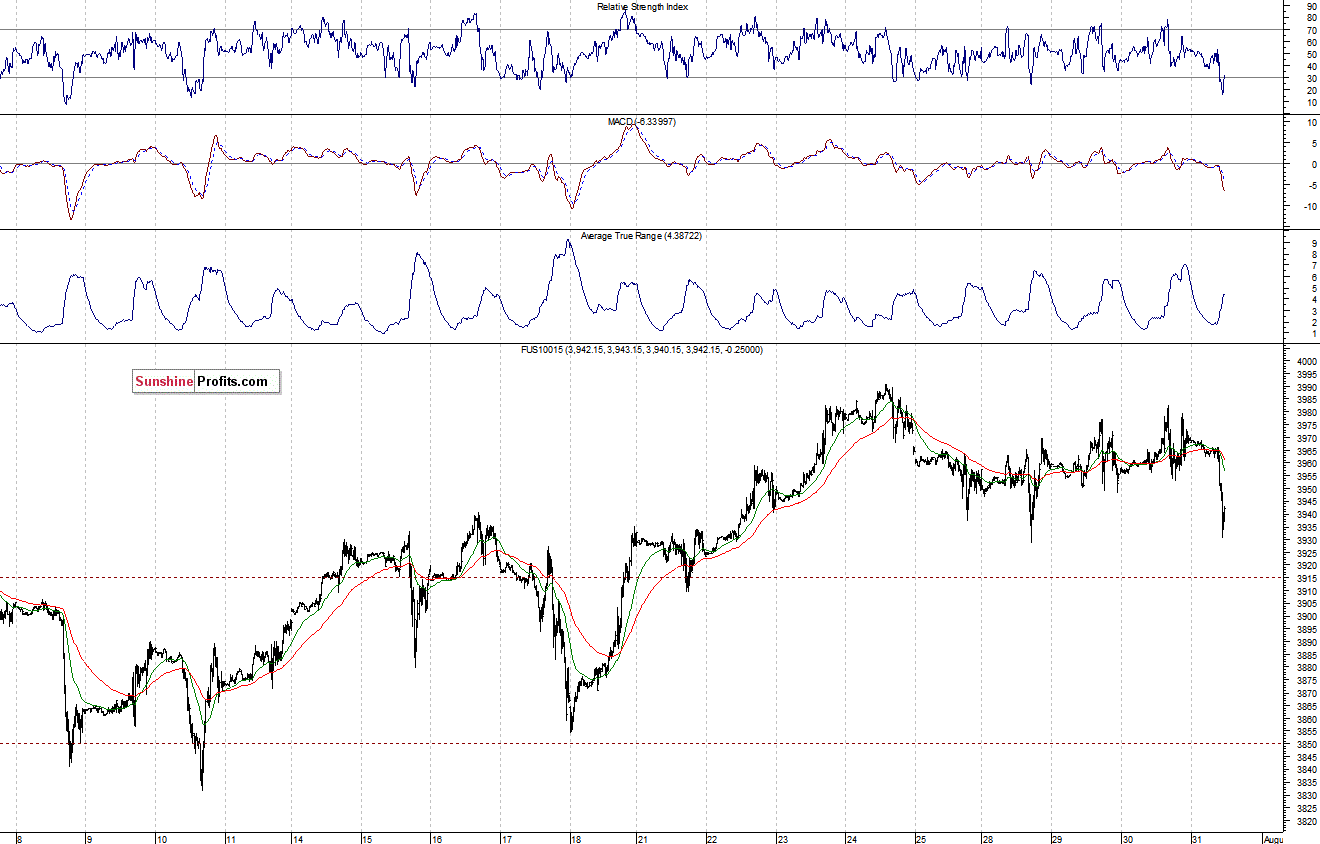
The technology Nasdaq 100 futures contract (CFD) followed a similar path, as it broke below the support level of 3,930-3,940. Then it moved below the support level of 3,900. The nearest important support level is currently at around 3,950. On the other hand, the level of resistance is at 3,880-3,900, marked by previous support:
Concluding, the broad stock market has changed its short-term trend, breaking below month-long consolidation. In our opinion, speculative short position with a stop-loss at 1,970 (S&P 500 index) seems justified at this moment.
Thank you.
Paul Rejczak
Stock Trading Strategist
Stock Trading Alerts

