
Briefly: In our opinion, no speculative positions are justified.
Our intraday outlook remains neutral, and our short-term outlook is neutral:
Intraday
(next 24 hours) outlook: neutral
Short-term (next 1-2 weeks) outlook: neutral
Medium-term (next 1-3 months) outlook: neutral
Long-term outlook (next year): bullish
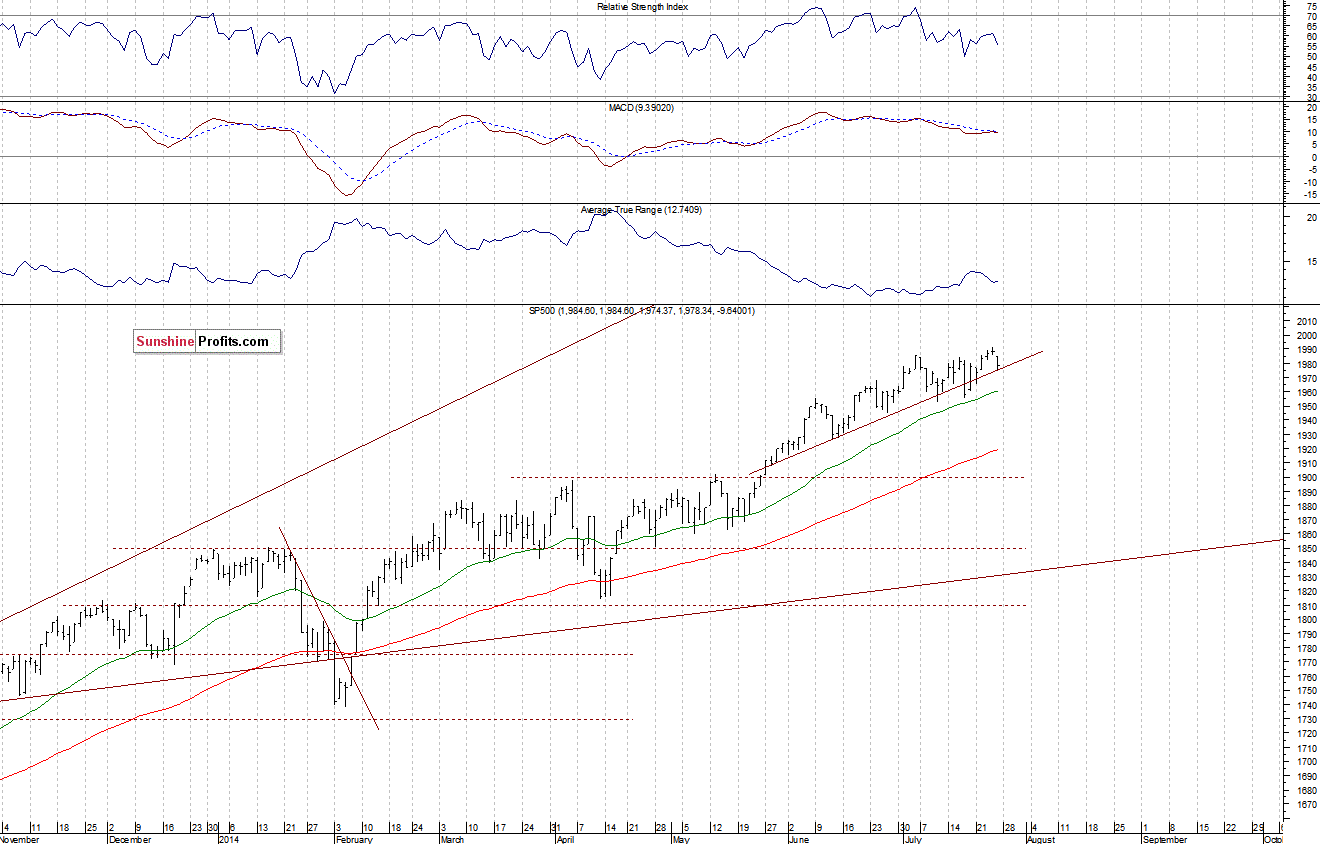
The U.S. stock market indexes lost between 0.5% and 0.7% on Friday, retracing their recent rally, as investors reacted to some geopolitical news concerning Russia-Ukraine and Middle East conflicts. The S&P 500 index extended its short-term consolidation, as it bounced off Thursday’s new all-time high of 1,991.39. The resistance level is at 1,990-2,000, and the nearest important level of support is at around 1,950-1,960, marked by some of the recent local lows. The index remains slightly above upward trend line, which is positive. Last weeks’ trading action looks like some sort of a medium-term topping pattern, however, there have been no confirmed negative signals so far:
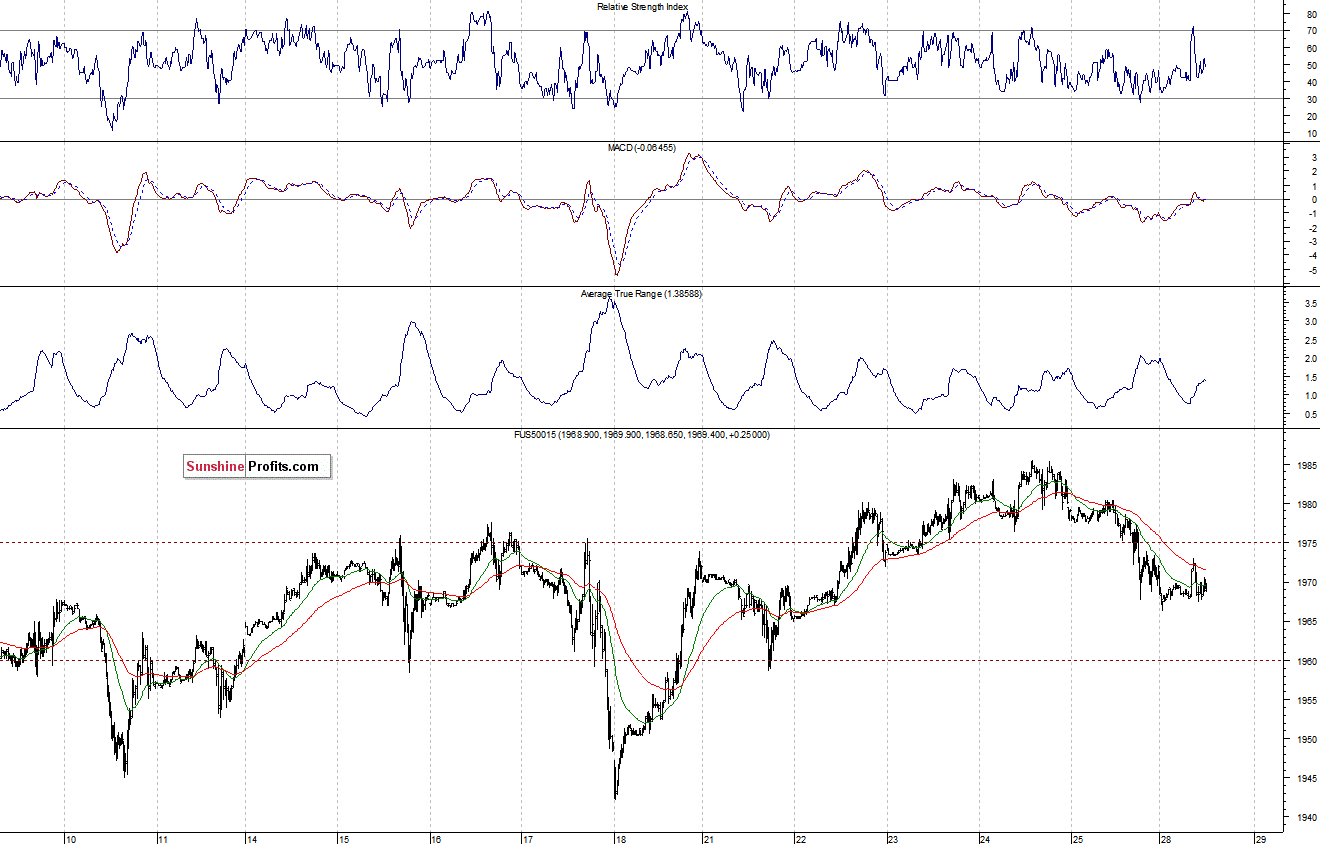
Expectations before the opening of today’s trading session are virtually flat, with index futures currently down 0.1%. The main European stock market indexes have been mixed so far. Investors will now wait for the Pending Home Sales data announcement at 10:00 a.m. The Pending Home sales index measures housing contract activity. It is based on signed real estate contracts. The S&P 500 futures contract (CFD) retraced some of its recent move up, as it bounced off the resistance level of 1,980-1,985. On the other hand, the support remains at around 1,960, marked by previous local low. There have been no confirmed negative signals so far, as we can see on the 15-minute chart:
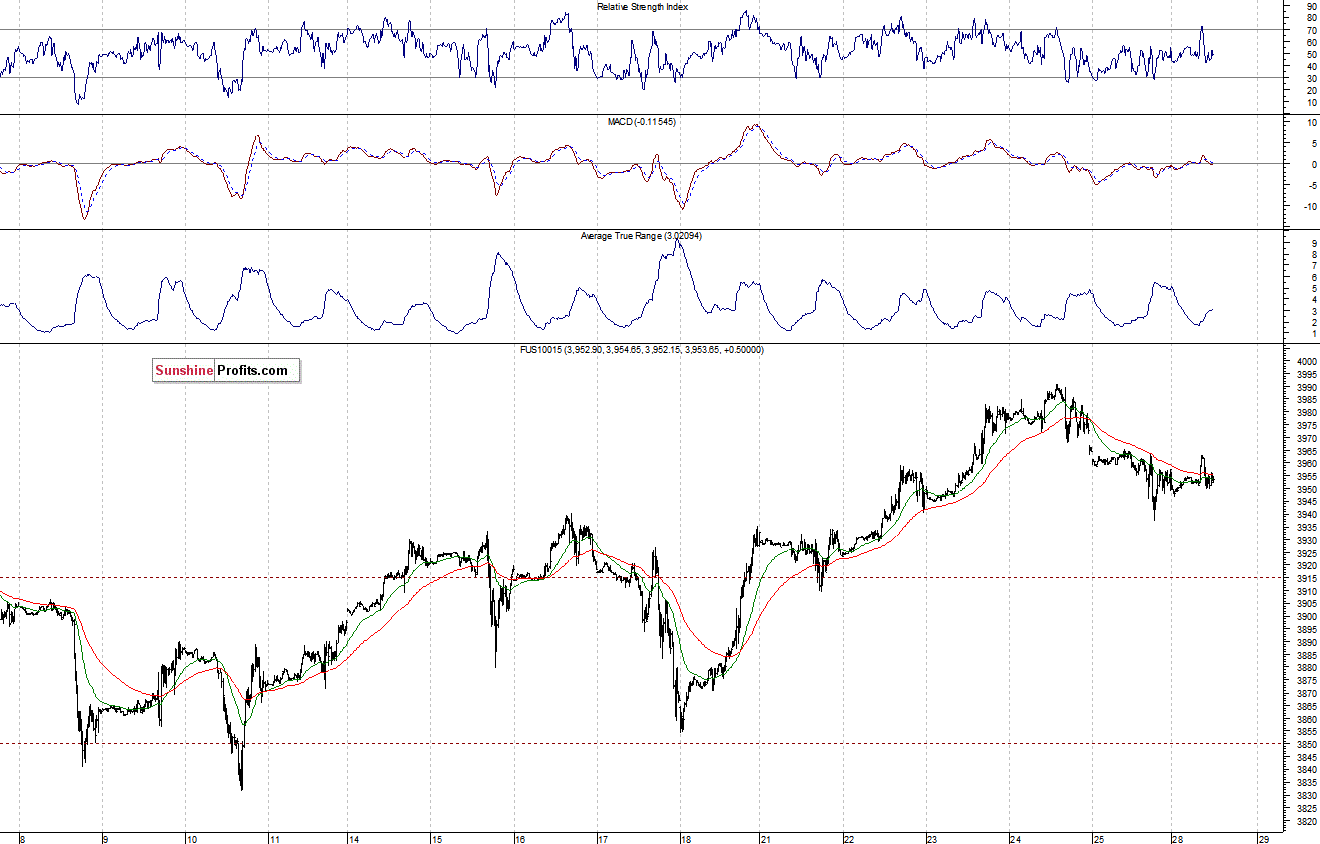
The technology Nasdaq 100 futures contract (CFD) followed a similar path, as it bounced off new long-term highs recently. The level of resistance is at around 3,990-4,000. On the other hand, the support level is at 3,930-3,940, among others, as the 15-minute chart shows:
Concluding, the broad stock market remains close to all-time highs, as the S&P 500 index trades slightly below the psychological resistance level of 2,000. Investors continue to hesitate ahead of key economic data announcements, including Wednesday’s U.S. GDP number and Friday’s Jobs report release. Will the uptrend continue? There have been no confirmed negative signals so far. However, the risk/reward ratio for the long positions seems unfavorable. Therefore, we think that it is better to stay out of the market at this moment. From my personal experience, it is better to get in the market too late, following a confirmation of a new short-term trend, than just bet on the direction of a potential breakout, getting in the market too early. We will let you know when we think it is safe to get back in the market.
Thank you.
Paul Rejczak
Stock Trading Strategist
Stock Trading Alerts

