
Briefly: In our opinion speculative long positions are favored (with stop-loss at 1,850, S&P 500 index).
Our intraday outlook is bullish, and our short-term outlook remains neutral:
Intraday
(next 24 hours) outlook: bullish
Short-term (next 1-2 weeks) outlook: neutral
Medium-term (next 1-3 months) outlook: neutral
Long-term outlook (next year): bullish
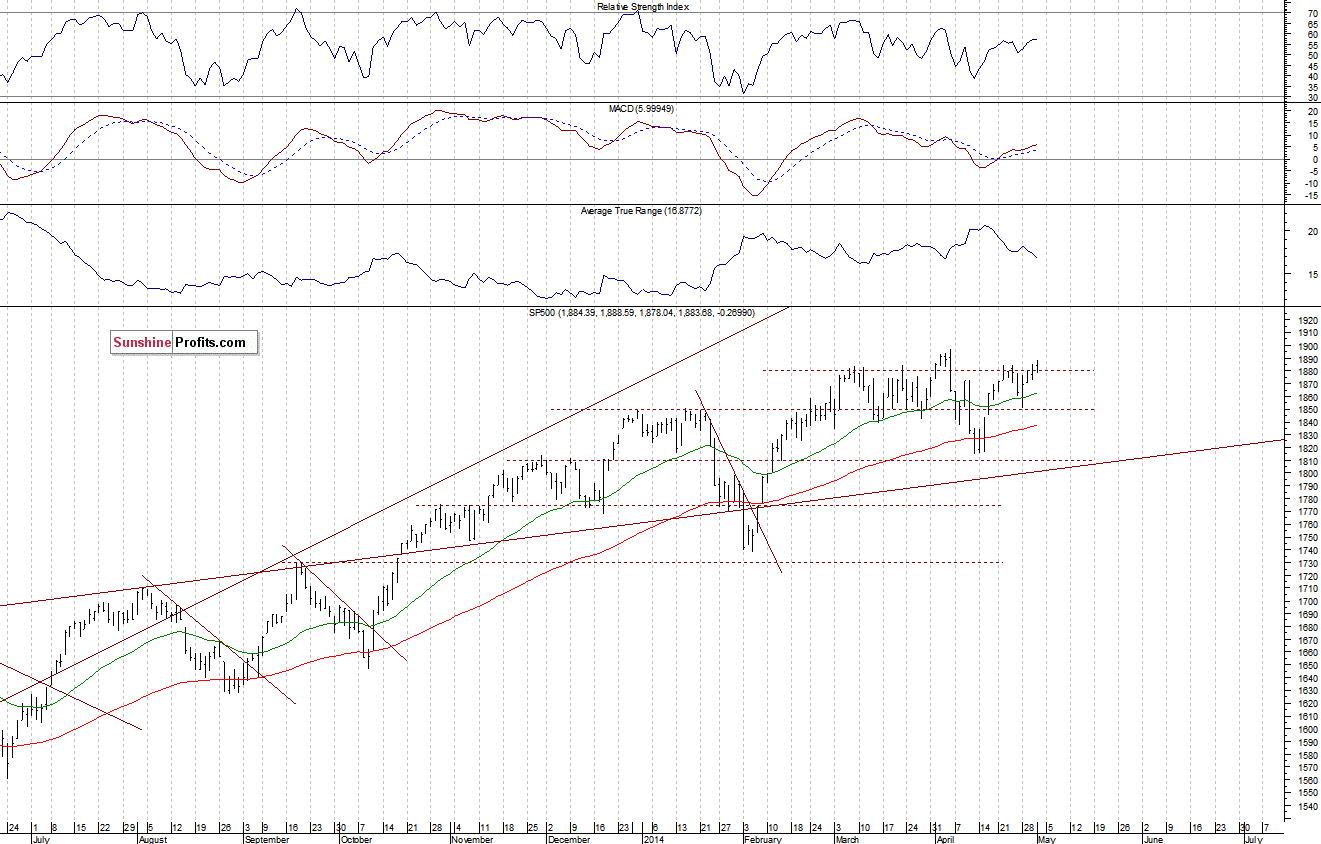
The U.S. stock market indexes were mixed between -0.1% and +0.3% yesterday, extending their short-term fluctuations following recent move up, as investors awaited today’s monthly employment report release, while most of the European stock markets paused for a holiday break. We have been right so far, concerning our speculative long position. However, a lot may depend on the markets’ reaction to these employment figures. The S&P 500 index trades slightly below its April 4 all-time high of 1,897.28. The resistance remains at 1,880-1,900. On the other hand the nearest important support is at 1,870, and the next support is at 1,840-1,850. There is no clear medium term direction, as the index continues to fluctuate within its March consolidation:
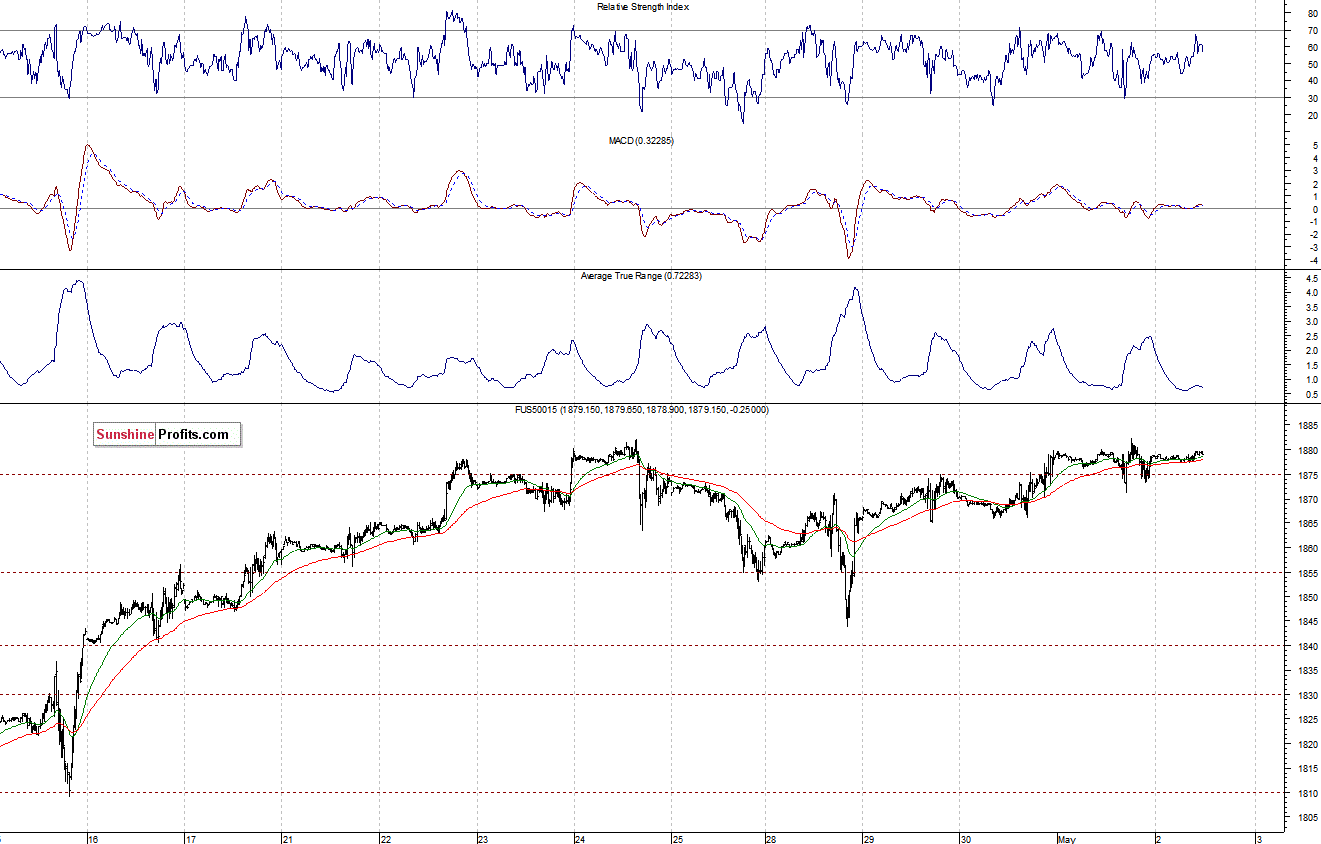
Expectations before the opening of today’s session are virtually flat, with index futures currently up 0.1%. The main European stock market indexes have been mixed so far. Investors will now wait for the economic data announcements: Nonfarm Payrolls and the Unemployment Rate number at 8:30 a.m., to be followed by the Factory Orders release at 10:00 a.m. The S&P 500 futures contract (CFD) trades in a relatively narrow intraday range, as it fluctuates along the level of 1,880. The nearest important level of support is at around 1,865, and the next support is at 1,845-1,855. For now, it looks like a flat correction within an uptrend, as we can see on the 15-minute chart:
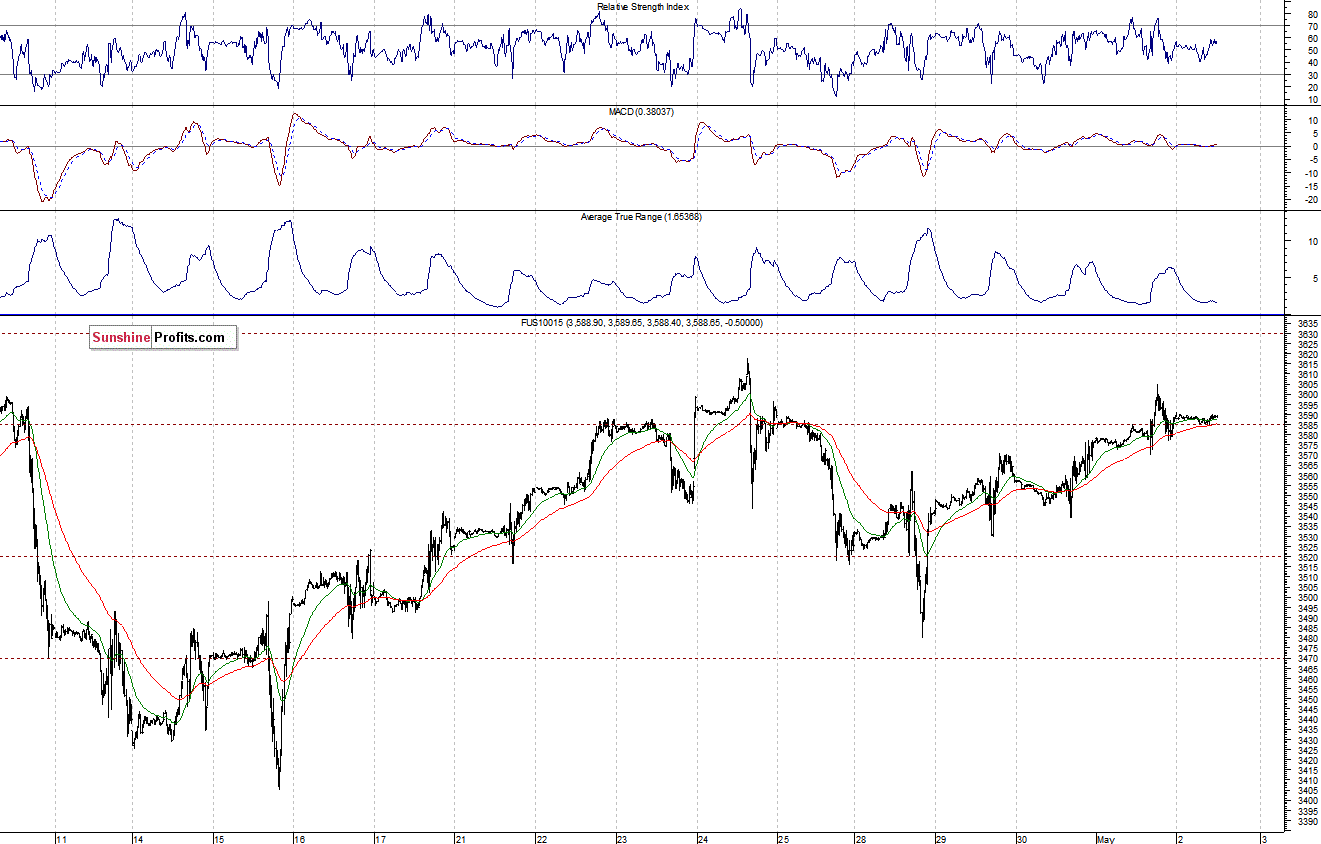
The technology Nasdaq 100 futures contract (CFD) continues to fluctuate below its late April local high and the resistance level of 3,600. There have been no confirmed negative signals so far. The nearest important support is at around 3,550-3,570, marked by some of the previous local extremes, as the 15-minute chart shows:
Concluding, the broad stock market extends its fluctuations slightly below its long-term highs, still with no clear short-term or medium-term direction. We remain cautiously optimistic, maintaining our speculative long positions.
Thank you.
Paul Rejczak
Stock Trading Strategist
Stock Trading Alerts

