
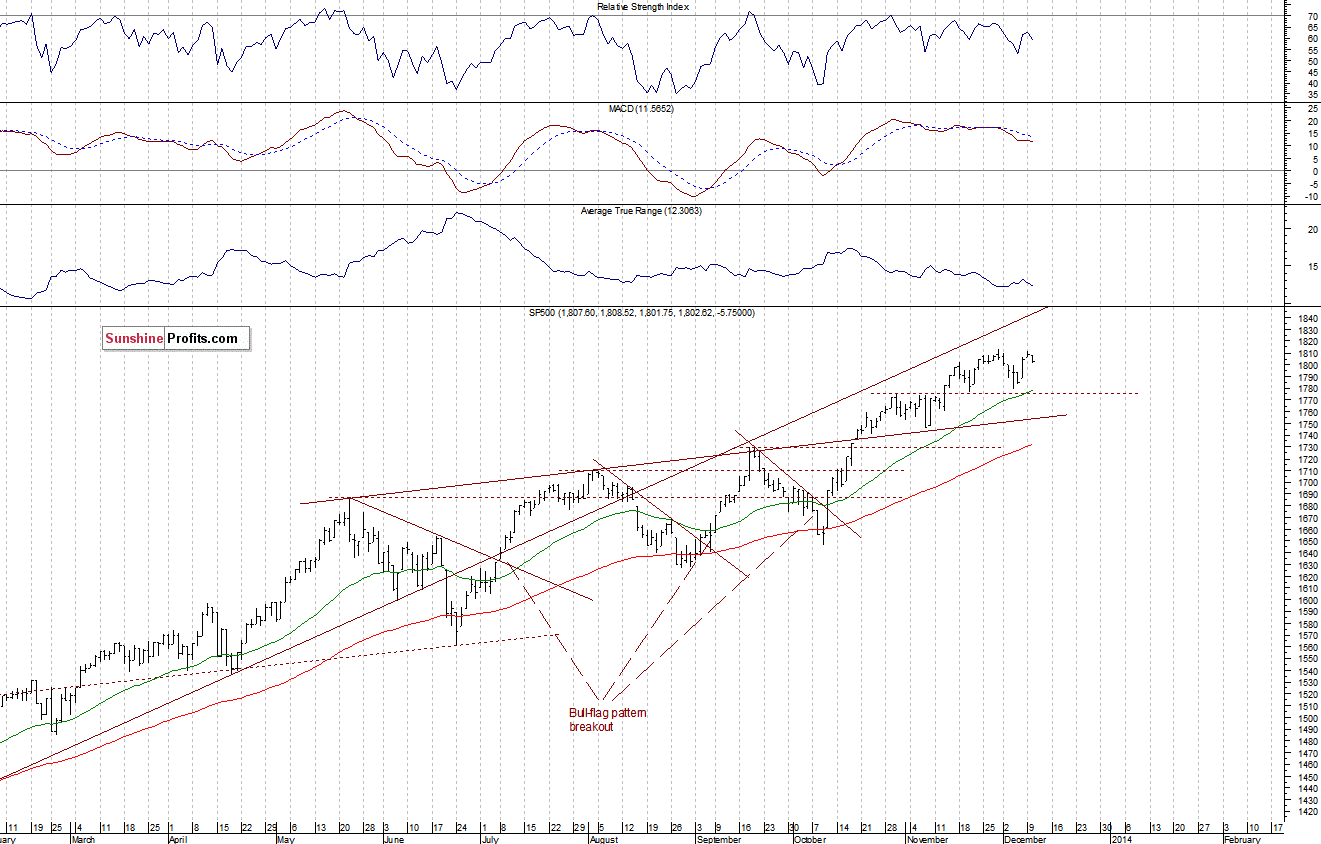
The U.S. stock market indexes lost between 0.1% and 0.3% yesterday, as investors took profits following Friday’s strong move up. The S&P 500 index extends its few week long consolidation, as it fluctuates near the level of 1,800. The nearest important resistance is at 1,810-1,815, marked by the November 29 all-time high of 1,813.55. On the other hand, the support is at 1,800, and the next support is at 1,770-1,775. For now, it looks like some sort of a topping consolidation, possibly head and shoulders pattern forming. However, there are no confirmed uptrend reversal signals so far:
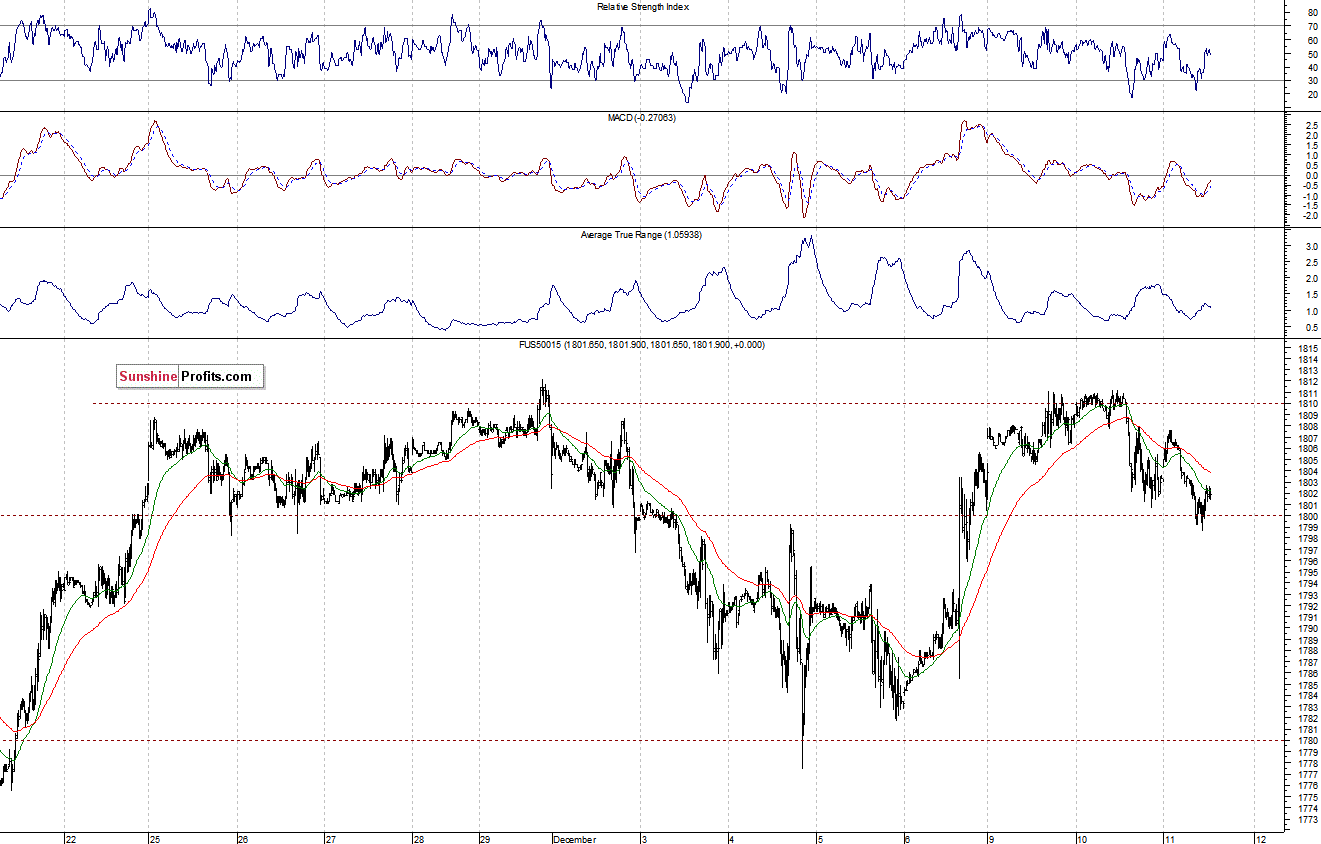
Expectations before the opening of today’s session are virtually flat, as the main European stock market indexes have gained 0.1-0.6% so far. The S&P 500 futures contract (CFD) retraced some of its recent move up, approaching the level of 1,800 once again. The resistance remains at around 1,800, and the support is at 1,800. The next support is at 1,780. The market is in a relatively narrow late November range, as we can see on the 15-minute chart:
Our intraday outlook remains bearish, and our short-term outlook is bearish:
Intraday (next 24 hours) outlook: bearish
Short-term (next 1-2 weeks) outlook: bearish
Medium-term (next 1-3 months) outlook: neutral
Long-term outlook (next year): bullish
The above analysis is the first of today's 2+ Stock Trading Alerts. Stay as updated as possible on the current events and trends on the
stock market by choosing our Stock Trading Alert subscription service
Thank you,
Paul Rejczak

