
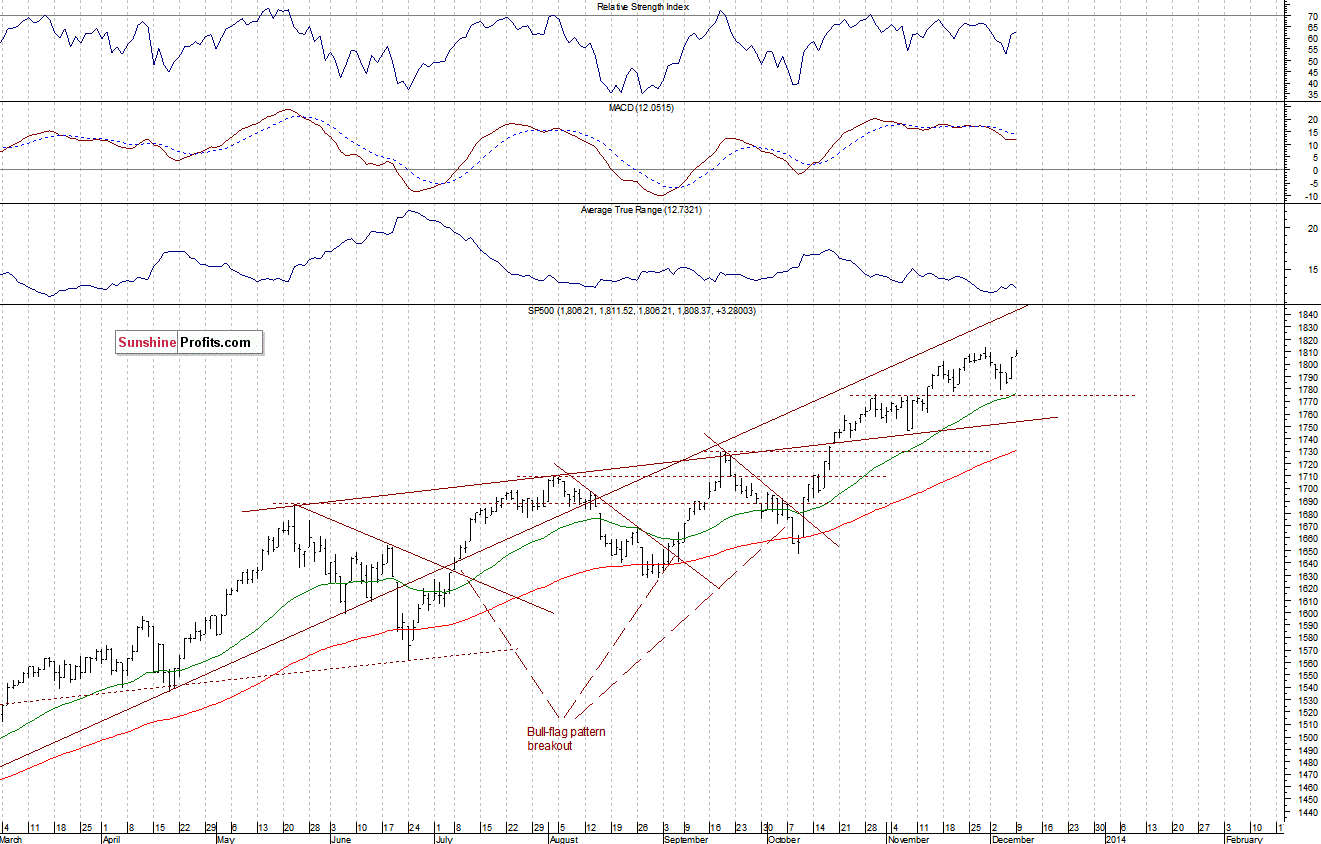
The major U.S. stock market indexes were mixed between 0.0% and +0.3% yesterday, as investors hesitated after Friday’s move up. The S&P 500 index tested the resistance at 1,810-1,815, marked by the November 29 all-time high of 1,813.55. There is some selling pressure in that area. On the other hand, the nearest important support is at around 1,800, and the next support is at 1,770-,1775, marked by the late October, early November consolidation, followed by some local lows, as we can see on the daily chart:
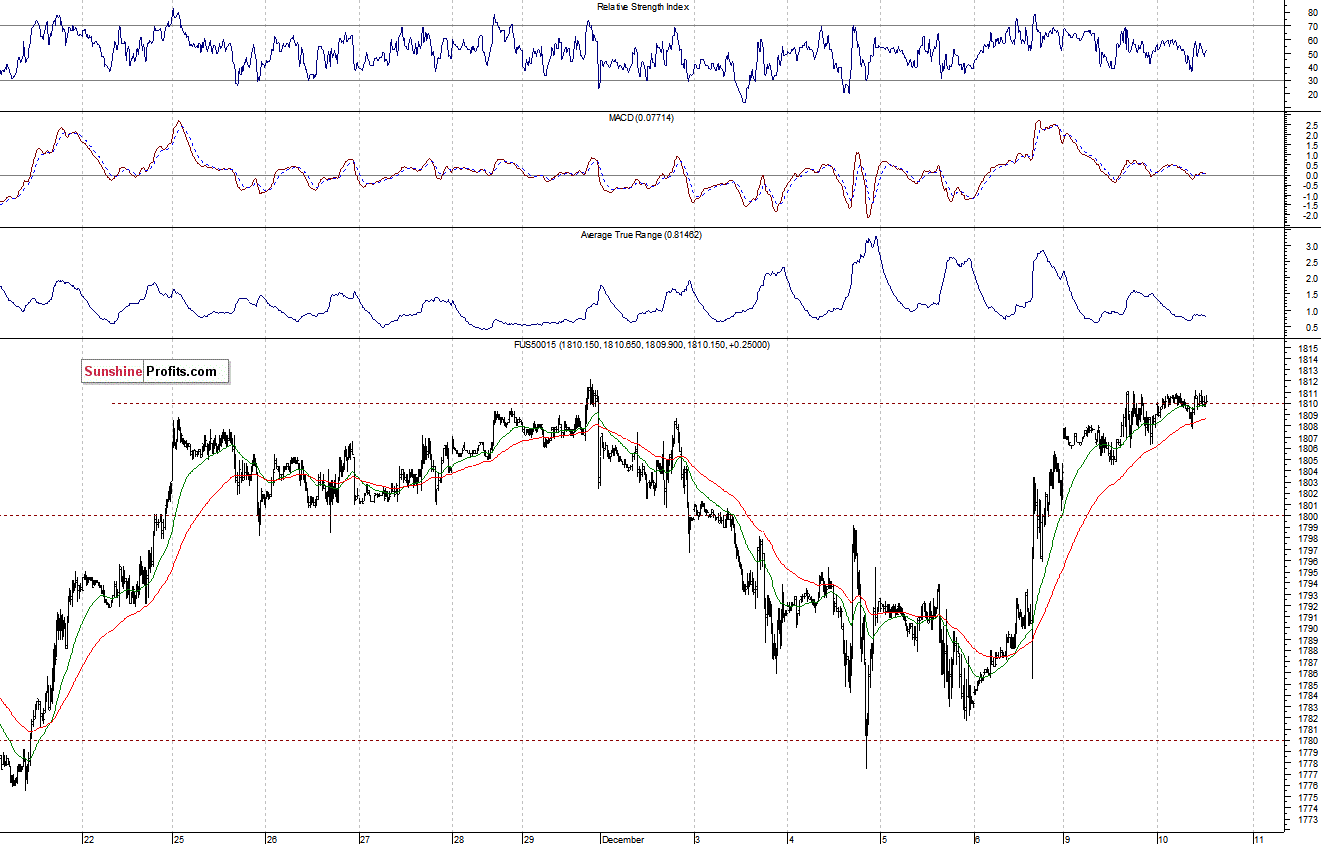
Expectations before the opening of today’s session are slightly positive, with index futures currently gaining 0.1-0.2%. The European stock market indexes have gained 0.1-0.3% so far. Investors will now wait for the Wholesale Inventories number at 10:00 a.m. The S&P 500 futures contract (CFD) trades in a relatively narrow range, near its previous high. Will it break above the resistance? For now, it only looks like a few-week long consolidation. The nearest support is at 1,800, as the 15-minute chart shows:
Our intraday outlook remains bearish, and our short-term outlook is bearish:
Intraday (next 24 hours) outlook: bearish
Short-term (next 1-2 weeks) outlook: bearish
Medium-term (next 1-3 months) outlook: neutral
Long-term outlook (next year): bullish
The above analysis is the first of today's 2+ Stock Trading Alerts. Stay as updated as possible on the current events and trends on the
stock market by choosing our Stock Trading Alert subscription service
Thank you,
Paul Rejczak

