
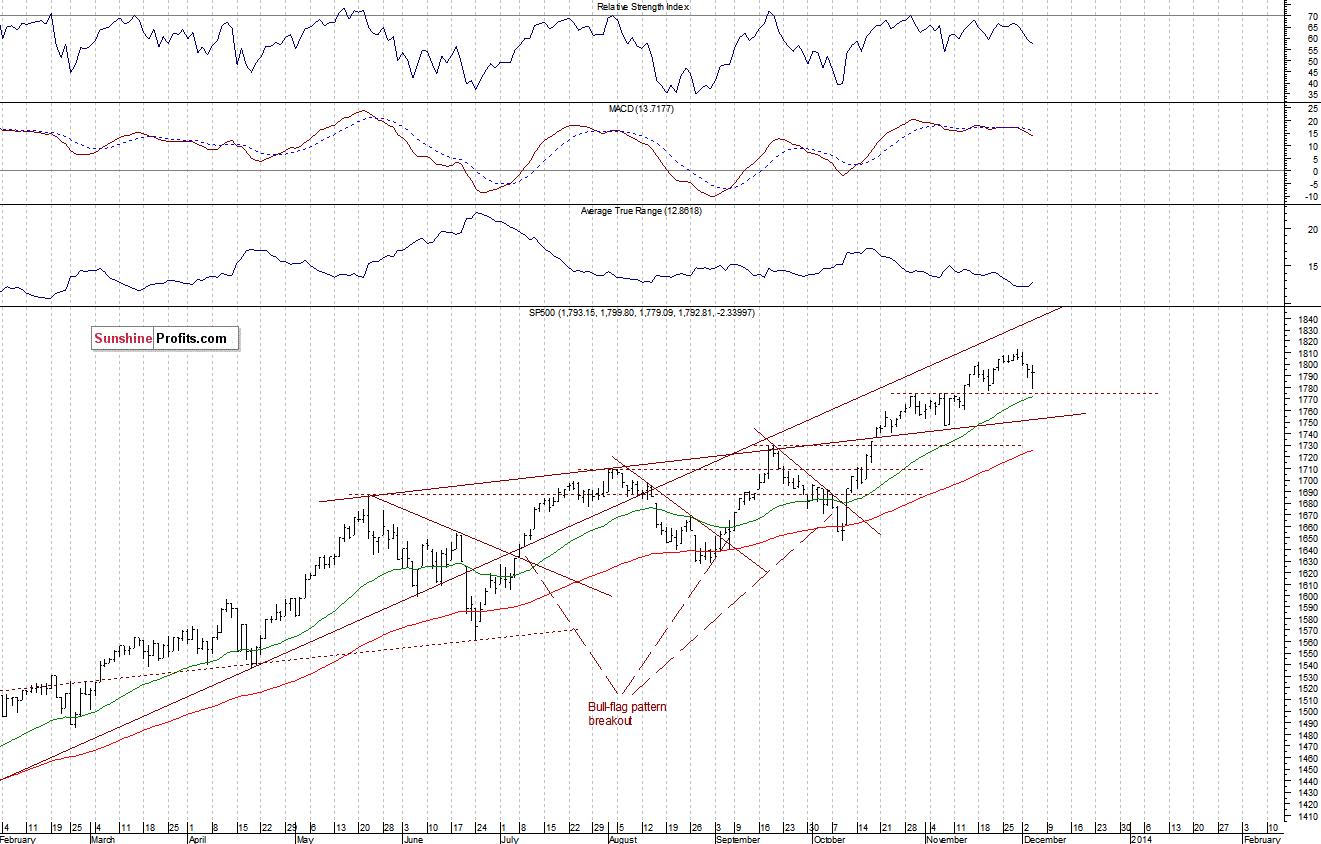
The U.S. stock market indexes were mixed between -0.2% and +0.1% on Wednesday, as investors hesitated following recent economic data announcements. The S&P 500 index re-tested its support at 1,770-1,775, before bouncing off to neutral close. For now, it looks like a correction within the long-term uptrend. The nearest resistance is at 1,800, and the next resistance is at 1,810-1,815, marked by Friday’s all-time high of 1,813.55, as we can see on the daily chart:
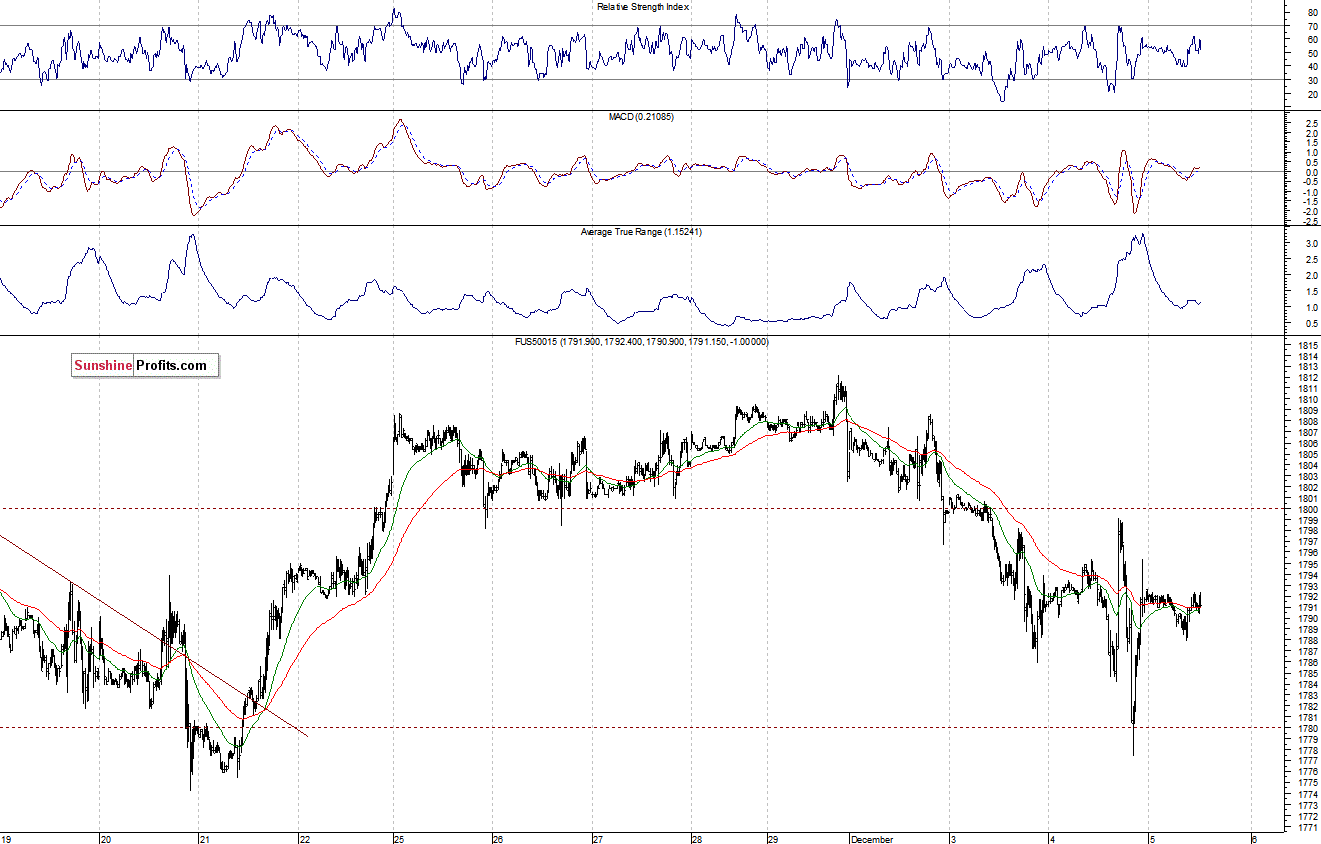
Expectations before the opening of today’s session are virtually flat, as the main European stock market indexes have gained 0.1-0.2%. Investors will now wait for some further economic data announcements: Challenger Job Cuts report at 7:30 a.m., Initial Claims and GDP at 8:30 a.m., and Factory Orders at 10:00 a.m. The S&P 500 futures contract (CFD) fluctuates in a relatively narrow range, after yesterday’s volatile trade. The support remains at around 1,775-1,780, and the resistance is at 1,800:
Our intraday outlook remains bearish, and our short-term outlook is bearish:
Intraday (next 24 hours) outlook: bearish
Short-term (next 1-2 weeks) outlook: bearish
Medium-term (next 1-3 months) outlook: neutral
Long-term outlook (next year): bullish
The above analysis is the first of today's 2+ Stock Trading Alerts. Stay as updated as possible on the current events and trends on the
stock market by choosing our Stock Trading Alert subscription service
Thank you,
Paul Rejczak

