
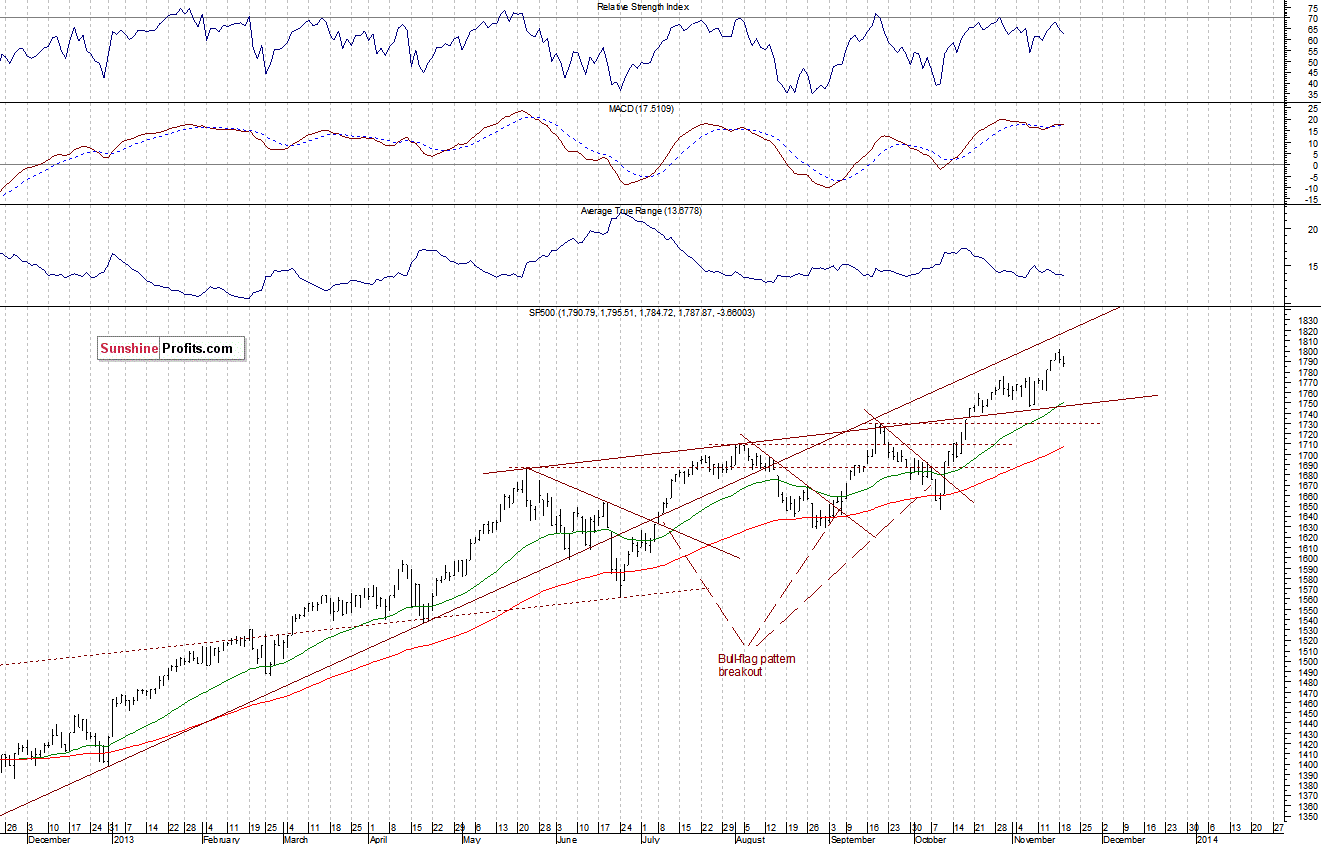
The major U.S. stock market indexes lost between 0.1% and 0.3% yesterday, as investors continued to take profits following recent rally. The S&P 500 was down 0.2%, as it retreated slightly from the level of 1,800 and Monday’s record high at 1,802.33. Thus, the resistance remains at around 1,800. On the other hand, the nearest important level of support is at 1,770-1,775, marked by the late October, early November consolidation. For now, it looks like a correction within an uptrend, however, a negative scenario cannot be excluded. The area of 1,750-1,770 seems to be a crucial support for the S&P 500 index, as we can see on the daily chart:
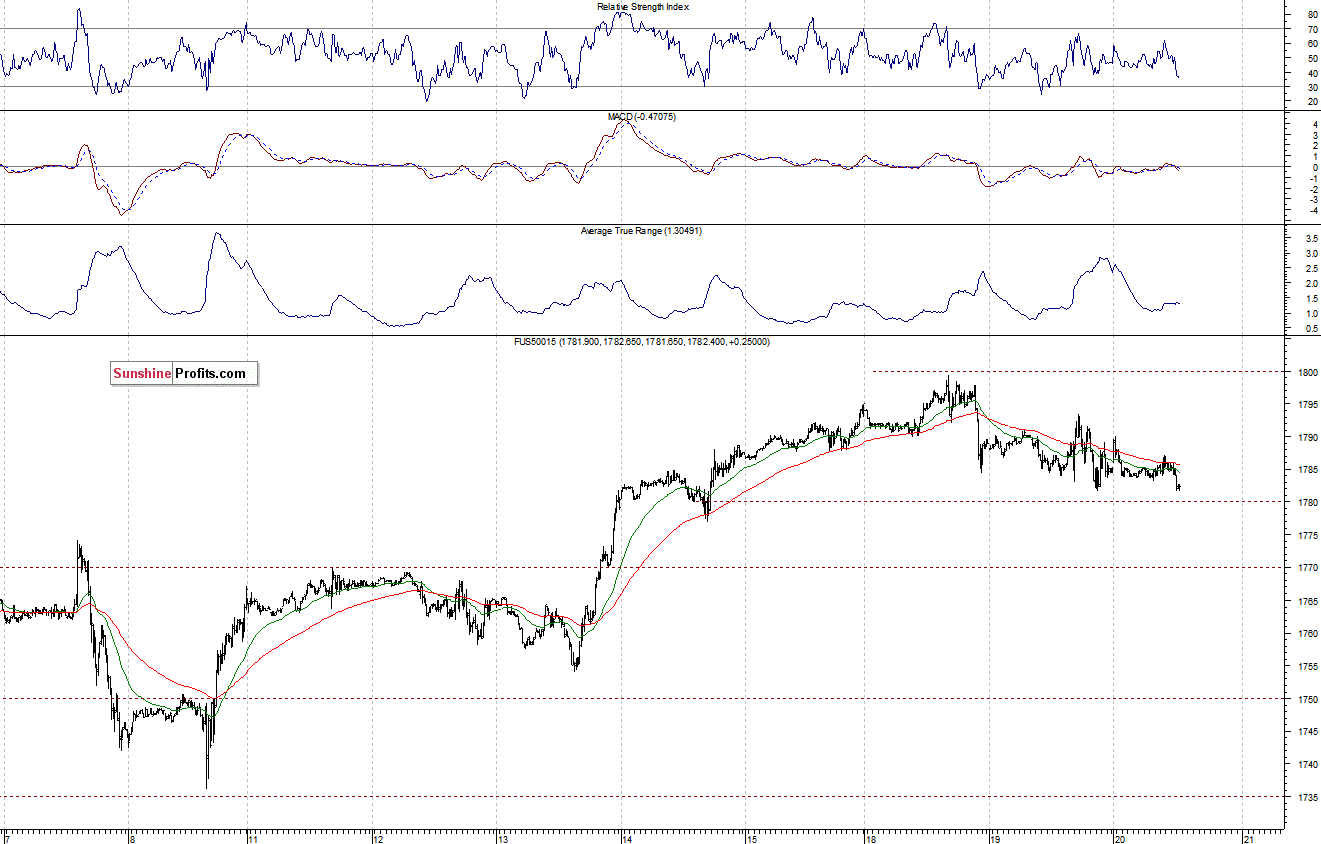
Expectations before the opening of today’s session are virtually flat, with index futures currently down 0.1%. The European stock market indexes have lost between 0.2% and 0.5% so far. Investors will now wait for some important economic data announcements: Retail Sales and Consumer Price Index at 8:30 a.m., Existing Home Sales and Business Inventories at 10:00 a.m. Then, investors will focus on the FOMC Minutes release at 2:00 p.m. The S&P 500 futures contract (CFD) trades in a rather narrow range. The nearest support is at around 1,780-1,785, as the 15-minute chart shows:
Our intraday outlook remains bearish, and our short-term outlook is bearish:
Intraday outlook: bearish
Short-term outlook: bearish
Medium-term outlook: neutral
Long-term outlook: bullish
The above analysis is the first of today's 2+ Stock Trading Alerts. Stay as updated as possible on the current events and trends on the
stock market by choosing ourStock Trading Alert subscription service
Thank you,
Paul Rejczak

