
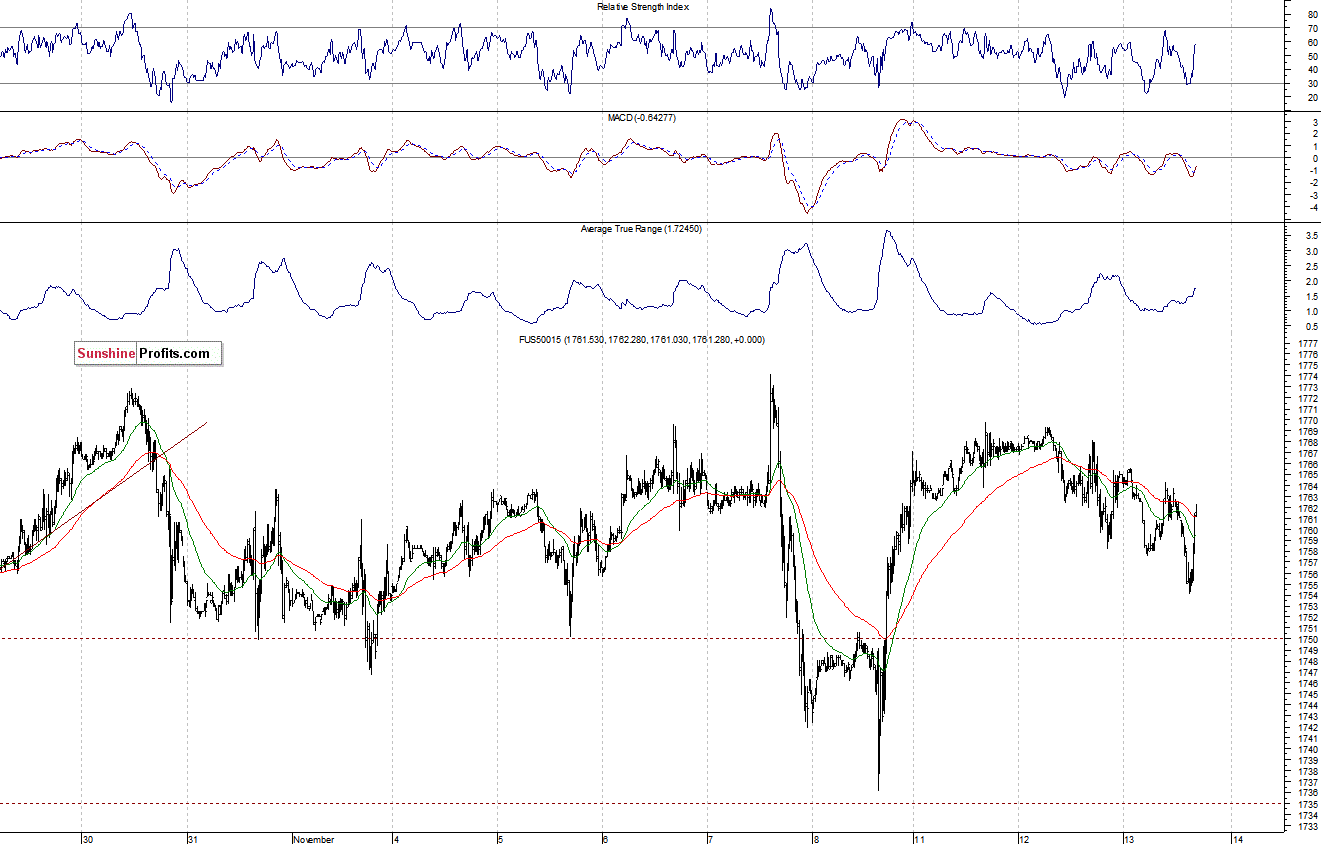
The U.S. stock market indexes are currently down between 0.1% and 0.3%, extending their recent consolidation. The S&P 500 index remains less than 1% below its October 30 all-time high of 1,775.22. The nearest important resistance is at around 1,770-1,775. The S&P 500 futures contract (CFD) trades in a relatively narrow range. The resistance is at 1,770, and the support is at 1,750-1,755, as we can see on the 15-minute chart:
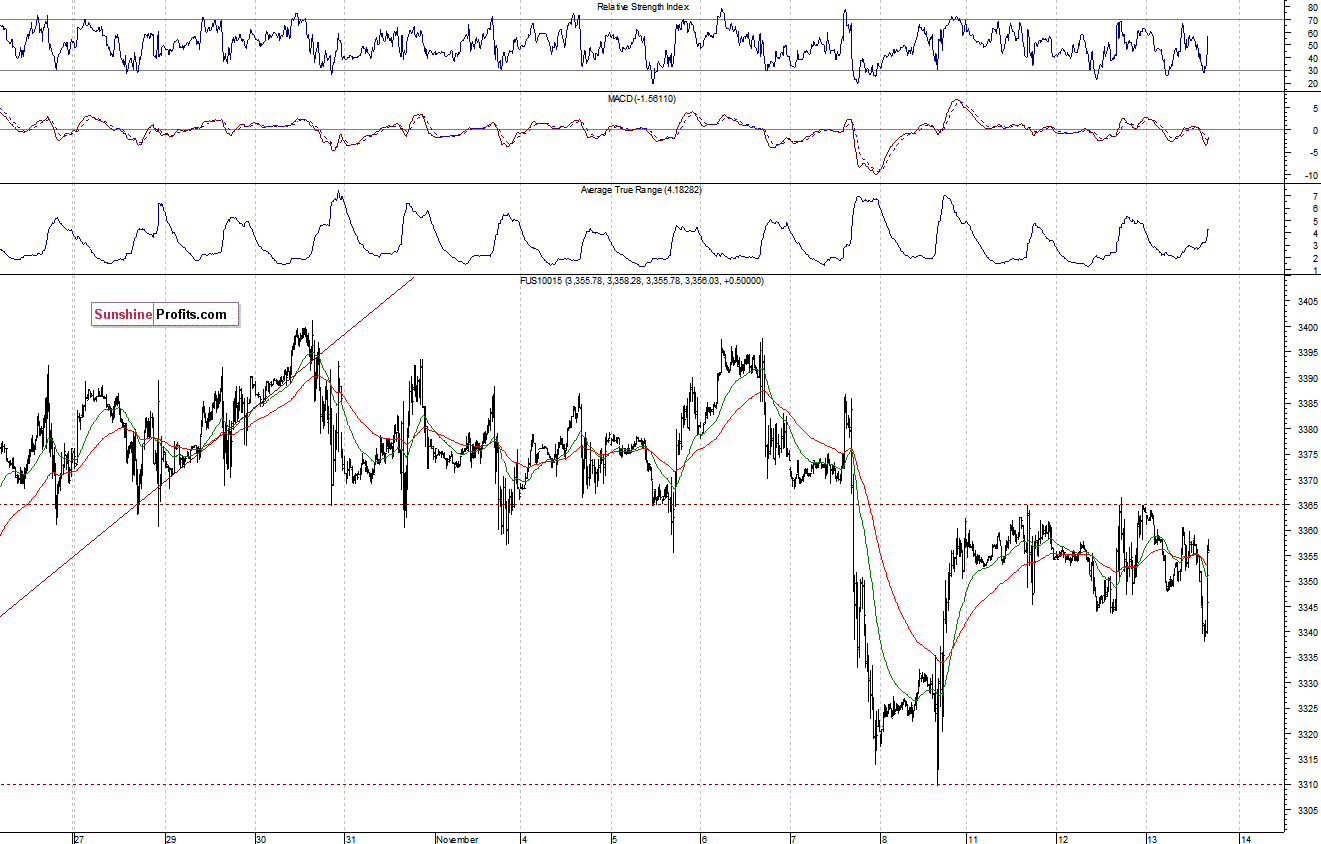
The Nasdaq 100 futures contract (CFD) is below its resistance at around 3,365. The market extends the recent consolidation. On the other hand, the nearest support is at 3,340-3,345, as the 15-minute chart shows:
Our intraday outlook remains bearish, and our short-term outlook is bearish:
Intraday outlook: bearish
Short-term outlook: bearish
Medium-term outlook: neutral
Long-term outlook: bullish
Thank you,
Paul Rejczak

