

Please note that due to market volatility, some of the key levels may have already been reached and scenarios played out.
Trading positions
- Henry Hub Natural Gas No new position justified on a risk/reward point of view.
- RBOB Gasoline No new position justified on a risk/reward point of view.
- WTI Crude Oil Enter short on the October contract around the 50-day moving average (currently at $ 95.25) with a stop at $ 99.75 (previous swing high from Jul-29) and targets projected at $ 90.07, $ 88.50, and $ 86.07.
- Brent Crude Oil No new position justified on a risk/reward point of view.
Regarding risk management, it is always best to define your strategy according to your own risk profile. For some guidance on trade management, read one of my articles on that topic.
What are the (macro-)economic, geopolitical, and technical factors driving oil prices this week?
Crude oil settled on Wednesday at its highest level in nearly a month, boosted by another larger-than-expected drop in U.S. crude inventories. The prospect of a possible OPEC+ production cut announced by Saudi Arabia following a potential return of Iranian barrels into the market also played a part in this.
Macroeconomics
On the macroeconomic view, the greenback went towards its highest level against a basket of currencies this week as the US dollar index (DXY) topped 109.270 on Tuesday – just getting close enough to its 109.294 top reached on July-14.
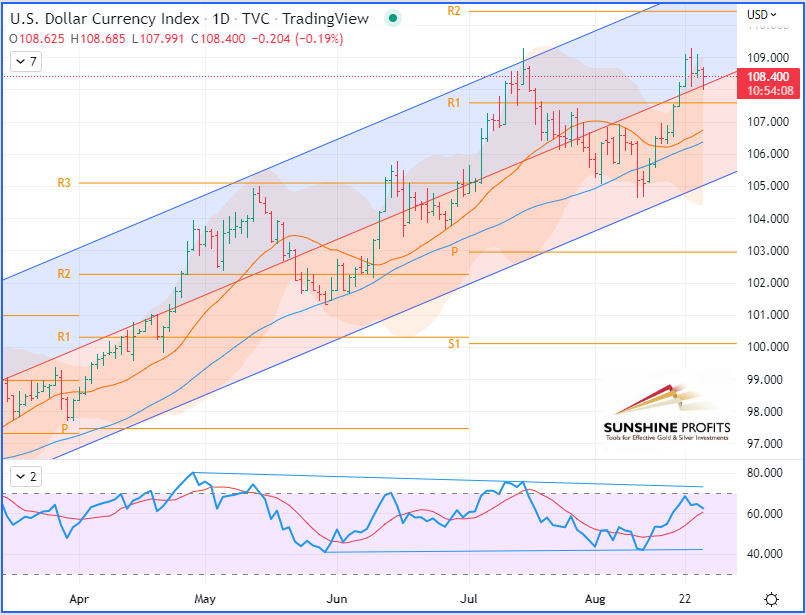
U.S. Dollar Currency Index (DXY), daily chart
Fundamental Analysis
On Wednesday, the Energy Information Administration (EIA) released the weekly change in Crude Oil Inventories.
U.S. Crude Oil Inventories
During the week ended August 19, commercial oil stocks contracted by 3.3M barrels, while analysts were anticipating a lighter decline.

On the other hand, strategic oil reserves have lost 8.1M barrels, a record, according to Kpler. All in all, U.S. stocks, both commercial and strategic, are at their lowest level for nearly 20 years (since June 2003).
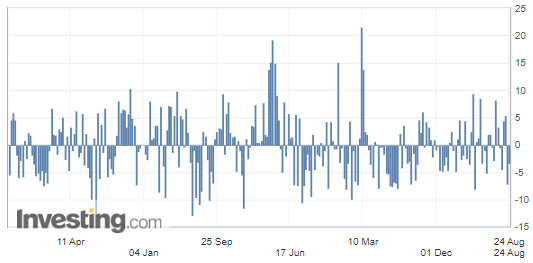
(Source: Investing.com)
This contraction in crude stocks is largely attributable to the high level of exports since the acceleration in European demand is helping to push up US exports and therefore lower inventories. Indeed, total crude and refined product exports reached an all-time high level last week – 11M barrels per day – 40% more than a year ago at the same time.
U.S. Gasoline Inventories
Regarding the U.S. gasoline demand figures, the market players were sensitive to the maintenance of gasoline inventories at an almost unchanged level, while analysts expected a drop of 1.5 million barrels over the week.

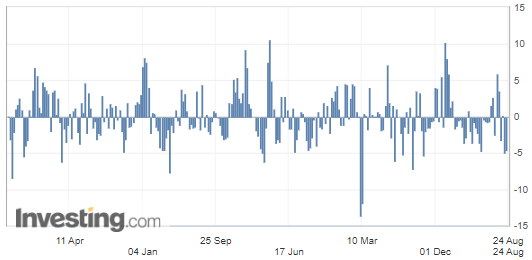
(Source: Investing.com)
This may trigger the effect of heightening concerns about an economic slowdown given that weekly gasoline demand figures have been very volatile throughout the summer.
Geopolitics
On the geopolitical scene, the negotiations around the Iranian nuclear deal, foretelling a return of Iranian barrels, were followed by the eventual prospects of OPEC+ members, which would cut their output in this eventuality, so it offset the bearish factor that I was mentioning last week.
Technical Analysis – Introduction to Regression Channels
On the daily chart, WTI crude oil (October contract) has just reached the upper band of the regression channel, set up as two standard deviations from the mean regression line. The latter being the best fit with a Pearson’s R coefficient of 86.5. For those who are not too familiar with this statistical tool, it just means that the regression-based (mean) trend line is defined with a correlation of about 86.5 % compared to the evolution of prices since the end of May. For a quick introduction to regression channels, here is a short video published by TD Ameritrade.
Therefore, the price area around $ 94.50, which also corresponds to the location of the 50-day moving average, could potentially be a good level to enter a short trade with a relatively tight stop and a price target providing a fairly good risk/reward ratio from a money management point of view. More details of this trade projection will be provided within our subscribers’ section.
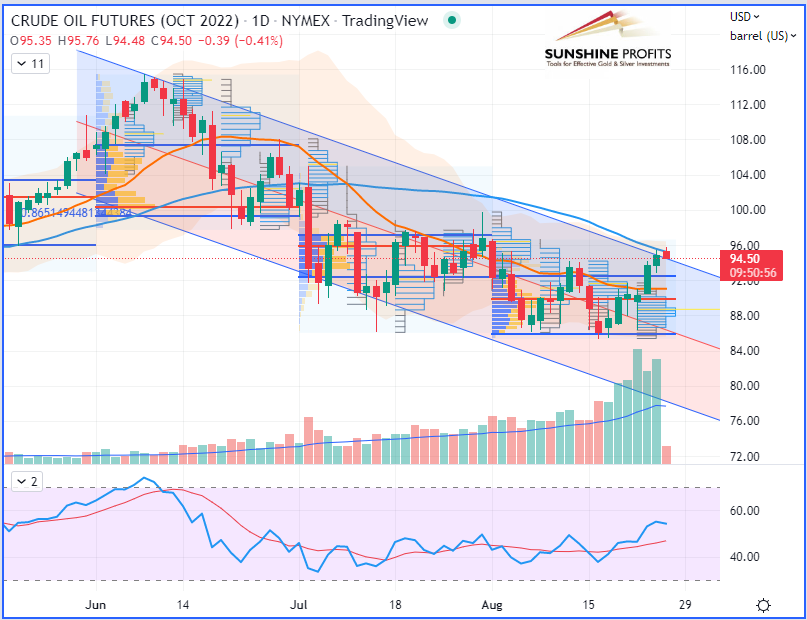
WTI Crude Oil (CLV22) Futures October contract, daily chart)
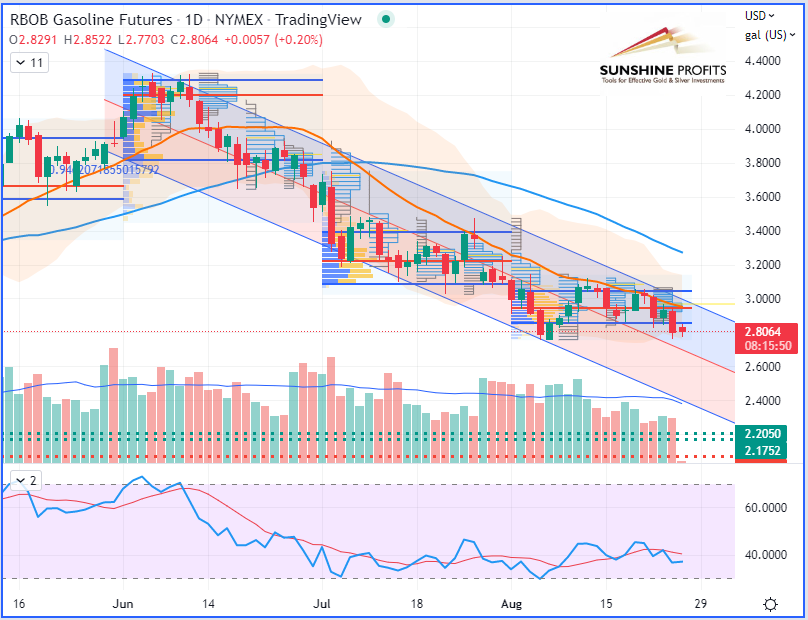
RBOB Gasoline (RBV22) Futures (October contract, daily chart)
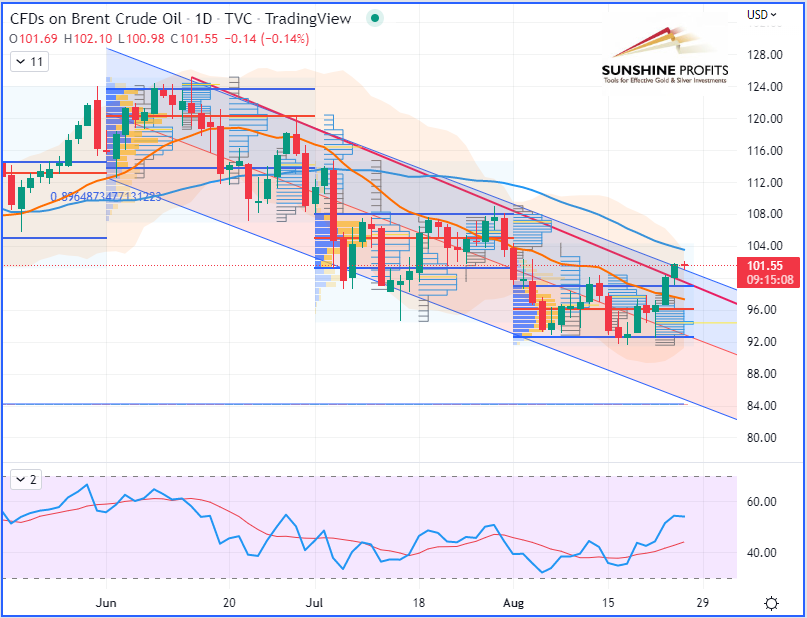
Brent Crude Oil (BRNV22) Futures (October contract, daily chart) – Contract for Difference (CFD) UKOIL
That’s all, folks. Happy trading!
As always, we’ll keep you, our subscribers well informed.
Thank you.
Sebastien Bischeri
Oil & Gas Trading Strategist

