

Please note that due to market volatility, some of the key levels may have already been reached and scenarios played out.
Trading positions
- Henry Hub Natural Gas No new position justified on a risk/reward point of view.
- RBOB Gasoline No new position justified on a risk/reward point of view.
- WTI Crude Oil Enter short on the October contract around the 50-day moving average (currently at $ 95.25) with a stop at $ 99.75 (previous swing high from Jul-29) and targets projected at $ 90.07, $ 88.50, and $ 86.07.
- Brent Crude Oil No new position justified on a risk/reward point of view.
Regarding risk management, it is always best to define your strategy according to your own risk profile. For some guidance on trade management, read one of my articles on that topic.
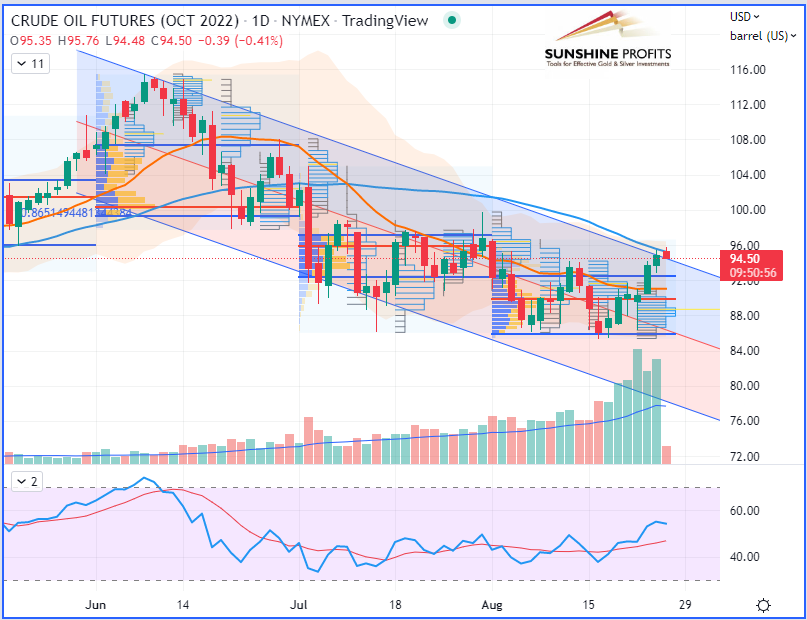
WTI Crude Oil (CLV22) Futures (October contract, daily chart) – Chart based on Aug-25’s data…
Welcome on board! Today, I will provide a quick review of last week’s WTI crude oil trade, which has been a little more complex to manage than I originally thought…
My short trade entry was done right around $94.50-95.25 – around the 50-day moving average (DMA) – with a stop placed at the previous swing low ($99.75).
Then, as the market fell rapidly into the August value area (VA), I decided to drag my stop lower ($95.76) and so well above the 50-DMA. In the meantime, as the market retraced slightly while finding rejection to the upside, it finally settled by forming a “doji” candlestick on Friday.
A reminder on risk management:
If, like me, you followed the risk management guidelines that I presented in this article that were recalled below the trading position section – that is to say, by dragging the stop slightly lower when price was reaching levels below the midpoint to target one ($90.07) – then let’s recap how to locate the new stop placement by taking the following example:
- Let’s say you entered at $95;
- The first target was defined at $90;
- When the price falls below the midpoint: 90.07+(95-90.07)/2 = $92.54;
- The market made its low on Friday (Aug-26) at $91.08 (so just $1 above its initial target);
- Thus, given that this low was $1.46 below the midpoint (92.54-91.08 = 1.46), the stop can be dragged down $1.46 below the entry ($95) to protect the trade, therefore at $93.55 precisely.
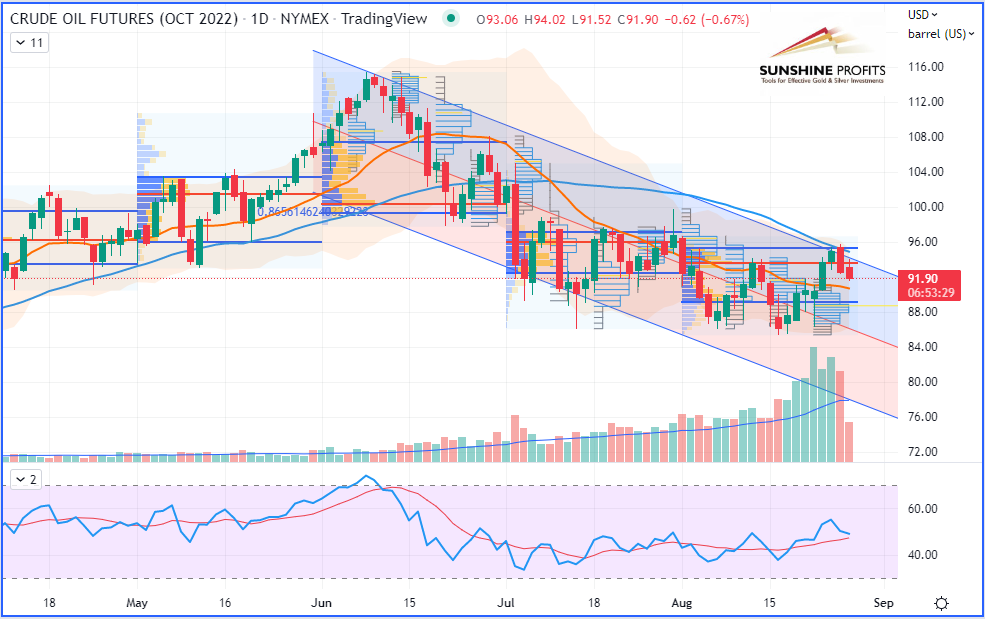
WTI Crude Oil (CLV22) Futures (October contract, daily chart) – Chart based on Aug-26’s data, however the market closed on a “doji” candle (in other terms, it closed at its open price) – See following chart with highlighted doji…
Personally, this is what I’ve been doing myself:
Since I provided 3 targets for that trade, I entered with 3 micro e-mini contracts (MCL), with 3 initial stops placed at $99.75. On Friday (Aug-26), I dragged the stop for one contract (first third of the position) at $95.76, then another stop for the second contract (second third of the position) at $93.55 (as defined below), and I left the third stop (last third of the position) at the initial level of $99.75. By doing so, my risk was spread to different levels.
If you noticed in my last article, I suggested reducing the risk just before the weekend. This is crucial to do so before the weekend. I know there might be some slippage risk eventually when the market opens on Sunday night and if something happens during the weekend. However this is still better than doing nothing and seeing some profits being swept away by sudden events that were not priced in the market.
On Saturday, there was a geopolitical event that wasn’t expected at all, and as a result, it shook the oil market towards the upside on Monday (Aug-29).
Indeed, there were unexpected fights in Libya's capital of Tripoli - the worst fighting in years - which were quickly priced into the oil market on Monday because the situation could have a significant impact on Libyan oil exports. Consequently, during that strong move up, two of my stops got triggered on Monday (Aug-29). Those were placed at $93.55 (so about $145 gross profits) and $95.76 (about $77 losses) on micro e-mini contracts, excluding commissions.
Since I had left my last target at $86.07 for the last remaining third of my trading position, as the market today just moved below my second stop and also made a lower low over the third consecutive day, I just finally dragged my last stop at the high of today’s candlestick, so hopefully this will leave enough breathing space prior to reach the last and final target ($86.07).
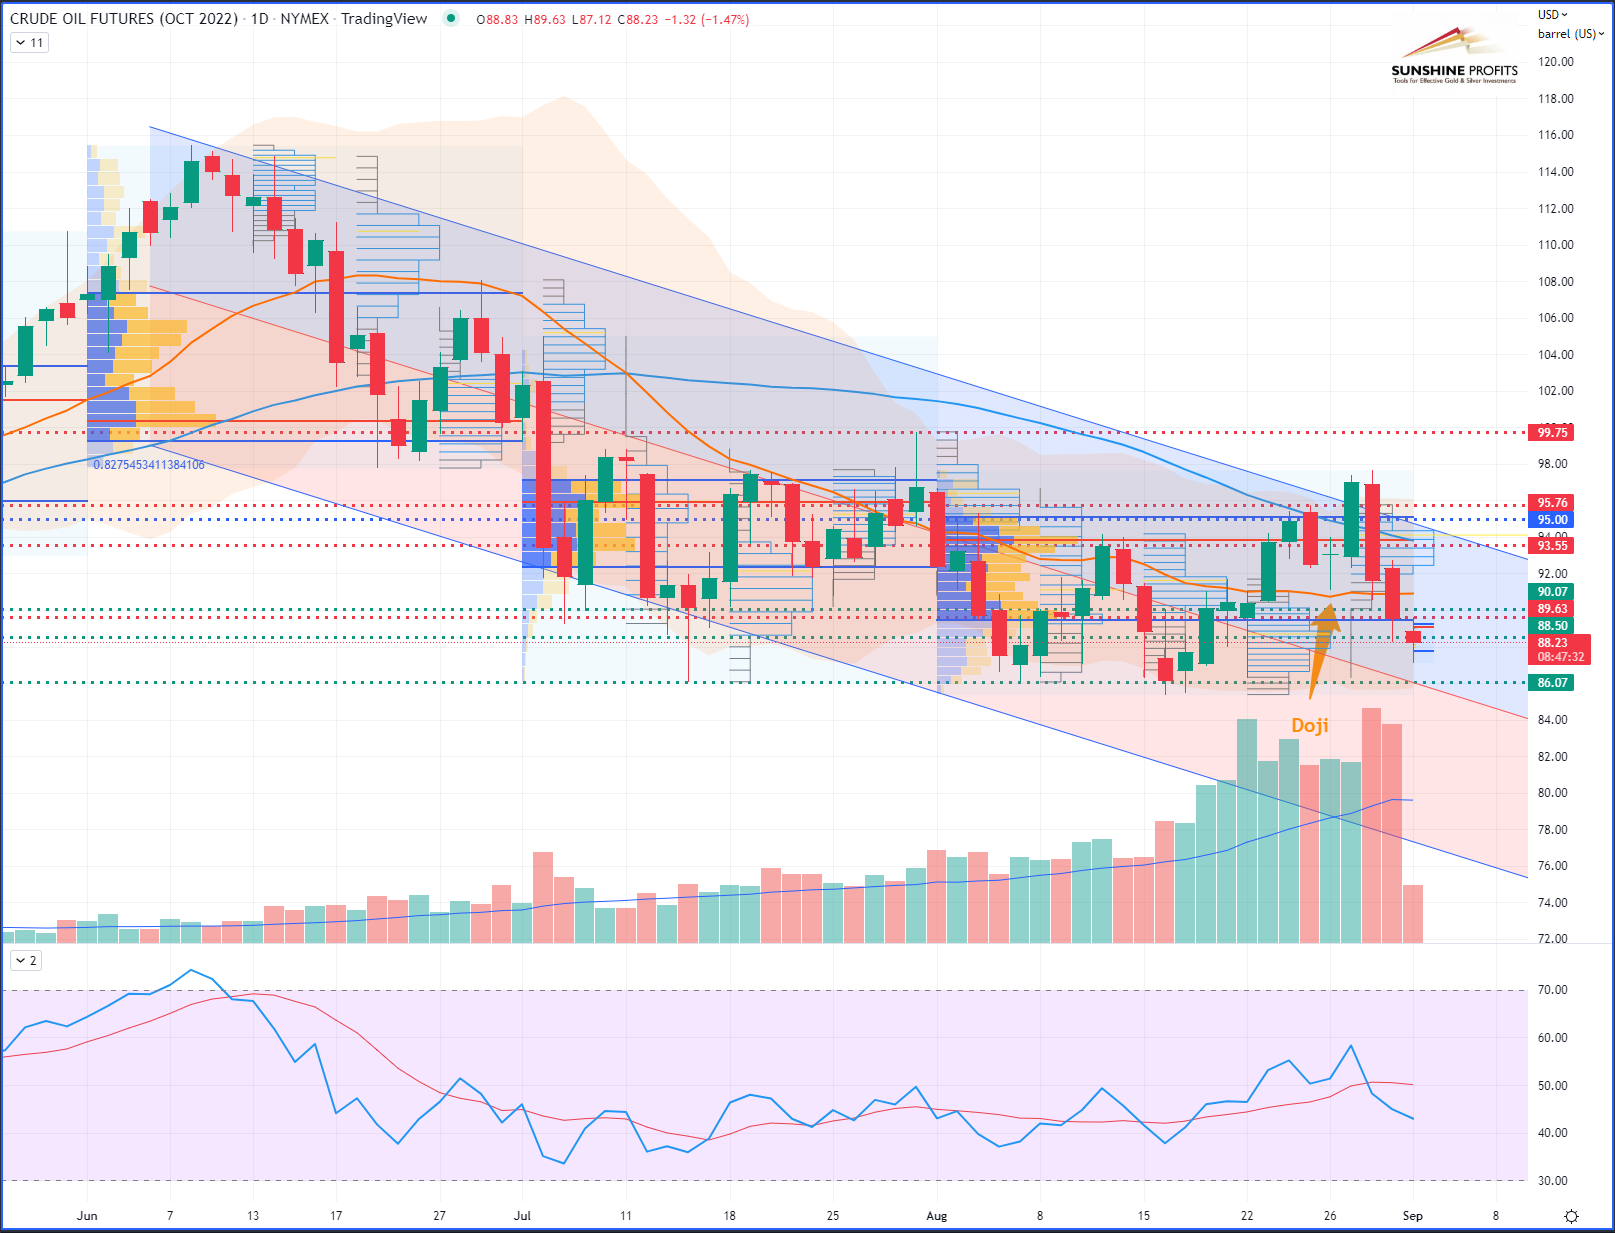
WTI Crude Oil (CLV22) Futures (October contract, daily chart) – Chart based on today’s updated data.
I hope this will make sense to you guys, and if that may help you see risk management in a more dynamic dimension, as I am trying to do, then it would be helpful to get your feedback.
How do you manage your risk? Do you use multiple stop levels as well in certain situations? Do you prefer sticking to a static level to allow your entire trade position to "breathe," or do you prefer manually closing a position whenever it reaches a desired level or gives you potential reversal signals? In the latter case, which signals would you rely on?</position>
That’s all, folks. Have a great weekend! By the way, from this new starting month, expect some more trading alerts, with the introduction of new charting tools and some market insights presented in a new format. So just stay tuned!
As always, I welcome any recommendations you may have on different assets, markets, or products, so feel free to write me back or send your own suggestions in the comments section.
As always, we’ll keep you, our subscribers, well informed.
Thank you.
Sebastien Bischeri
Oil & Gas Trading Strategist

