
Today, crude oil edged lower and extended Monday’s steep losses, as diplomatic resolution to the Syrian crisis calmed worries that crude supply from the Middle East would be at risk. The United States agreed to call off military action against Syria under a deal with Russia to remove President Bashar al-Assad's chemical weapons stockpile.
What impact did it have on crude oil’s chart?
Yesterday, light crude lost over 2% and dropped to its lowest level since September 3. Additionally, crude oil declined below the 50-day moving average, which is not a good sign for oil bulls. However, the breakdown is not confirmed at the moment.
Keep in mind that this moving average stopped the decline in June and, again, at the end of August. We also saw similar price action at the beginning of September, which means that the 50-day moving average is a major ally of the buyers.
Please note that slightly below today’s levels there is also the rising support line based on the August lows (close to $105.46), which stopped oil bears on September 3. If it holds, we will likely see a pullback in near term. However, if it is broken buyers will lost their major supports and the current correction will likely prolong. Where will the sellers’ target be? It will likely be between $102.22 and $103.50, where the next strong support zone is. It is based on the bottom of the previous corrective move (the August 21 low) and the August low.
Another bearish factor, which may encourage oil bears to act, is a head and shoulders formation on the 4-hour chart.
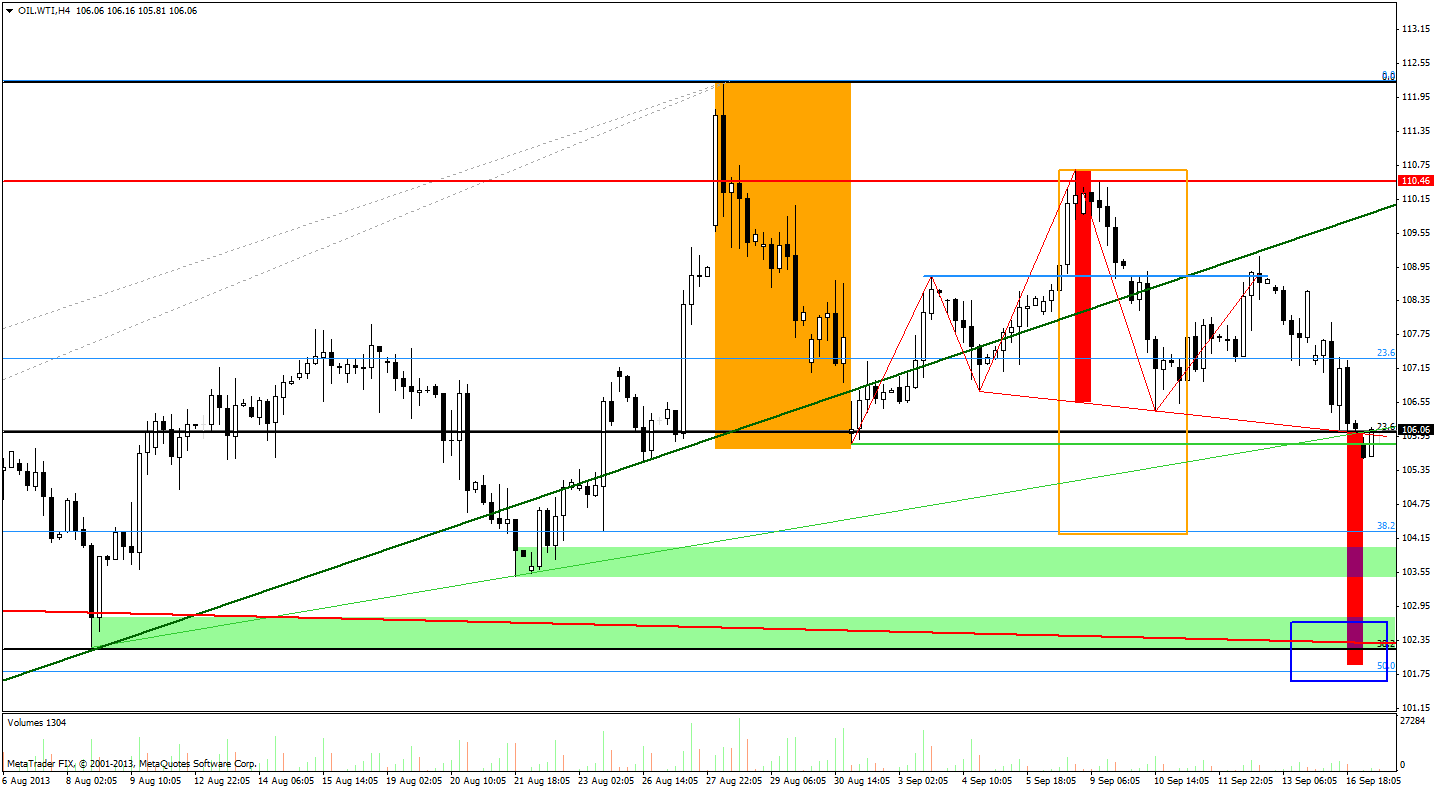
On the above chart we see that the price of light crude dropped below the rising support line based on the August lows. However, the breakdown is not confirmed so far. Additionally, crude oil declined also below the neck level of the bearish head-and-shoulders pattern (marked with red). Oil bulls are trying to come back above this level at the moment, but if they fail the price target for the formation will be around $102 per barrel (the blue rectangle).
As you see on the above chart, there is a strong support zone in this area. The 32.8% Fibonacci retracement level based on the entire April-August rally intersects with the upper line of the large triangle based on the May 2011 and March 2012 tops and the August low. Slightly below there is also the 50% Fibonacci retracement level based on the June low and August high.
To summarize: Although crude oil declined in the previous days, the entire August-September decline is still similar to the previous ones: from the July 19 top to the August 8 low and from the June 19 top to the June 24 low. From this perspective the uptrend is not threatened.
Long-term outlook: the picture is bullish and the breakout above two long-term declining resistance lines hasn’t been invalidated.
Medium-term outlook: the situation is somewhat mixed, but with a bullish bias. On the one hand, crude oil still remains slightly below the May 2011 top, which is a bullish factor. On the other hand, there was a third unsuccessful attempt to break above this level, which resulted in a decline to the consolidation range, and such price action doesn’t look so bullish.
Short-term outlook: still bullish. All corrective moves since June are similar, that’s why the uptrend is not threatened at the moment.
Very short-term outlook: bearish
Trading position (short-term): if the head and shoulders pattern is confirmed we suggest opening speculative short positions. The price target for the formation is around $102 per barrel.
We'll keep you informed if that happens and opening positions is a good idea in our view.
Thank you,
Nadia Simmons

