

Trading position (short-term; our opinion): Short positions (with a stop-loss order at $56.45 and an initial downside target at $45.81) are justified from the risk/reward perspective.
Although crude oil climbed above $54 after investors had over-reacted to Friday’s Baker Hughes’ report, this improvement was temporary and the black gold came back below the last week high. Will we see further deterioration in the following days?
Let’s examine the charts below to find out (charts courtesy of http://stockcharts.com).
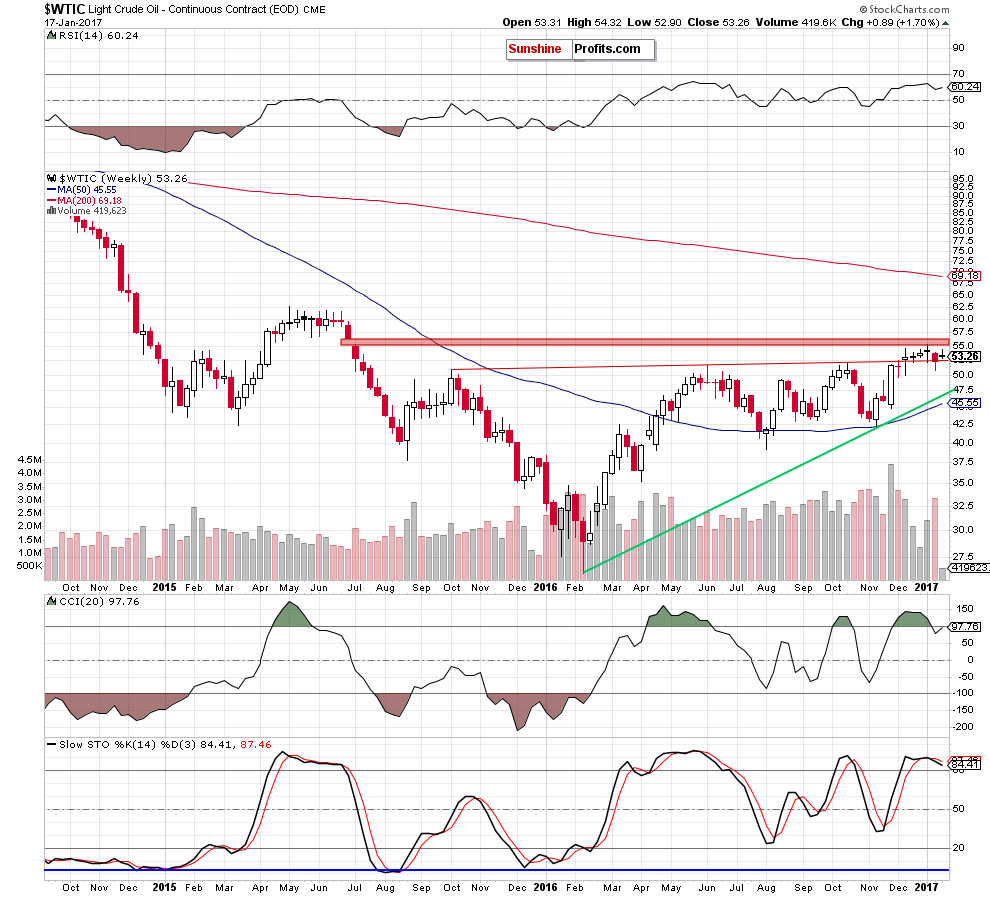
Looking at the weekly chart, we see that although crude oil moved higher yesterday, the red gap continues to keep gains in check. Additionally, the sell signals generated by the indicators are still in play, supporting oil bears and another attempt to move lower.
Are there any other technical factors that could encourage oil bears to act? Let’s take a closer look at the daily chart and find out.
Yesterday, we wrote the following:
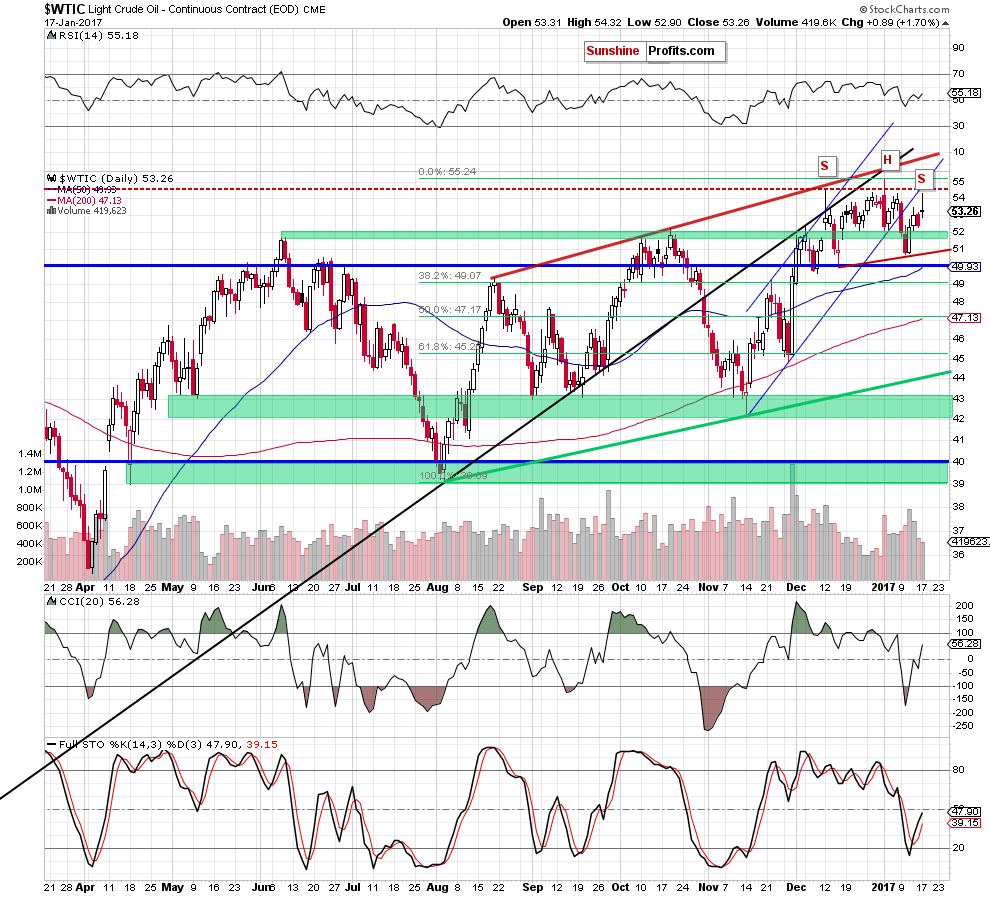
(…) Although light crude moved higher after the market’s open, there was no comeback to the December 2015 or January 2016 highs, which means that the commodity is still trading under the previously-broken lower border of the blue rising trend channel and there are no bullish implications of this move.
From today’s point of view, we see that yesterday’s increase took crude oil to the Jan 6 high of $54.32. Despite this improvement, oil bulls didn’t manage to hold gained levels, which resulted in a reversal. Thanks to this action light crude not only hit a double top, but also declined below the last week high, which doesn’t bode well for the commodity.
On top of that, when we take a closer look at the daily chart, we can notice a potential head and shoulders formation. If this is the case, yesterday’s move to the upside created the right shoulder of the pattern, suggesting lower prices of the black gold in the coming days.
How low could crude oil go in the near future? In our opinion, the initial downside target will be the neck line of the head and shoulders formation (around $50.89 at the moment of writing these words). If it is broken, we’ll see an acceleration of declines and a drop even to around $46.36, where the size of the downward move will correspond to the height of the mentioned formation.
Summing up, although crude oil moved higher yesterday, short positions continue to be justified, because light crude hit a double top and created the right shoulder of the potential head and shoulders formation, which suggests another attempt to move lower in the coming days.
Very short-term outlook: bearish
Short-term outlook: mixed with bearish bias
MT outlook: mixed
LT outlook: mixed
Trading position (short-term; our opinion): Short positions (with a stop-loss order at $56.45 and an initial downside target at $45.81) are justified from the risk/reward perspective. We will keep you informed should anything change, or should we see a confirmation/invalidation of the above.
As a reminder – “initial target price” means exactly that – an “initial” one, it’s not a price level at which we suggest closing positions. If this becomes the case (like it did in the previous trade) we will refer to these levels as levels of exit orders (exactly as we’ve done previously). Stop-loss levels, however, are naturally not “initial”, but something that, in our opinion, might be entered as an order.
Thank you.
Nadia Simmons
Forex & Oil Trading Strategist
Przemyslaw Radomski, CFA
Founder, Editor-in-chief
Gold & Silver Trading Alerts
Forex Trading Alerts
Oil Investment Updates
Oil Trading Alerts

