

Trading position (short-term; our opinion): Short positions (with a stop-loss order at $54.21 and initial downside target at $43.37) are justified from the risk/reward perspective.
On Tuesday, crude oil declined sharply after the Genscape, Inc. report, which showed an unexpected build of 230,026 barrels at Cushing Oil Hub in Oklahoma. Thanks to this bearish news, light crude lost 4.91% and closed the day under the 50-day moving average. Is it enough to trigger further deterioration in the coming days?
Let’s examine the charts below and find out (charts courtesy of http://stockcharts.com).
Quoting our yesterday's commentary:
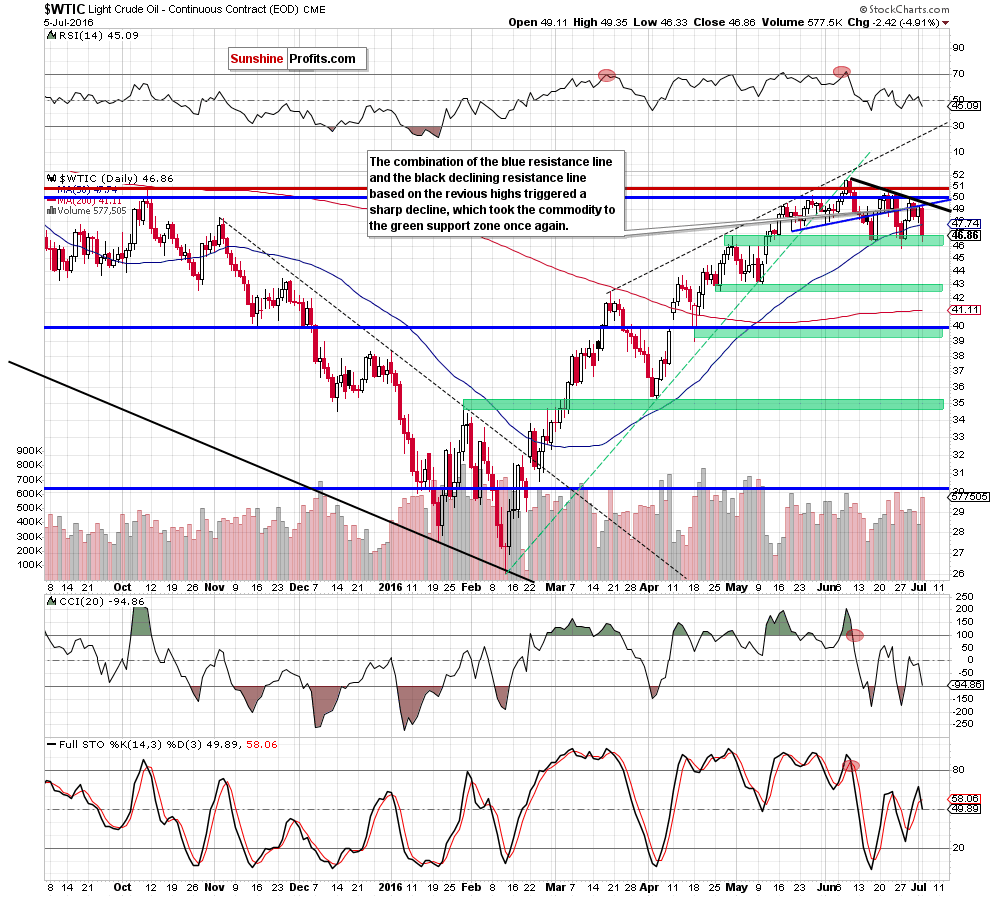
(…) crude oil approached the 50-day moving average on Friday. (…) the proximity to this support encouraged oil bulls to act, which resulted in another rebound and a comeback to the previously-broken blue line. What’s next? Taking into account the proximity to the barrier of $50 and the fact that Friday’s move materialized on smaller volume (compared to what we saw in previous days), we think that another downswing is just around the corner. If this is the case and light crude declines from here, we’ll see another re-test of the 50-day moving average or even a test of the green support zone and recent lows in the coming day(s).
Looking at the daily chart, we see that the situation developed in line with yesterday’s scenario and crude oil declined sharply, reaching our downside targets. With this downswing, the commodity dropped under the 50-day moving average and closed the day below it, which is a negative signal. Additionally, the Stochastic Oscillator generated a sell signal, supporting lower values of light crude. On top of that, Tuesday’s decline materialized on sizable volume, which confirms oil bears strength and suggests that further deterioration is just around the corner. If this is the case, and crude oil extends declines from here, we’ll see a test of the Jun 27 low of $45.83. If this support is broken, the next downside target would be around $43.03, where the May 10 low is.
What impact did this drop have on the weekly chart? Let’s check.
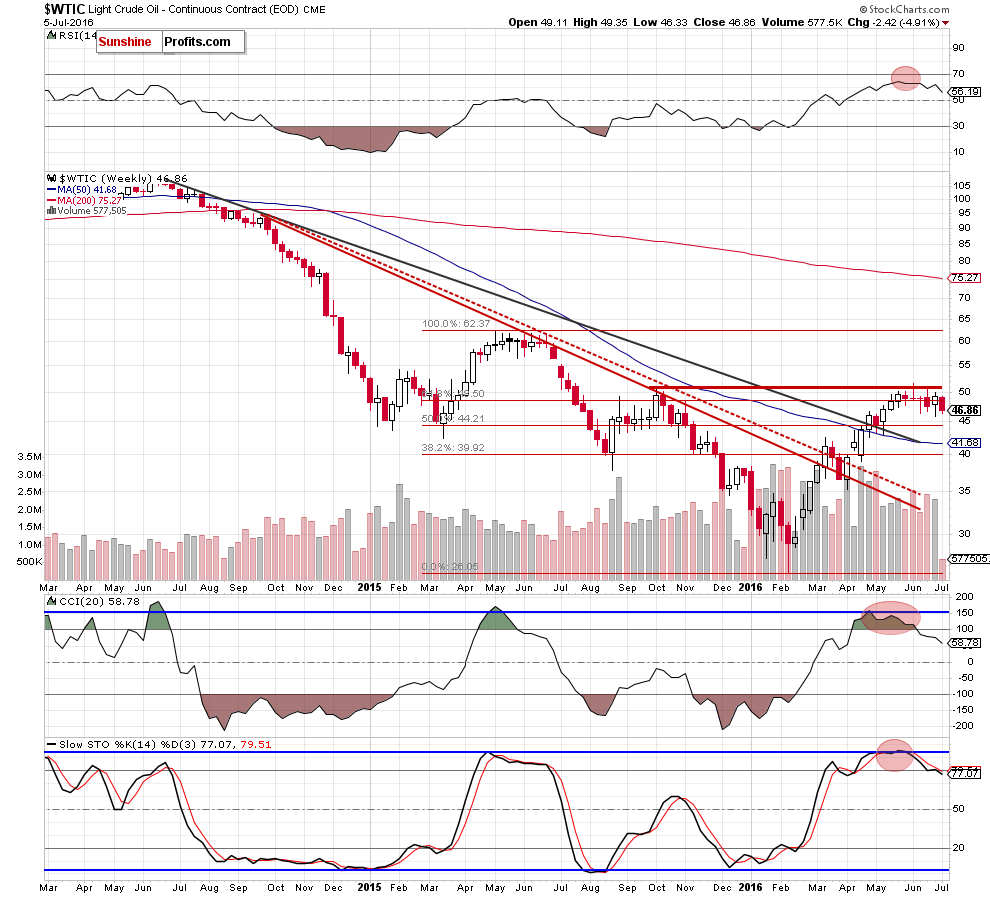
From this perspective, we see that invalidation of the breakout above the 61.8% Fibonacci retracement and its negative impact on the commodity is still in effect. Additionally, sell signals generated by the indicators continue to support oil bears and further deterioration in the coming week(s).
Are there any other technical factors that could encourage oil bears to act? Let’s take a closer look at the oil-to-oil stocks ratio.
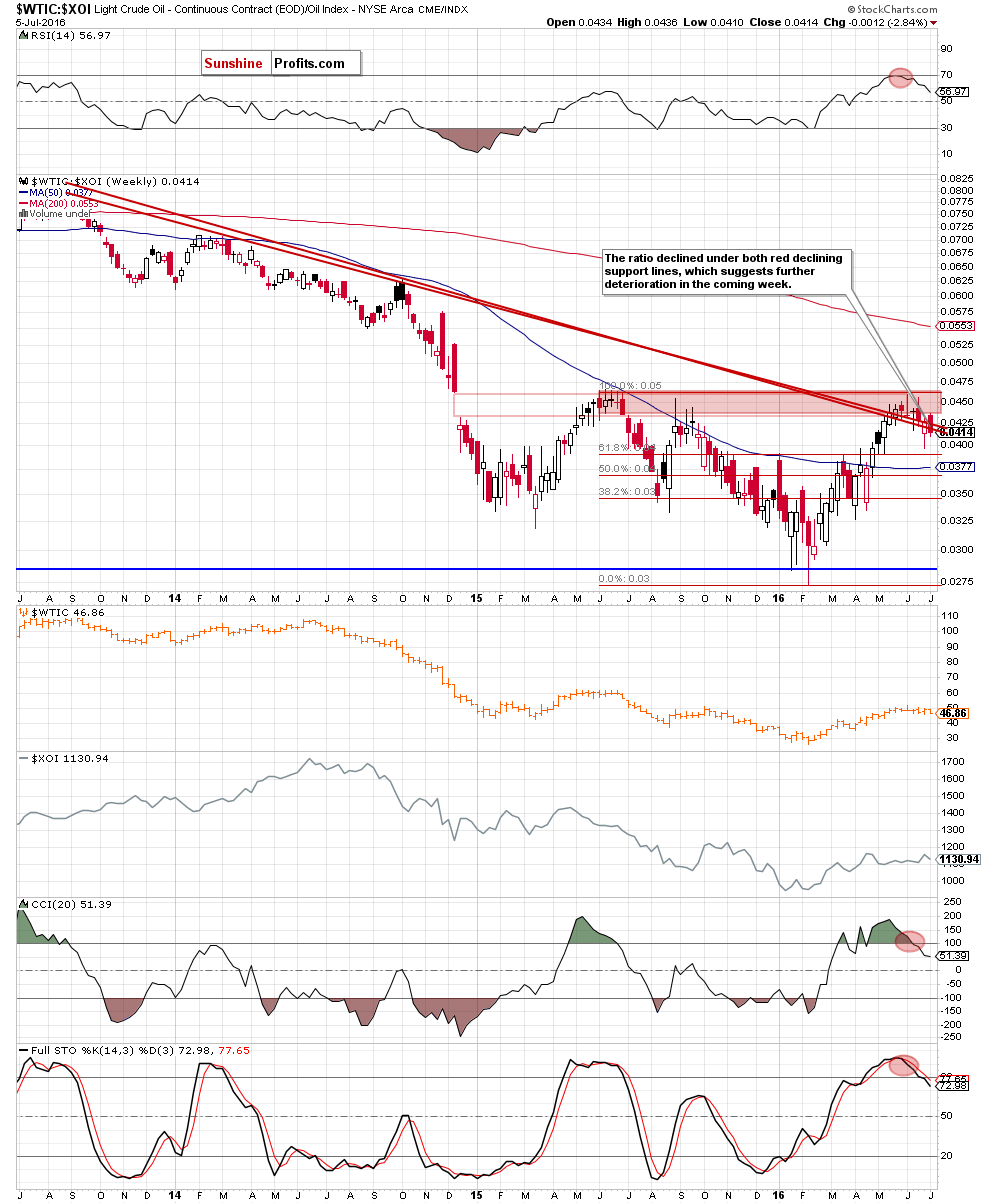
The first thing that catches the eye on the above chart is breakdown under both red declining support lines, which is a negative signal, which suggests further deterioration in the coming week(s) – especially when we factor in sell signals generated by the CCI and the Stochastic Oscillator. What does it mean for light crude? As you see on the above chart, there is strong positive correlation between the ratio and crude oil, which means that lower values of the ratio will translate into lower prices of the commodity – similarly to what we saw in any cases in the past.
Nevertheless, to have a more complete picture of the oil market we decided to examine the oil-gold ratio.
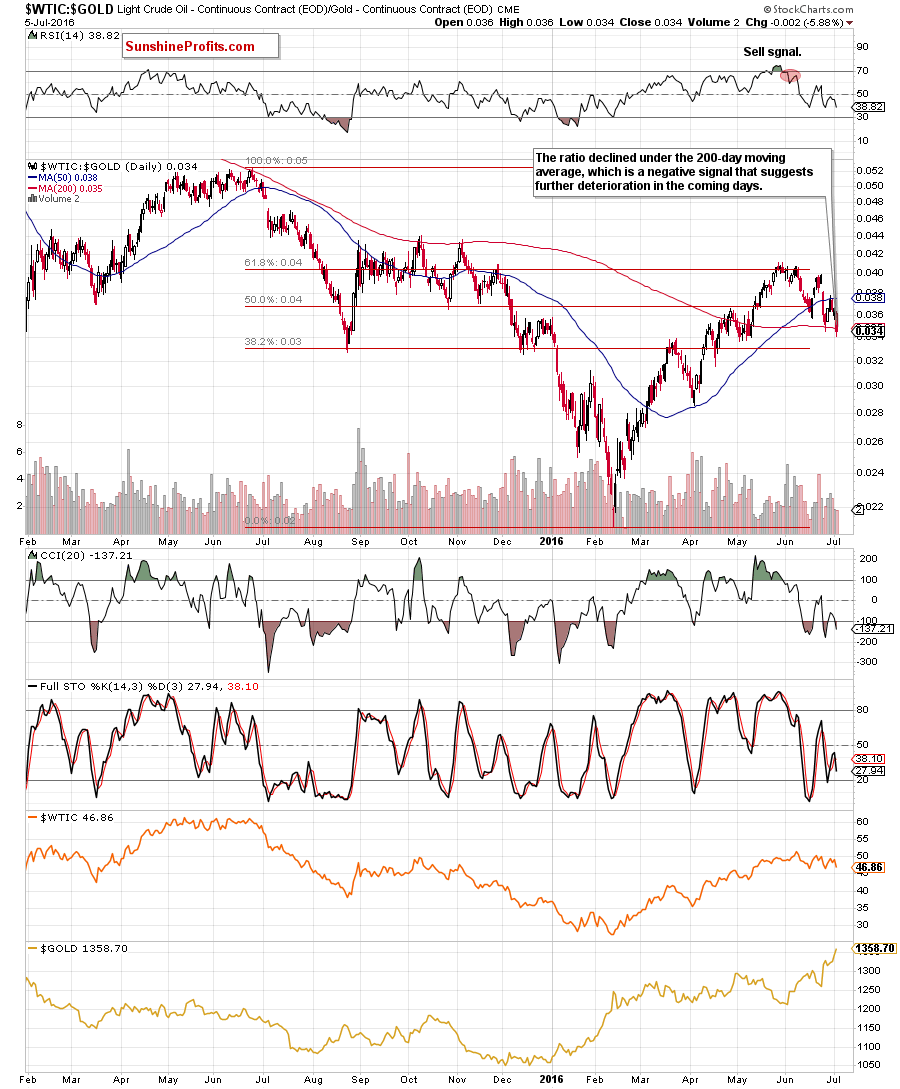
On the daily chart, we see that the ratio extended losses in recent days, which resulted in a drop under the 200-day moving average and closed the day below it, which is a bearish signal. Additionally, the Stochastic Oscillator generated a sell signal once again, supporting further deterioration in the coming days.
What impact did this move have on the weekly chart? Let’s check.
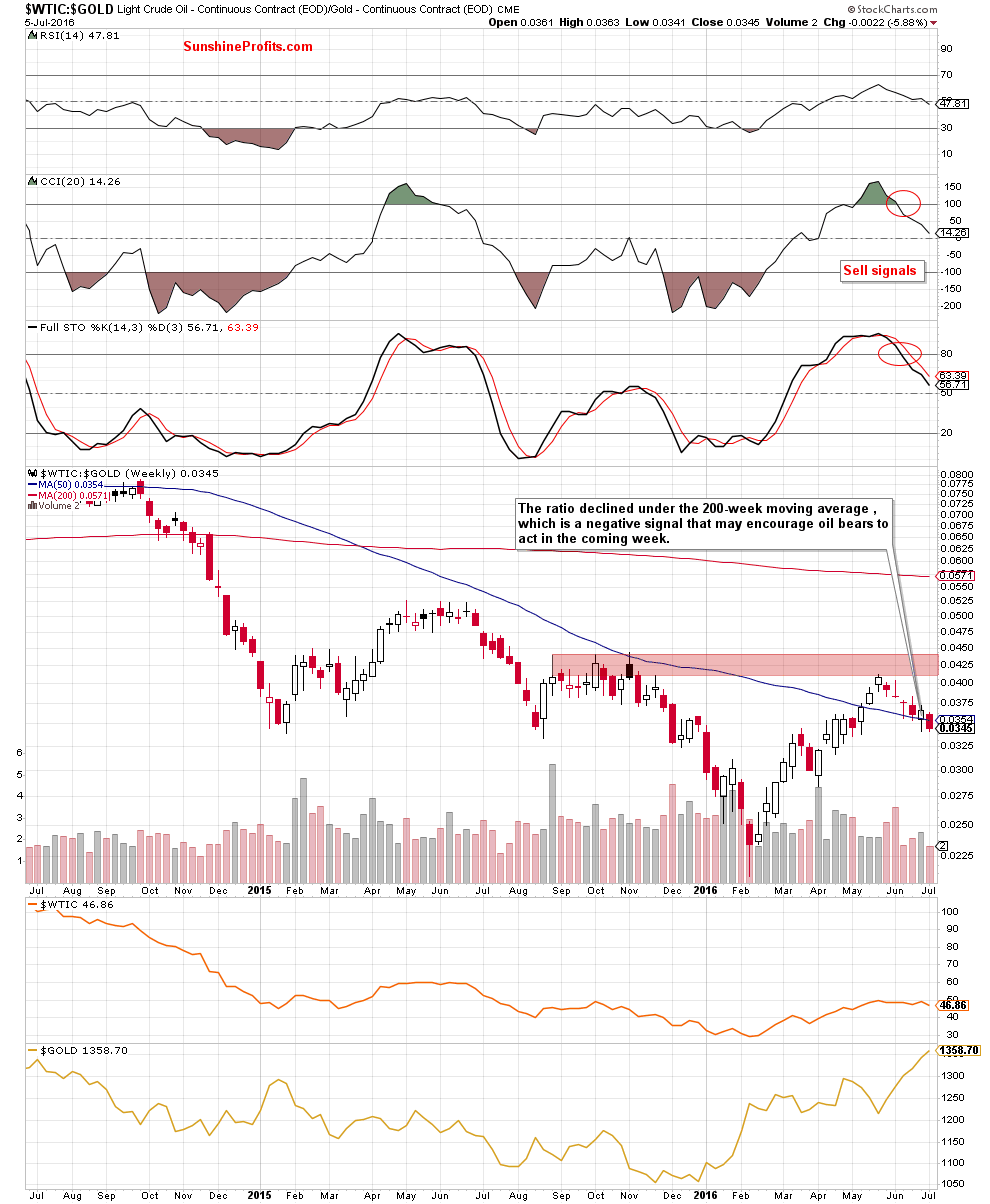
From this perspective, we see that the ratio declined under the 50-week moving average, which in combination with sell signals generated by the CCI and Stochastic Oscillator is additional pro bearish factor that suggests further deterioration in the ratio. What impact such price action could have on crude oil? Similarly to what we wrote in the case of the oil-to-oil stocks ratio, there is a strong positive correlation between the above ratio and the price of crude oil. Therefore, another downswing in the ratio will correspond to another drop in the commodity.
Before we summarize today’s alert we would also like to draw your attention to the long-term chart of the above ratio.
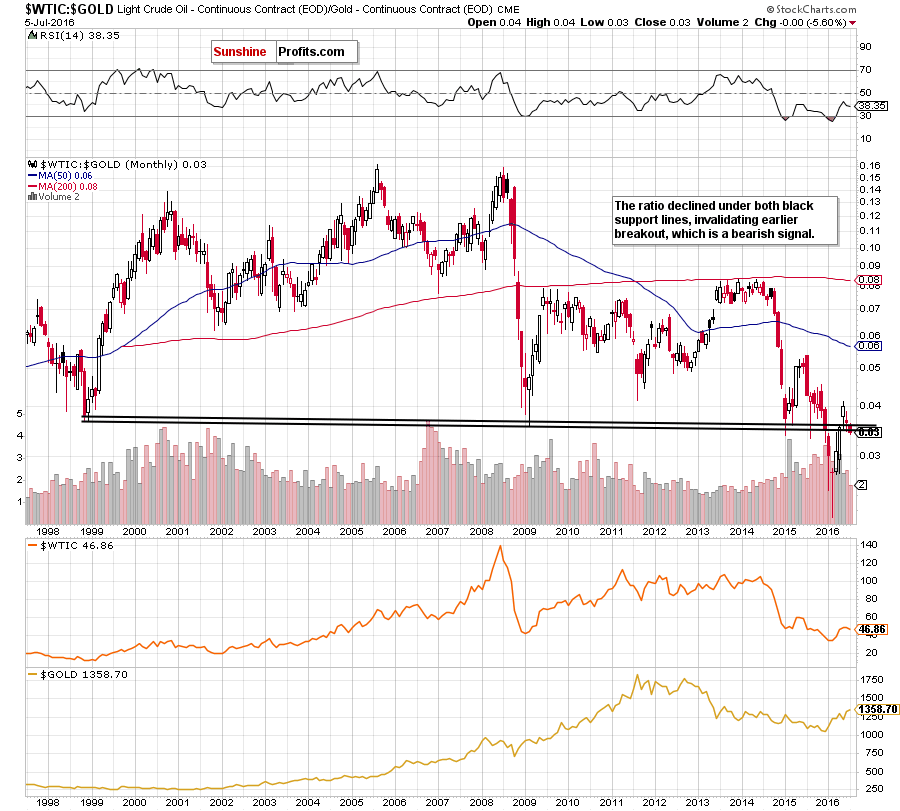
From this perspective, we see that the ratio declined under both black support lines, invalidating earlier breakout, which is another negative signal that suggests further declines (in the ratio and in crude oil) in the coming days/weeks.
Summing up, the combination of the short-term blue resistance line and the black resistance line based on the previous highs triggered a sharp decline, which took crude oil under the 50-day moving average once again. Taking this fact into account and combining it with three unsuccessful attempts to break above the barrier of $50, sell signals generated by the indicators (not only in case of crude oil, but also in the case of all ratios) and the size of volume that accompanied yesterday’s decline, we believe that further deterioration is just around the corner and opening short positions is justified from the risk/reward perspective.
Very short-term outlook: berish
Short-term outlook: bearish
MT outlook: bearish
LT outlook: mixed with bearish bias
Trading position (short-term; our opinion): Short positions (with a stop-loss order at $54.21 and initial downside target at $43.37) are justified from the risk/reward perspective. We will keep you informed should anything change, or should we see a confirmation/invalidation of the above.
As a reminder – “initial target price” means exactly that – an “initial” one, it’s not a price level at which we suggest closing positions. If this becomes the case (like it did in the previous trade) we will refer to these levels as levels of exit orders (exactly as we’ve done previously). Stop-loss levels, however, are naturally not “initial”, but something that, in our opinion, might be entered as an order.
Thank you.
Nadia Simmons
Forex & Oil Trading Strategist
Przemyslaw Radomski, CFA
Founder, Editor-in-chief
Gold & Silver Trading Alerts
Forex Trading Alerts
Oil Investment Updates
Oil Trading Alerts

