

Trading position (short-term; our opinion): Short positions (with a stop-loss order at $48.56 and initial downside target at $35.24) are justified from the risk/reward perspective.
Although Baker Hughes’ report showed another drop in the U.S. oil rig, uncertainty around weekend’s meeting between major oil producers in Doha weighed on investors’ sentiment and pushed the price of crude oil lower. Thanks to these circumstances, light crude closed Friday’s session under the Feb high and the upper border of the medium-term consolidation. What does it mean for the commodity?
On Friday, Baker Hughes' report showed that the U.S. oil rig count continues its downward trend, cutting another 3 rigs to 351. Despite this positive news, uncertainty around weekend’s meeting between major oil producers in Doha weighed on investors’ sentiment and pushed the price of crude oil lower. As a result, light crude closed Friday’s session under the Feb high and the upper border of the medium-term consolidation. What does it mean for the commodity? Let’s examine charts and try to answer this question (charts courtesy of http://stockcharts.com).
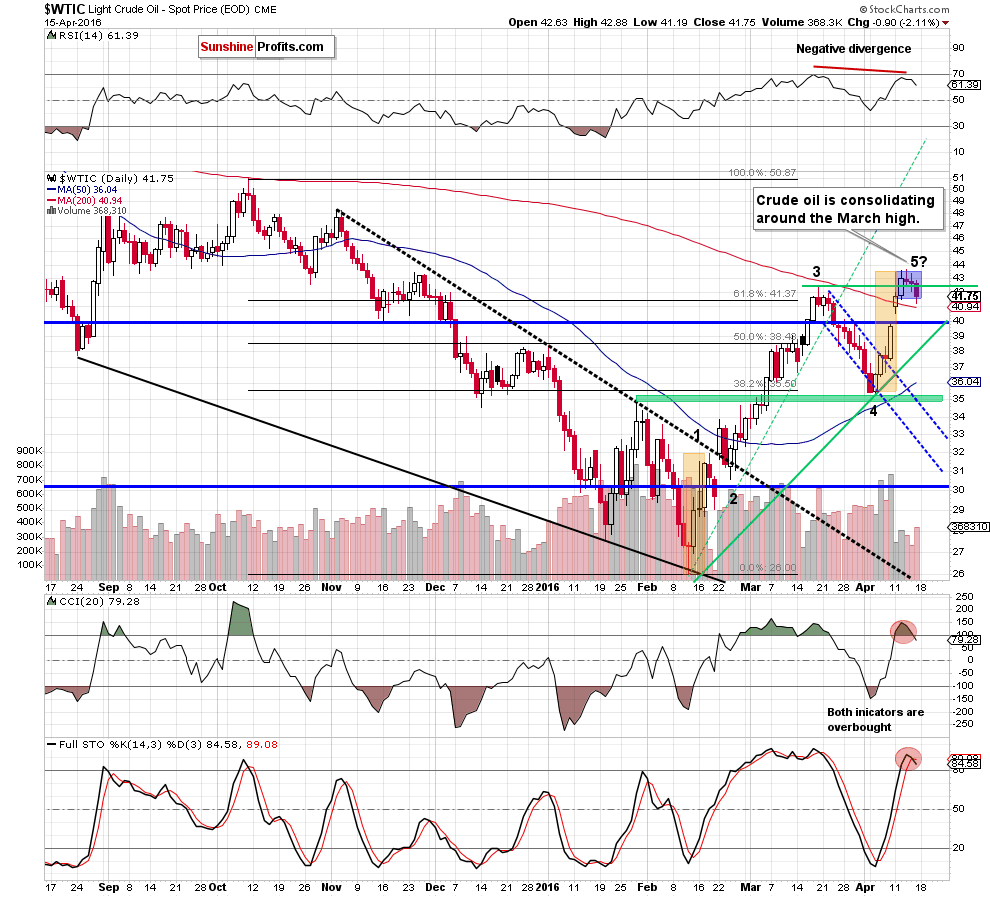
Based only on Friday's price action, we see that although crude oil moved little lower, slipping under the Apr 12 low, the commodity reversed and came back to the blue consolidation. Nevertheless, despite this rebound, light crude closed the session under the March high, which means that what we wrote in our previous Oil Trading Alert is up-to-date:
(…) the commodity remains in the blue consolidation around the March high. Nevertheless, when we take a look at the current position of the indicators, we clearly see that there is negative divergence between the RSI and light crude, which is a negative signal. Additionally, the CCI and Stochastic Oscillator are overbought - similarly to what we saw in mid-March. Back then, similar readings preceded correction of earlier rally, which suggests that we may see another attempt to move lower on the coming week. However, in our opinion, such price action will be more reliable if we see daily closure under the March high
(…) Before we zoom out our picture and examine the weekly chart, we would like to draw your attention to the recent rally from a slightly different perspective - the perspective of Elliott Wave Theory. We realize that this theory has as many supporters as opponents, but the current layout of the waves seems too interesting to not to comment it.
On the daily chart, we marked all five potential waves. The upward move from Feb 11 to Feb 18 (marked with orange) seems to be the first wave. After interesting correction, crude oil moved sharply higher, which fits to the specifics of the third wave. In mid-March, the commodity corrected almost 50% of earlier rally, which looks like the fourth wave, which preceded the last upward move between Apr 5 and Apr 13. As you see, the first and the potential fifth wave are quite similar – not only in size but also in terms of time, which increases the probability of reversal in the coming week.
Are there any other technical factors that could support this scenario? As we mentioned earlier, let’s examine the medium-term chart and find out.
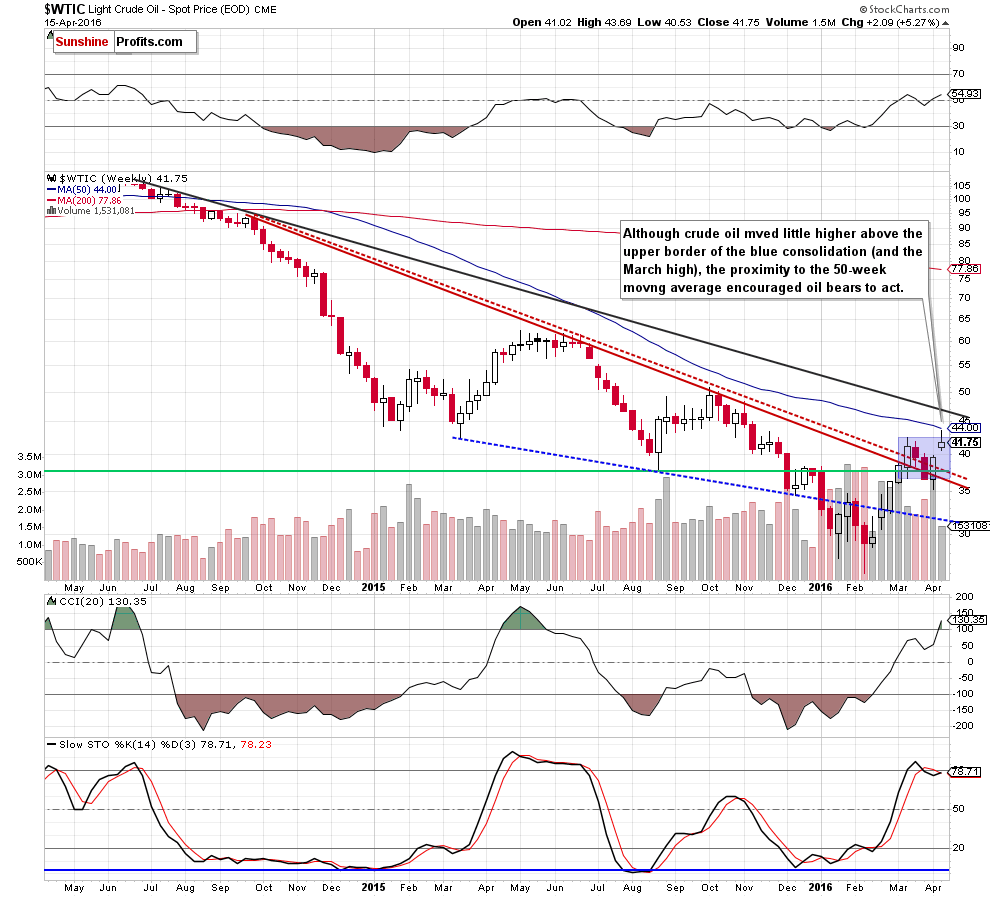
In Friday’s summary, we wrote the following:
(...) the commodity moved lower earlier today (after the market’s open), which resulted in a drop under the March high. If light crude closes today’s session under this level, we’ll receive an invalidation of earlier small breakout (not only above the March high, but also upper border of the blue consolidation marked on the weekly chart), which would be a strong negative signal that would suggest further deterioration in the coming week - especially when we factor in the current position of daily and weekly indicators (and a potential five-wave upward move).
From this perspective, we see that the situation developed in line with the above scenario, which suggests that the pro-bearish scenario would be in cards in the coming week.
Nevertheless, to have a more complete picture of the commodity, we also examined the oil-to-silver ratio and gold-to-oil ratios.
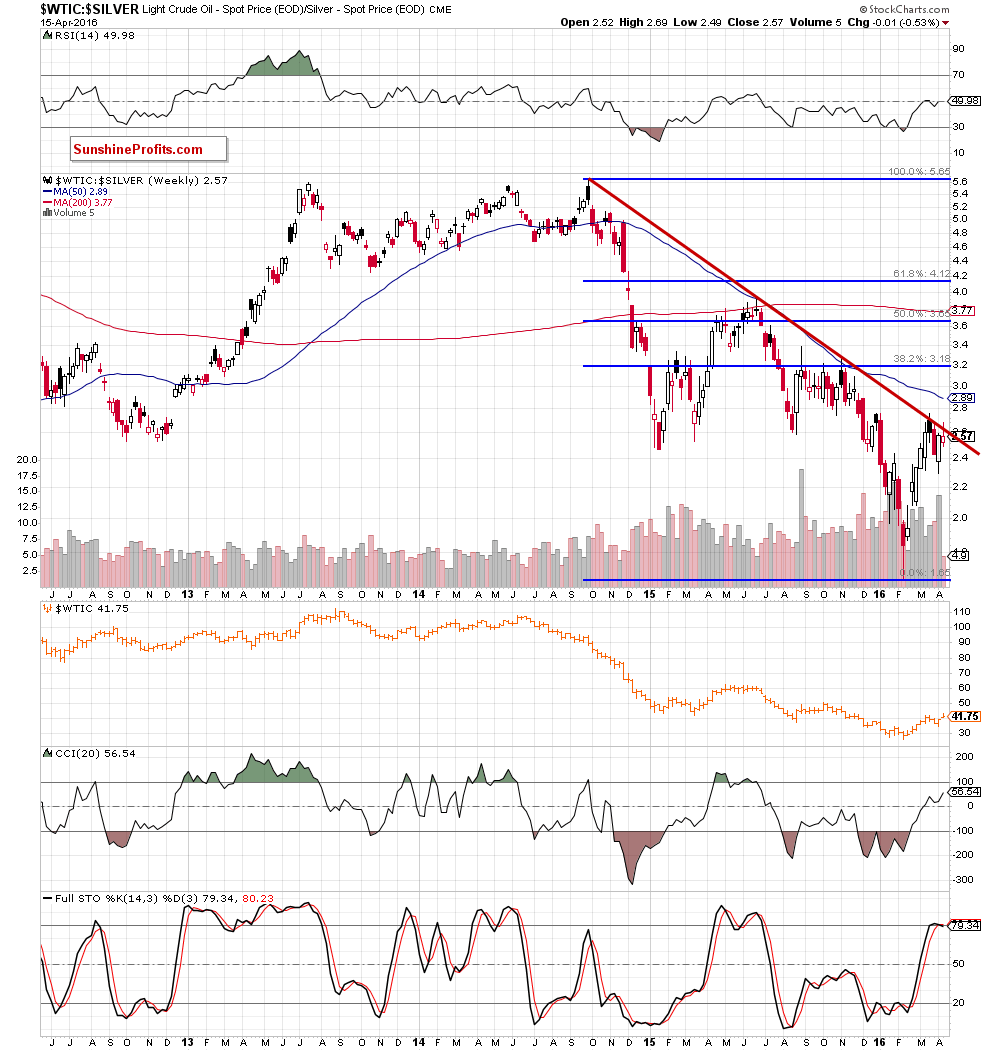
On the above chart, we clearly see that although the ratio moved slightly above the long-term red declining line, this improvement was only temporary and the ratio reversed, closing the week under this key resistance – similarly to what we saw several times in the past. Taking this fact into account, we believe that our Friday’s commentary is valid also today:
(…) In all cases, oil bulls were not strong enough to push the ratio higher, which resulted in reversal and declines – not only in the ratio, but also in crude oil. Therefore, looking at the above chart, we think that anther reversal is just around the corner. Additionally, the Stochastic Oscillator is very close to generating a sell signal, which is another negative signal.
Having said the above, let’s take a closer look at the gold-to-oil ratio.
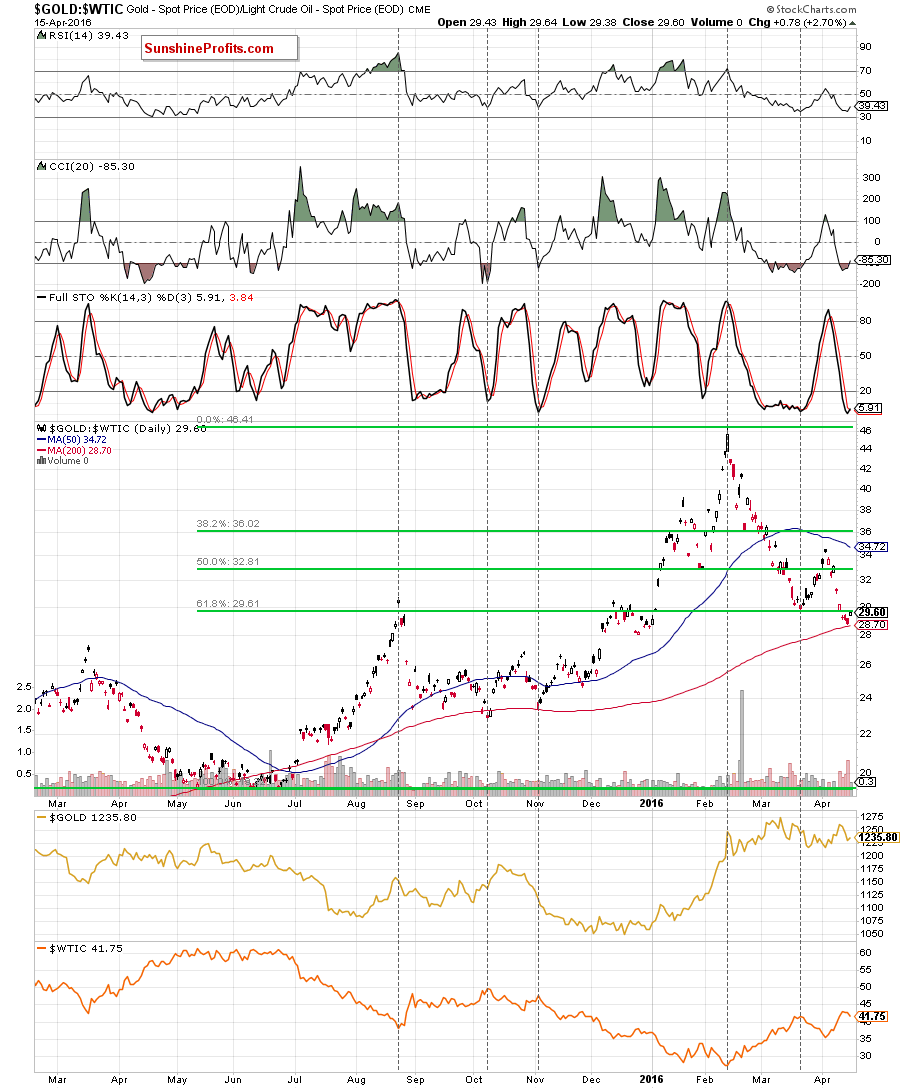
On the daily chart, we see that the 200day moving average encouraged oil bulls to act, which suggests, that our last commentary is up-to-date also today:
The first thing that catches the eye on the above chart is strong negative correlation between the ratio and the price of crude oil. As you see, the ratio declined to the 200-day moving average, which in combination with the current position if the CCI and Stochastic Oscillator suggests that another reversal in the coming day(s) is very likely. Why? When we examined the above chart, we noticed similar situation in Oct and Nov 2015. Back then, such combination encouraged bears to act, which translated into higher values of the ratio and declines in crude oil. Therefore, if the history repeats itself once again, we’ll likely see another downward move in light crude.
Once we know the current situation in above ratios, let’s comment the USD/CAD chart, quoting our Friday’s alert:
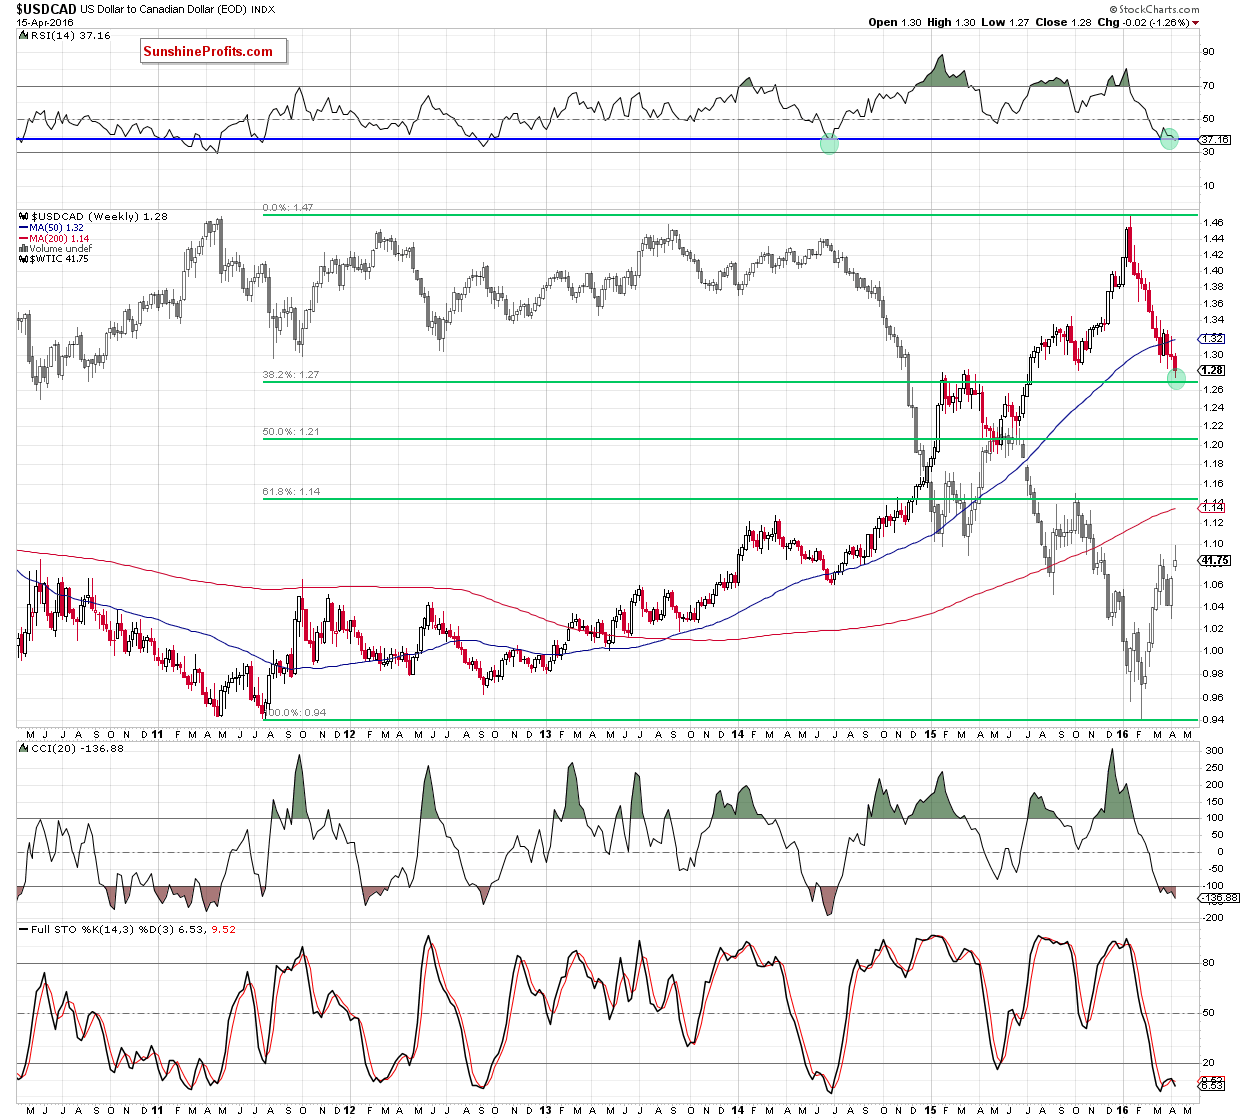
(…) USD/CAD dropped to the green support zone created by the Jan and March 2015 highs (in this area is also the 70.7% Fibonacci retracement based on May-Jan rally). Taking this fact into account, we think that reversal is just around the corner – even if the exchange rate moves lower once again and test the strength of the 38.2% Fibonacci retracement based on the entire Jul 2011-Jan 2016 upward move (around 1.2666) in the coming week. What does it mean for crude oil? As you see on the above chart, in recent months, there was strong negative correlation between USD/CAD and the price of the commodity, which suggests that reversal in this currency pair will likely correspond to reversal in crude oil.
Finishing today’s alert, we would also like to comment the Doha meeting. Although the world's largest oil-producing countries met this weekend, they failed to reach a deal to freeze output at Jan levels as Saudi deputy crown prince Mohammed bin Salman said once again that Saudi Arabia would only freeze the level of its oil production if all other major producers, including Iran, did the same. Although Iran had said it support the freeze, the country didn’t agree to cut production until it raises its output to around 4 million barrels per day (to the pre-sanctions levels). What does it mean for crude oil? In our opinion, such developments suggest a renewed battle for crude market share, which would likely translate into lower values of the commodity in the coming days or even weeks. At this point, it is also worth noting that crude oil futures moved sharply lower in a pre-market trading, which suggests that we’ll also see lower values of the commodity later in the day.
Summing up, although crude oil came back to the blue consolidation (marked on the daily chart), the commodity closed Friday’s session and the previous week under the March high (and the upper border of the medium-term consolidation), invalidating earlier small breakout. In our opinion, this bearish signal in combination with sell signals generated by the daily indicators and the lack of agreement on freezing deal suggests further deterioration and (at least) a test of the Apr low of $35.24 in the coming week.
Very short-term outlook: bearish
Short-term outlook: bearish
MT outlook: mixed with bearish bias
LT outlook: mixed with bearish bias
Trading position (short-term; our opinion): Short positions (with a stop-loss order at $48.56 and initial downside target at $35.24) are justified from the risk/reward perspective. We will keep you informed should anything change, or should we see a confirmation/invalidation of the above.
As a reminder – “initial target price” means exactly that – an “initial” one, it’s not a price level at which we suggest closing positions. If this becomes the case (like it did in the previous trade) we will refer to these levels as levels of exit orders (exactly as we’ve done previously). Stop-loss levels, however, are naturally not “initial”, but something that, in our opinion, might be entered as an order.
Since it is impossible to synchronize target prices and stop-loss levels for all the ETFs and ETNs with the main market that we provide this level for (crude oil), the stop-loss level and target price for popular ETN and ETF (among other: USO, DWTI, UWTI) are provided as supplementary, and not as “final”. This means that if a stop-loss or a target level is reached for any of the “additional instruments” (DWTI for instance), but not for the “main instrument” (crude oil in this case), we will view positions in both crude oil and DWTI as still open and the stop-loss for DWTI would have to be moved lower. On the other hand, if crude oil moves to a stop-loss level but DWTI doesn’t, then we will view both positions (in crude oil and DWTI) as closed. In other words, since it’s not possible to be 100% certain that each related instrument moves to a given level when the underlying instrument does, we can’t provide levels that would be binding. The levels that we do provide are our best estimate of the levels that will correspond to the levels in the underlying assets, but it will be the underlying assets that one will need to focus on regarding the sings pointing to closing a given position or keeping it open. We might adjust the levels in the “additional instruments” without adjusting the levels in the “main instruments”, which will simply mean that we have improved our estimation of these levels, not that we changed our outlook on the markets.
Thank you.
Nadia Simmons
Forex & Oil Trading Strategist
Przemyslaw Radomski, CFA
Founder, Editor-in-chief
Gold & Silver Trading Alerts
Forex Trading Alerts
Oil Investment Updates
Oil Trading Alerts

