

Trading position (short-term; our opinion): Short positions with a stop-loss order at $54.12 and initial (!) target price at $35.72 are justified from the risk/reward perspective.
Although crude oil moved higher after the market’s open supported by Wednesday’s bullish EIA report, the commodity reversed and declined in the following hours despite a sharp drop in the USD Index. What can we infer from this show of weakness?
Yesterday, after the market’s open, light crude extended Wednesday’s gains and climbed to an intraday high of $47.71 as bullish EIA report on crude oil inventories continued to weigh. Despite this improvement, the commodity reversed and declined in the following hours ahead of Fed decision. As it turned out, the Federal Reserve left its benchmark interest rate unchanged between zero and 0.25%, which pushed the USD sharply lower. Thanks to these circumstances, the greenback slipped to its lowest level since the beginning of the month, hitting an intraday low of 94.48. As is well known, dollar-denominated commodities such as crude become more attractive for foreign investors when the U.S. dollar declines. Meanwhile, despite yesterday’s sharp decline, we didn’t notice a sizable upward move in crude oil (in contrast to gold, which climbed to almost two-week high). This important show of weakness suggests that if the greenback finds ground and rebounds, we’ll see an acceleration of declines in light crude. Taking this fact into account, we decided start today’s alert looking closer at the current situation in the USD Index (charts courtesy of http://stockcharts.com).
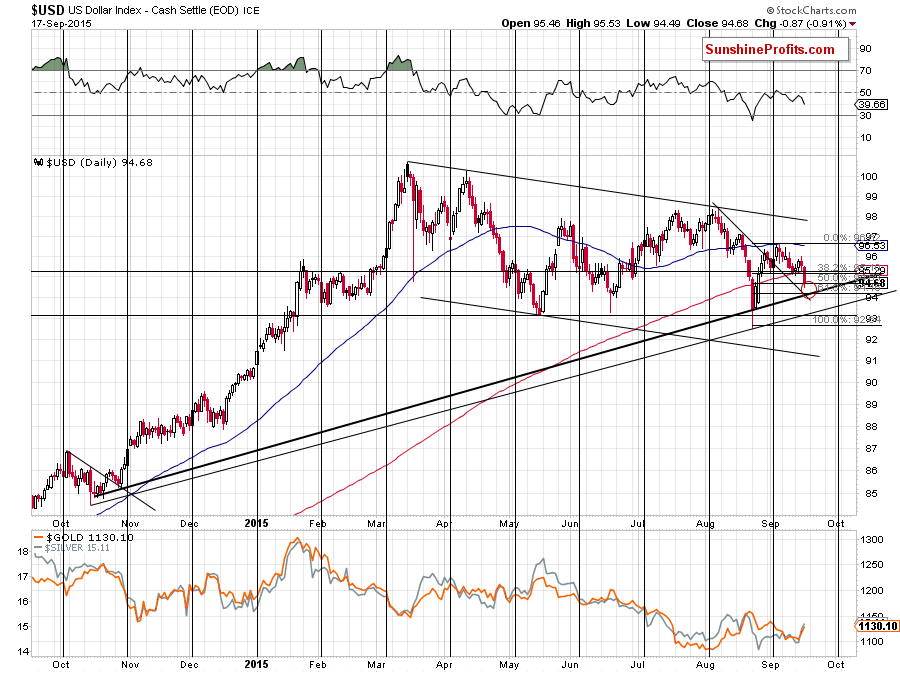
As you see on the daily chart, the greenback slipped to the 50% Fibonacci retracement, but earlier today the index moved lower and approached a solid support zone (slightly above 94) created by the declining support line, the 61.8% Fibonacci retracement and the medium-term rising support line based on the daily closing prices. If this area doesn’t stop the current decline, then it’s highly likely that the May low would. Therefore, we think that lower values of USD would only be temporary and reversal is just around the corner. If we see such action, it would a bearish sign for crude oil and we’ll see lower values of the commodity.
Having said that, let’s check what impact yesterday’s sharp decline had on the technical picture of the commodity.
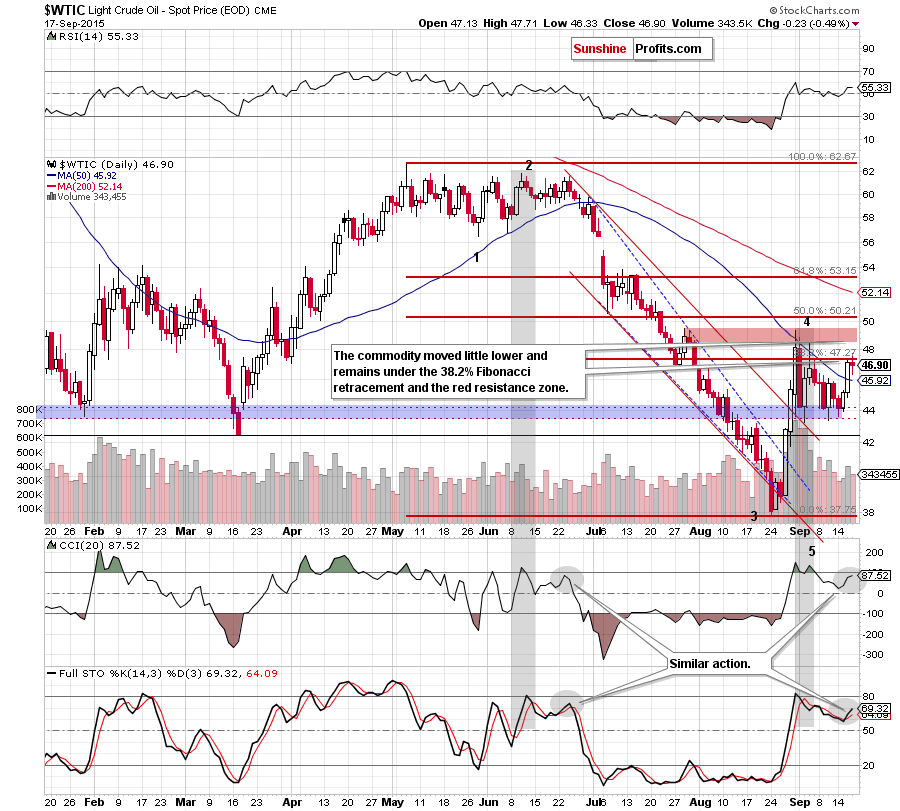
As we mentioned earlier, although USD Index declined yesterday, crude oil refused to go higher and slipped under the 38.2% Fibonacci retracement, invalidating earlier small breakout. This is a negative signal, which suggests further deterioration in the coming days.
Therefore, we believe that our previous commentary is up-to-date:
(…) the 38.2% Fibonacci retracement (…) serves as solid resistance. Why? As you see, although there were several attempts to move higher, they all failed and we didn’t see a breakout (not to mention the daily closure) above this resistance level since Aug 31.
(…) On top of that, we can notice similar action in the behavior of daily indicators at the beginning of declines in June and now. As you see on the above chart, after the CCI and Stochastic Oscillator generated sell signals in June, there was a small increase in the values of indicators, which corresponded to an upward move in crude oil. Despite those moves, both indicators reversed and declined sharply, which encouraged oil bears to act and triggered a sizable downward move in the following weeks.
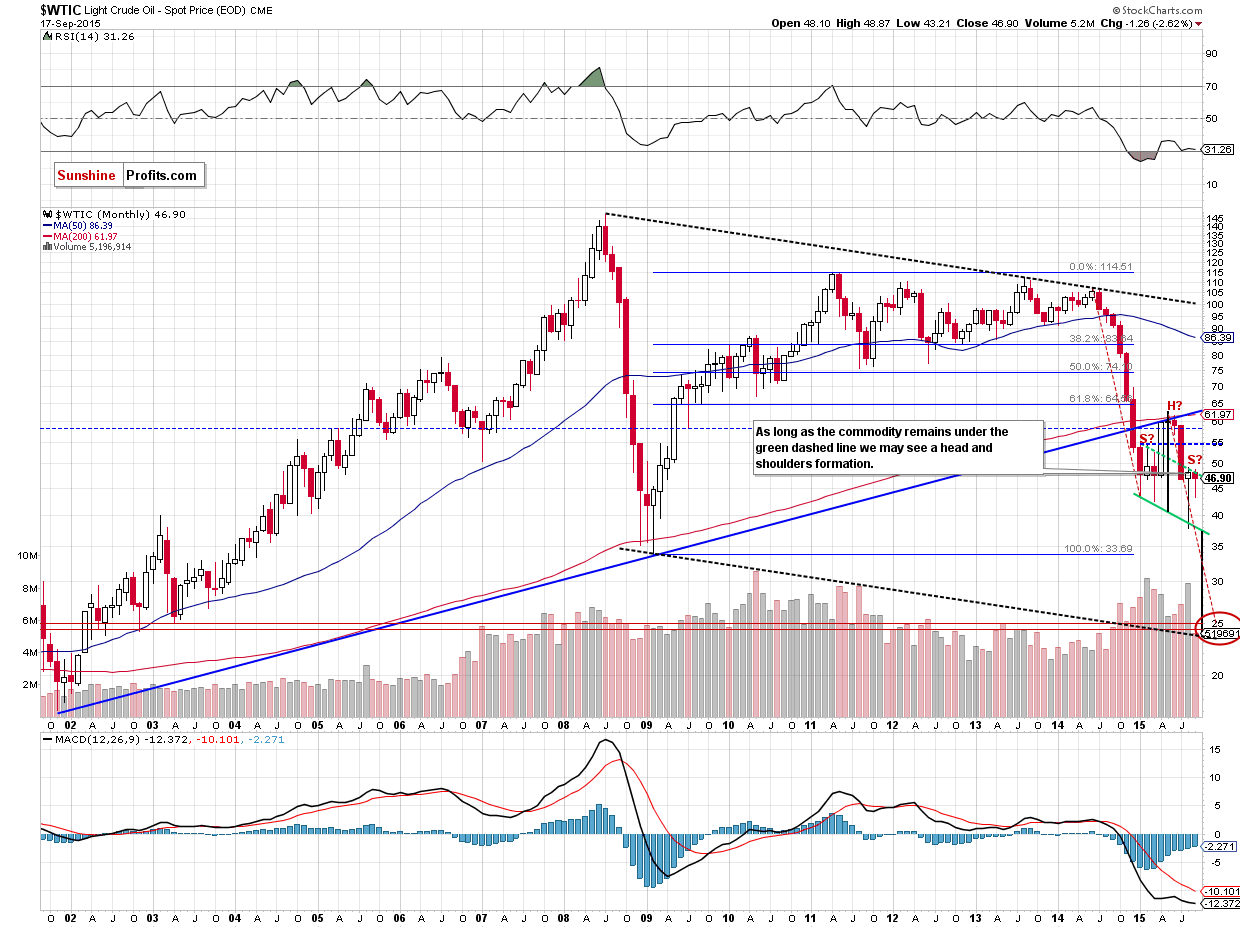
All the above shows that although crude oil extended gains and broke above the 50-day moving average, the overall situation hasn’t changed much. In our opinion, the best proof of this assumption will be (…) the long-term (…) perspective
(…) although crude oil moved higher in recent days, the commodity remains under the green dashed line, which means that the probability of the bearish head and shoulders formation (and a significant profit potential on the current trade) is still very high.
To emphasize that the current situation hasn’t changed, we’ll summarize today’s alert in the same way we did yesterday:
Summing up, although crude oil broke above the 50-day moving average, the size of volume doesn’t confirm oil bulls’ strength, which means that the outlook for crude oil remains bearish and it will most likely remain the case at least as long as crude oil remains below the August high. Therefore, we believe that short positions (which are already profitable as we entered them when crude oil was at about $46.68) continue to be justified from the risk/reward point of view.
Very short-term outlook: bearish
Short-term outlook: bearish
MT outlook: bearish
LT outlook: mixed with bearish bias
Trading position (short-term; our opinion): Short positions with a stop-loss order at $54.12 (yes, that far as the medium-term outlook is unlikely to change as long as crude oil stays below the declining medium-term resistance line) and initial (!) target price at $35.72 are justified from the risk/reward perspective. We will keep you – our subscribers – informed should anything change.
Thank you.
Nadia Simmons
Forex & Oil Trading Strategist
Przemyslaw Radomski, CFA
Founder, Editor-in-chief
Gold & Silver Trading Alerts
Forex Trading Alerts
Oil Investment Updates
Oil Trading Alerts

