
Trading position (short-term; our opinion): No positions are justified from the risk/reward perspective.
Although crude oil slipped below $50 after the market’s open weakened by another record high in crude inventories, the commodity rebounded later in the day as investors digested the EIA report. As a result, light crude ereased most of Wednesday’s decline and closed the day above $52, but did this increase change the short-term picture?
Yesterday, the U.S. Energy Information Administration reported that domestic crude oil inventories rose by 7.7 million barrels in the week ended February 13 and stood now at 425.6 million barrels. It’s worth noting that this sixth straight week’s increase took crude oil stocks to a seasonal record peak since August 1982. The report also showed that gasoline inventories increased by 0.5 million barrels, missing expectations for a gain of 0.2 million, while distillate stockpiles decreased by 3.8 million barrels. Thanks to these bearish numbers, light crude declined to an intraday low of $49.82. Although the build was more than double the 3.3 million barrels expected by analysts, crude oil inventories increased far below the 14.3 million barrels estimated on Wednesday by industry group American Petroleum Institute. Therefore, the price of the commodity reversed and bounced sharply off session lows on relief the builds were less than API had estimated. In this way, light crude ereased most of Wednesday’s losses, but is is enough to change the short-term picture? (charts courtesy of http://stockcharts.com).
In our previous Oil Trading Alert, we wrote the following:
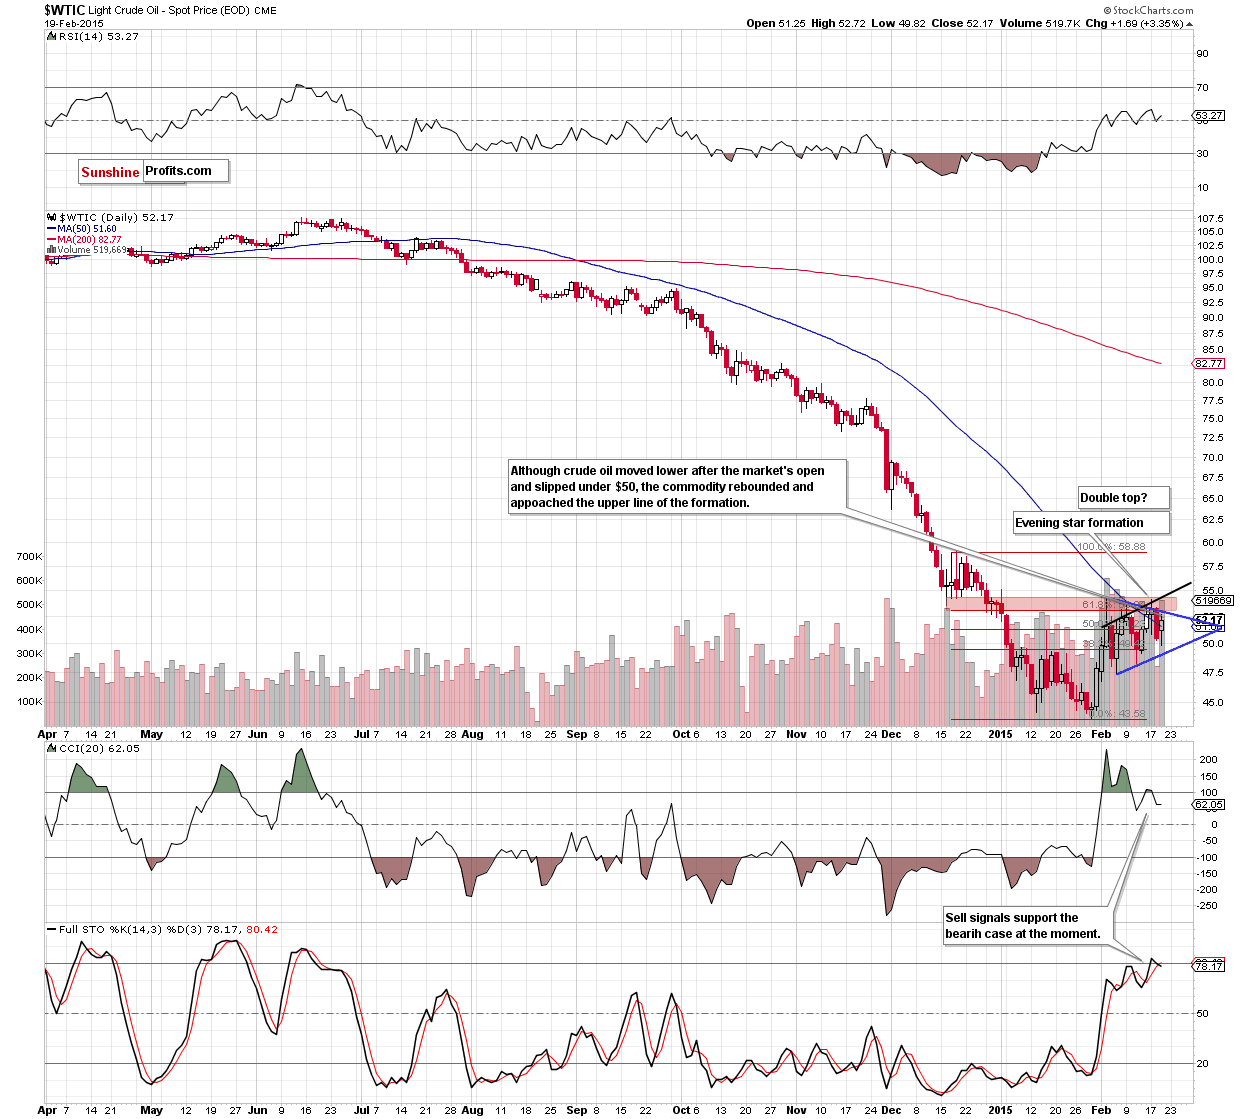
(…) crude oil invalidated the breakout above the 61.8% Fibonacci retracement, which triggered a sharp decline to slightly above $50. Additionally, the recent candlesticks formed an evening star pattern, which is a bearish formation that suggests further deterioration. On top of that, the CCI generated a sell signal (and the Stochastic Oscillator is very close to doing the same), which is an additional negative sign. Taking all the above into account, we think that lower values of the commodity are still ahead us.
Lookig at the daily chart, we see that oil bears pushed the commodity lower as we expected. With yesterday’s move, light crude slipped below $50, but then rebounded sharply and approached the upper line of the triangle. Did this increase change anything? Not really. The reason? As you see on the above chart, despite ths increase, the commodity is still trading in a triangle, under the previously-broken 61.8% Fibonacci retracement, the Dec lows and well below the black resistance line. Additionally, the bearish evening star formation and sell signals generated by the CCI and Stochastic Oscillator are still in play, supporting the bearish case. Taking these facts into account, we think that as long as the red resistance zone is in play further rally is questionable and anoher pullack from here (even to the lower line of the triangle at $49.44) is likely.
Having said that, let’s examine the weekly chart and find out what can we infer from it.
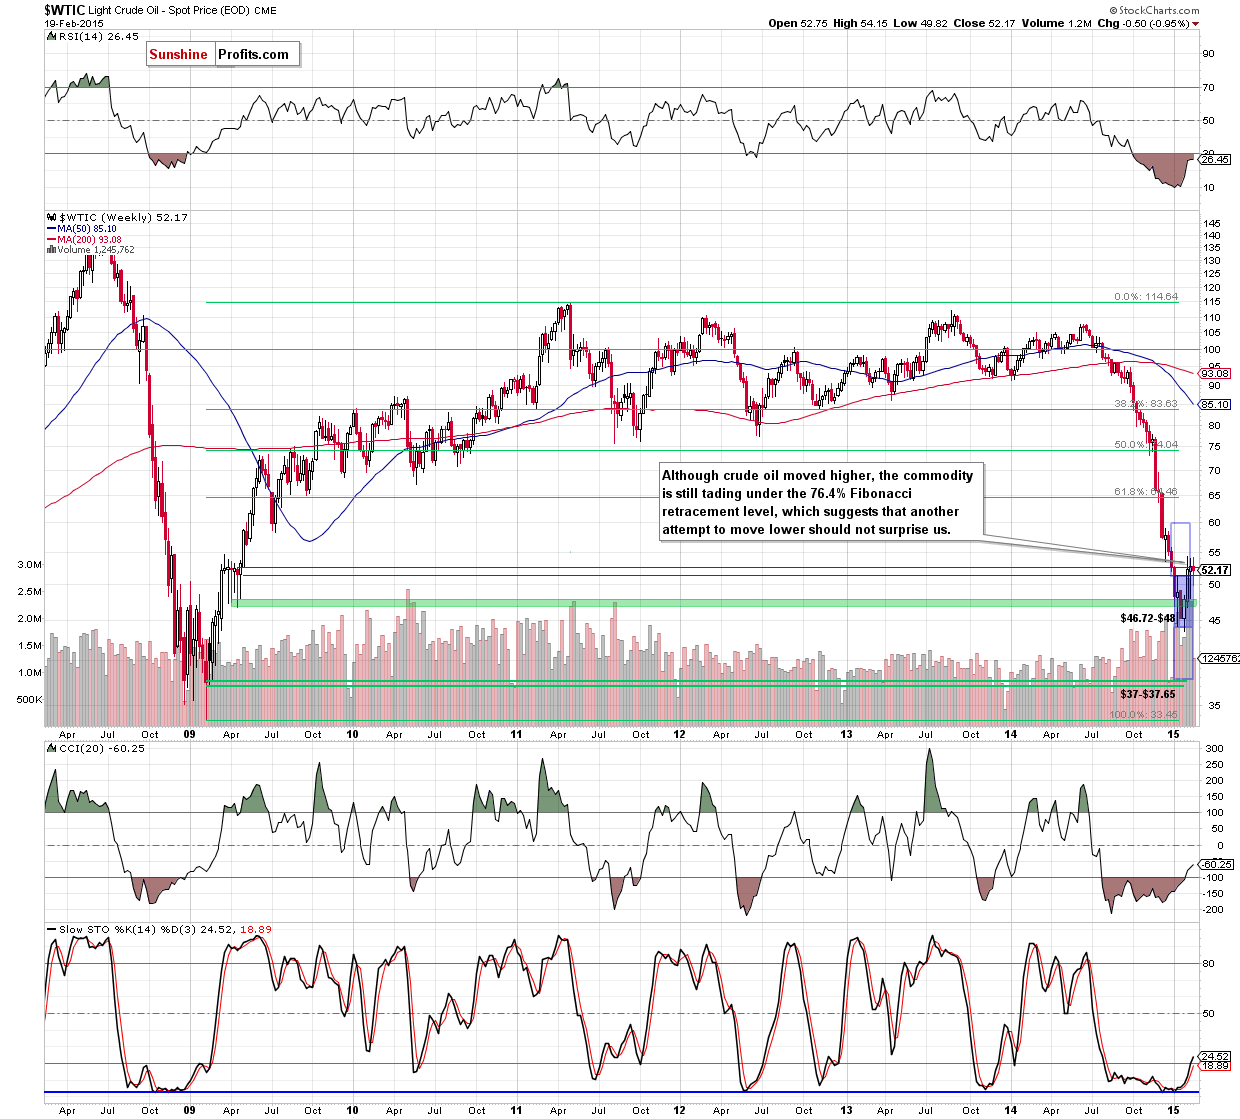
From this perspective, we see that yesterday’s increase invalidated the breakdown under the 78.6% Fibonacci retracement. Although this is a positive signal, we saw similar price action in the previous weeks. Back then, despite such improvement, oil bulls didn’t manage to push the commodity higher, which resulted in a pullback to the support zone based on Apr 2009 lows. Taking this fact into account, and combining it with the very short-term picture, we still believe that as long as the commodity is trading below $53.13-$54.24 further rally is doubtful.
Before we summarize today’s alert, we would like to draw your attention to today’s Baker Hughes report. In the previous weeks, crude oil has dropped on EIA reports of inventory builds, but then rallied on Fridays and ereased losses after this industry firm showed another fall in the U.S. oil rig count. Tking this fact into account, we could see similar price action later in the day. If this is the case, the commodity will likely test the strength of the above-mentioned red resistance zone once again.
Summing up,although crude oil bounced off the session lows and approached the upper line of the blue triangle, the commodity is still trading under the red resistance zone (created by the above-mentioned upper border of the triangle, the 61.8% Fibonacci retracement based on the Dec-Jan decline, the Dec lows and the black resistance line), which keeps gains in check. Although we could see some strength later in the day due to Baker Hughes report, we believe that as long as the commodity is trading below $53.13-$54.24 further rally is doubtful.
Very short-term outlook: mixed
Short-term outlook: mixed
MT outlook: mixed
LT outlook: bullish
Trading position (short-term; our opinion): No positions are justified from the risk/reward perspective. Nevertheless, if we see a daily close above the upper line of the blue triangle and the black resistance line, we’ll consider opening long positions. We will keep you informed should anything change.
Thank you.
Nadia Simmons
Forex & Oil Trading Strategist
Przemyslaw Radomski, CFA
Founder, Editor-in-chief
Gold & Silver Trading Alerts
Forex Trading Alerts
Oil Investment Updates
Oil Trading Alerts

