

Please note that due to market volatility, some of the key levels may have already been reached and scenarios played out.
Trading position
- Crude Oil [CLX21] No position justified from the risk/reward point of view;
- Natural Gas [NGX21] Long around $5.480-5.568 with stop below $4.766 (previous swing low) and targets at $6.63 (TP1) and $7.79 (TP2) – Fig. 1 & 2.
On the chart below, I marked the next potential support level for natural gas. We see a dip there to initiate an entry on the long side.
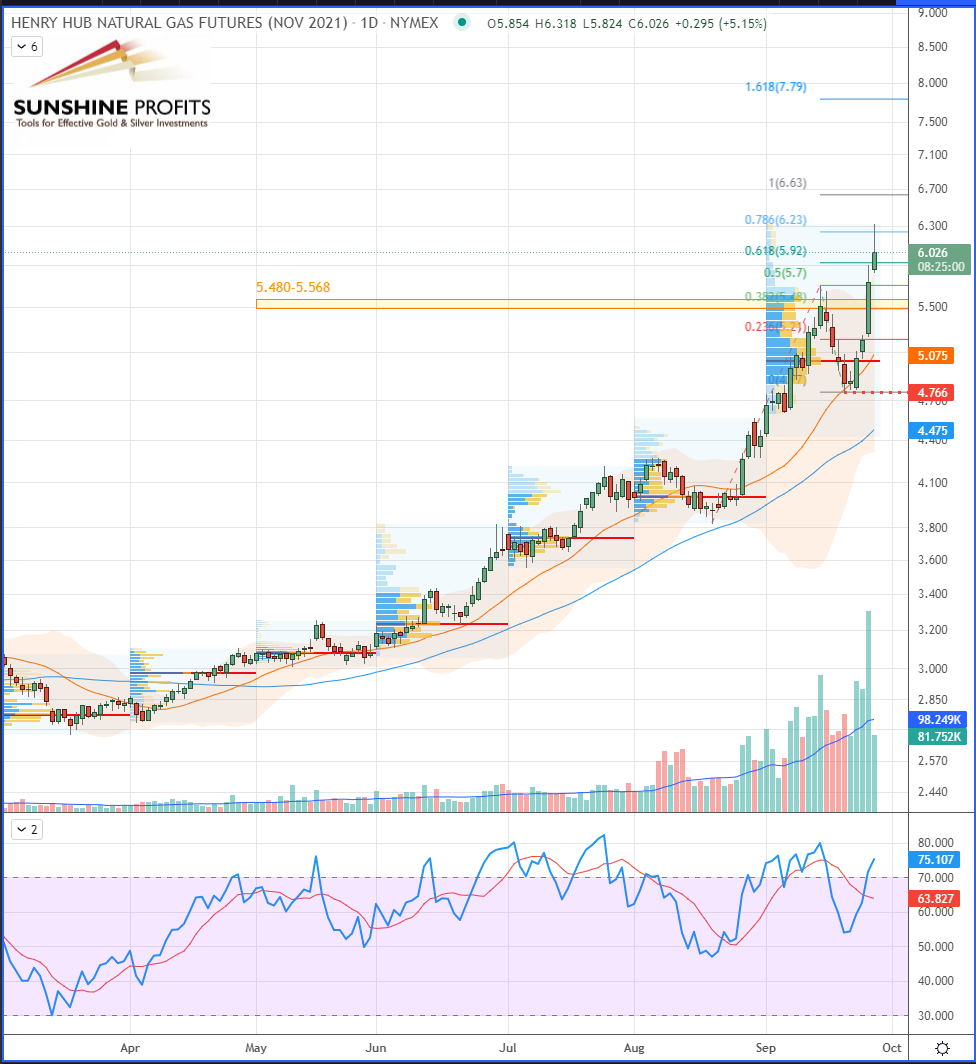
Figure 1 – Henry Hub Natural Gas (NGX21) Futures (November contract, daily, logarithmic scale)
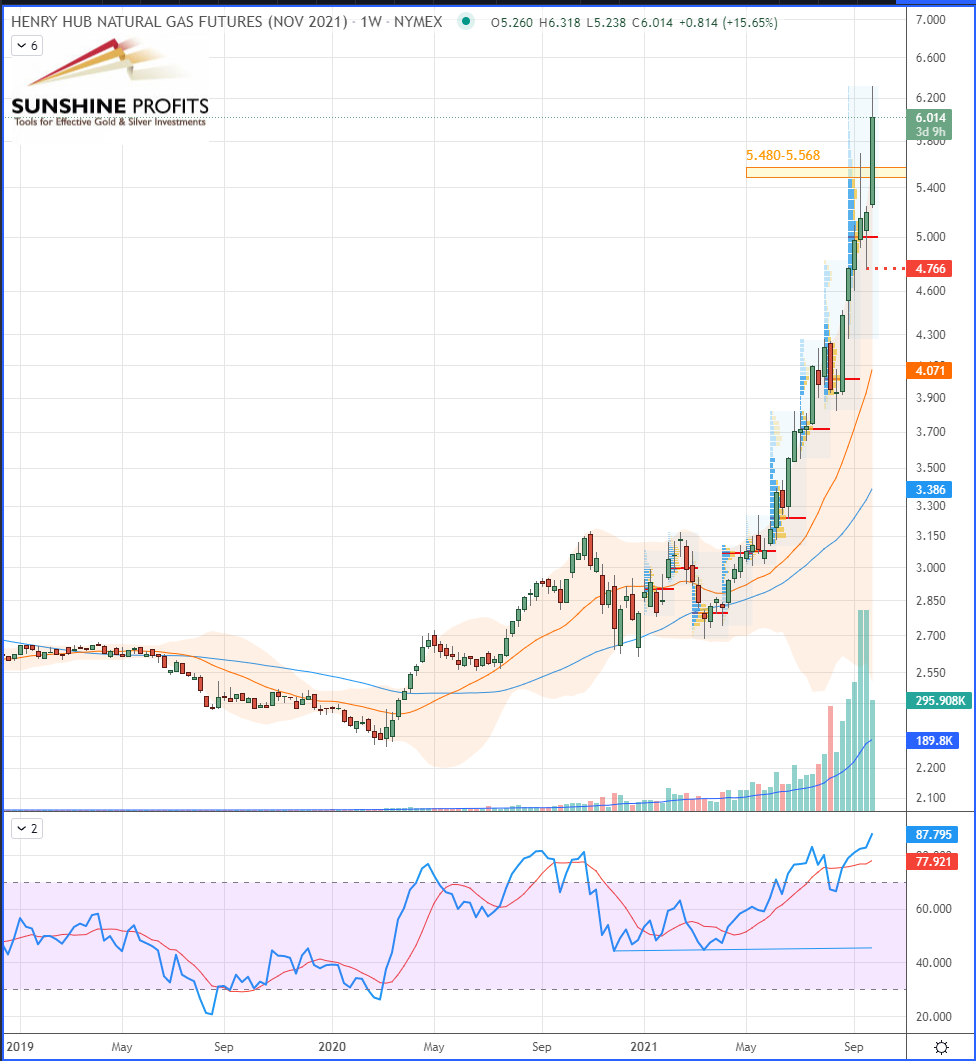
Figure 2 – Henry Hub Natural Gas (NGV21) Futures (October contract, weekly chart, logarithmic scale)
In brief, today we defined a new relative support level for natural gas in order to find a long entry, based on its recent market developments.
As always, we’ll keep you, our subscribers, well-informed.
Please note that due to market volatility, some of the key levels may have already been reached and scenarios played out.
Trading position
- Crude Oil [CLX21] No position justified from the risk/reward point of view;
- Natural Gas [NGX21] Long around $5.480-5.568 with stop below $4.766 (previous swing low) and targets at $6.63 (TP1) and $7.79 (TP2) – Fig. 1 & 2.
Thank you.
Sebastien Bischeri
Oil & Gas Trading Strategist

