

Stock Trading Alert originally sent to subscribers on March 7, 2016, 6:50 AM.
Briefly: In our opinion, speculative short positions are favored (with stop-loss at 2,050, and profit target at 1,900, S&P 500 index).
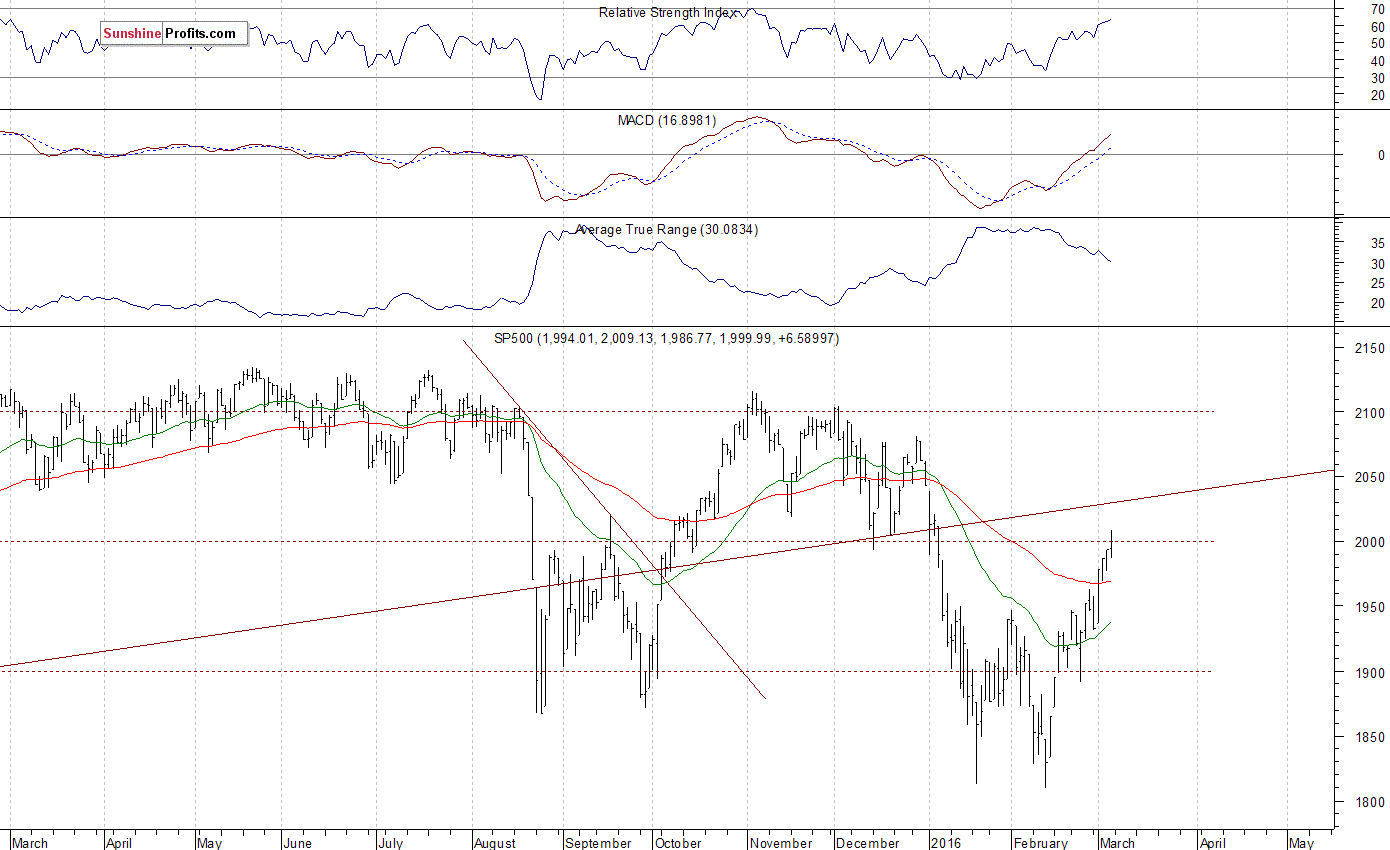
Our intraday outlook is now bearish, and our short-term outlook is bearish. Our medium-term outlook remains bearish, as the S&P 500 index extends its lower highs, lower lows sequence. We decided to change our long-term outlook to neutral recently, following a move down below medium-term lows:
Intraday outlook (next 24 hours): bearish
Short-term outlook (next 1-2 weeks): bearish
Medium-term outlook (next 1-3 months): bearish
Long-term outlook (next year): neutral
The main U.S. stock market indexes gained between 0.1% and 0.4% on Friday, slightly extending their recent move up, as investors reacted to monthly jobs data report release. The S&P 500 index broke above the level of 2,000, before closing at 1,999.99. The nearest important level of resistance is at around 2,000-2,010, and the next resistance level is at around 2,040, marked by the early January daily gap down of 2,038.20-2,043.62. On the other hand, support level is at 1,960-1,980, marked by previous level of resistance. The next important level of support is at 1,950, marked by previous local high. There have been no confirmed negative signals so far. However, we can see some short-term overbought conditions:
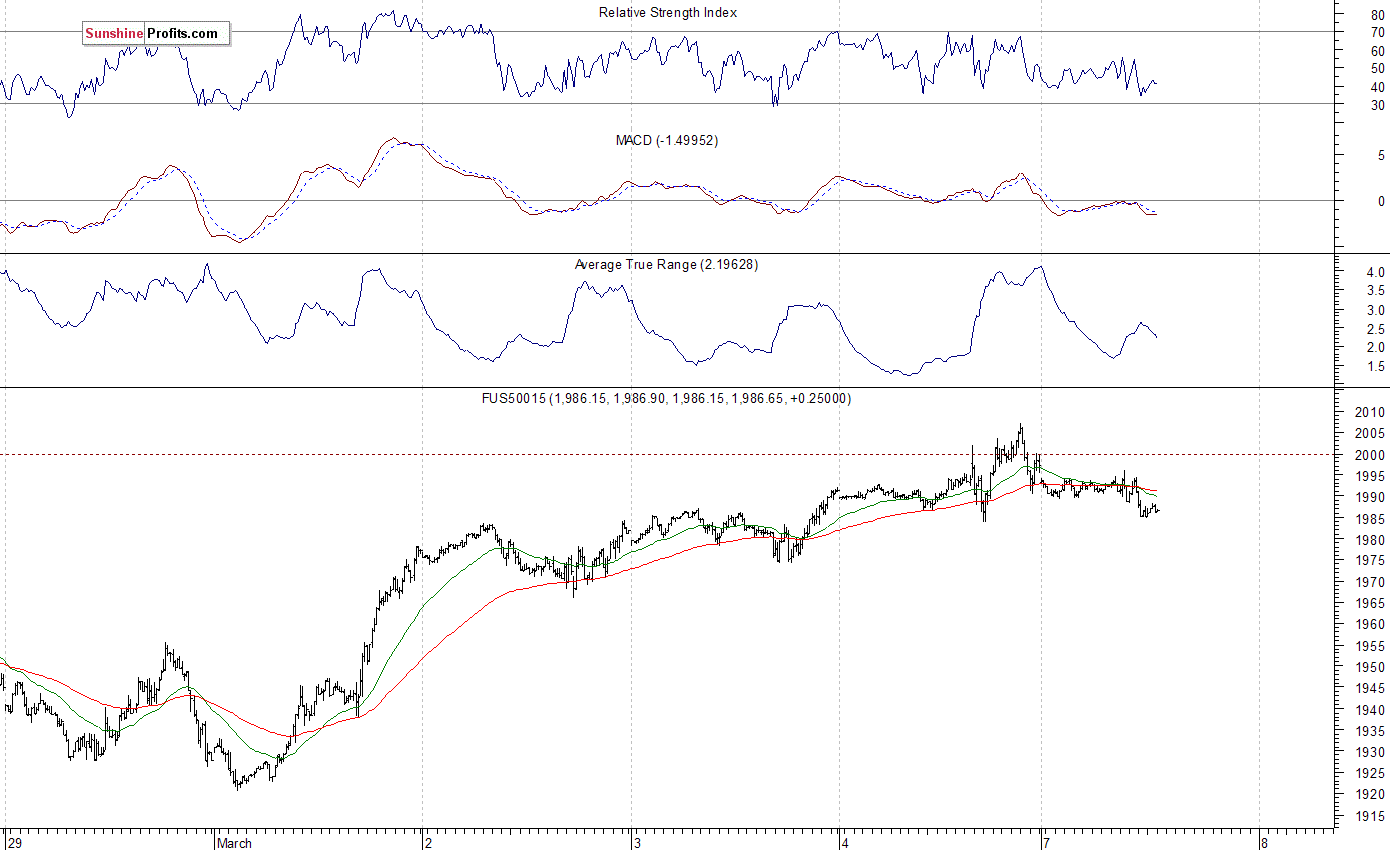
Expectations before the opening of today's trading session are negative, with index futures currently down 0.2-0.5%. The European stock market indexes have lost 0.8-1.1% so far. The S&P 500 futures contract trades within an intraday downtrend, as it retraces some of its Friday's move up. The nearest important level of support is at around 1,980-1,985, marked by recent local lows. On the other hand, resistance level is at 2,000-2,010, as we can see on the 15-minute chart:
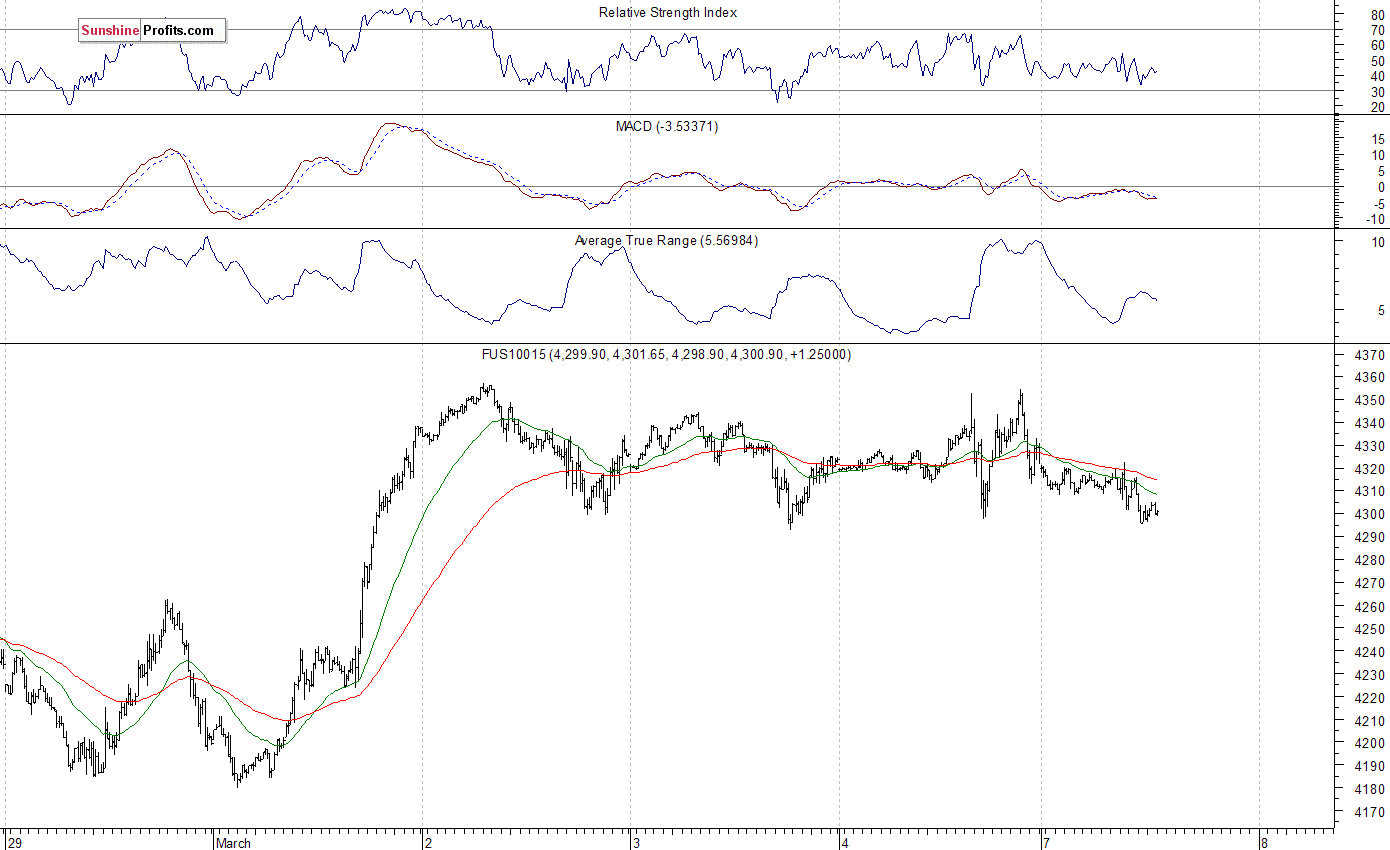
The technology Nasdaq 100 futures contract follows a similar path, as it currently trades within an intraday downtrend following Friday's volatile fluctuations. The nearest important level of resistance is at around 4,330-4,350, marked by recent local highs. On the other hand, support level is at 4,300, and the next support level is at 4,250.
Concluding, the broad stock market continued its short-term uptrend on Friday, as investors reacted to monthly jobs data announcement, among others. There have been no confirmed short-term negative signals so far. However, we decided to open a speculative short position at the opening of today's cash market trading session (S&P 500 index). We expect a downward correction or uptrend reversal at some point. Stop-loss level is at 2,050, marked by the above-mentioned daily gap down resistance level, and potential profit target is at 1,900 (S&P 500 index). You can trade S&P 500 index using futures contracts (S&P 500 futures contract - SP, E-mini S&P 500 futures contract - ES) or an ETF like the SPDR S&P 500 ETF - SPY. It is always important to set some exit price level in case some events cause the price to move in the unlikely direction. Having safety measures in place helps limit potential losses while letting the gains grow.
Thank you.
Paul Rejczak
Stock Trading Strategist
Stock Trading Alerts
