

Stock Trading Alert originally sent to subscribers on November 7, 2016, 6:53 AM.
Briefly: In our opinion, no speculative positions are justified.
Our intraday outlook is neutral, and our short-term outlook is neutral. Our medium-term outlook remains neutral, following S&P 500 index breakout above last year's all-time high:
Intraday outlook (next 24 hours): neutral
Short-term outlook (next 1-2 weeks): neutral
Medium-term outlook (next 1-3 months): neutral
Long-term outlook (next year): neutral
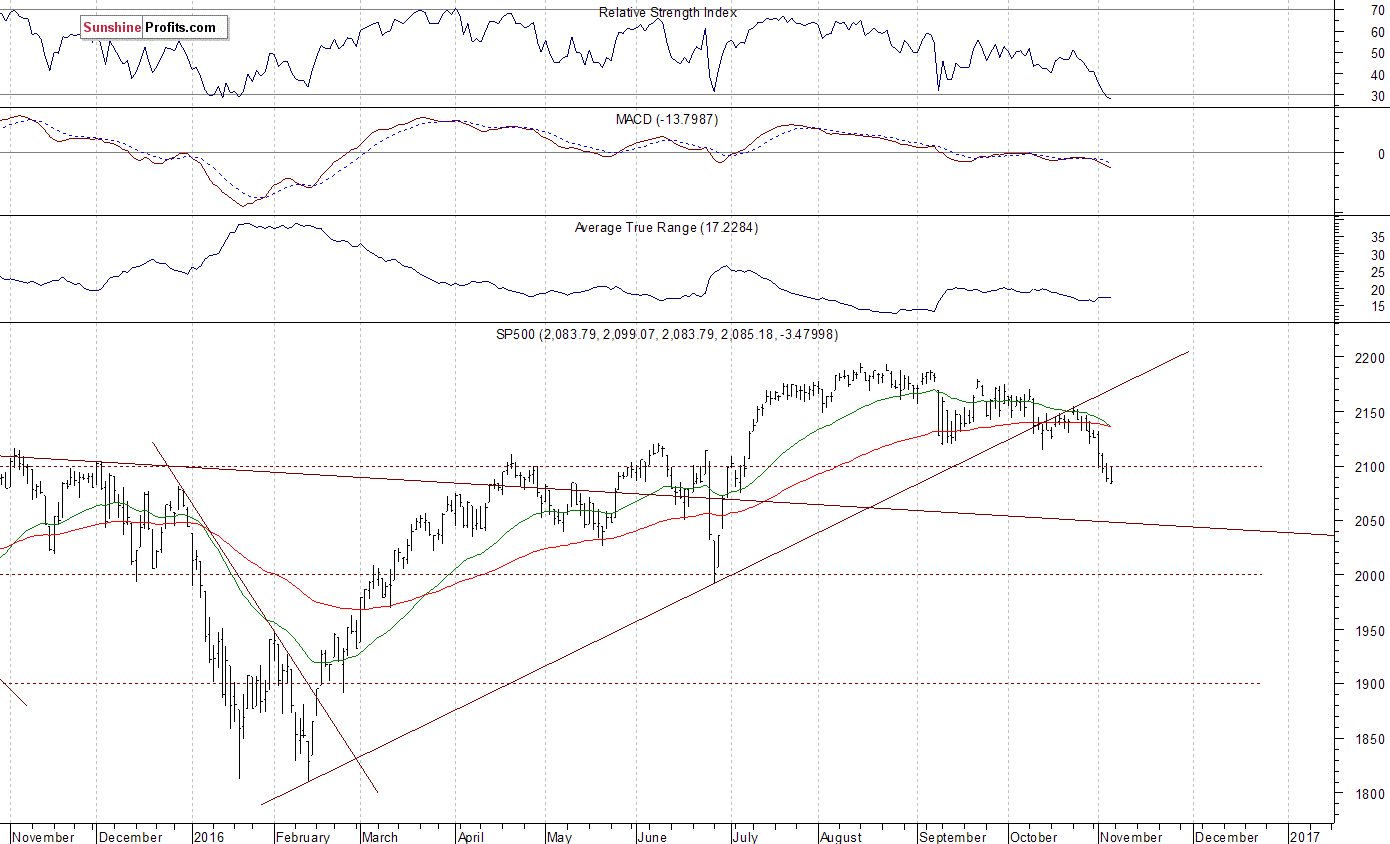
The U.S. stock market indexes lost 0.2-0.4% on Friday, slightly extending their short-term downtrend, as investors reacted to economic data releases, U.S. presidential election uncertainty. The S&P 500 index broke below its September - October local lows last Tuesday. It is the lowest since early July. The nearest important support level is at around 2,075-2,090, marked by previous consolidation. The next important level of support is at 2,035-2,045, marked by the late June daily gap up. On the other hand, resistance level is at 2,100-2,120, and the next resistance level is at 2,150 marked by last month's local highs, as we can see on the daily chart:
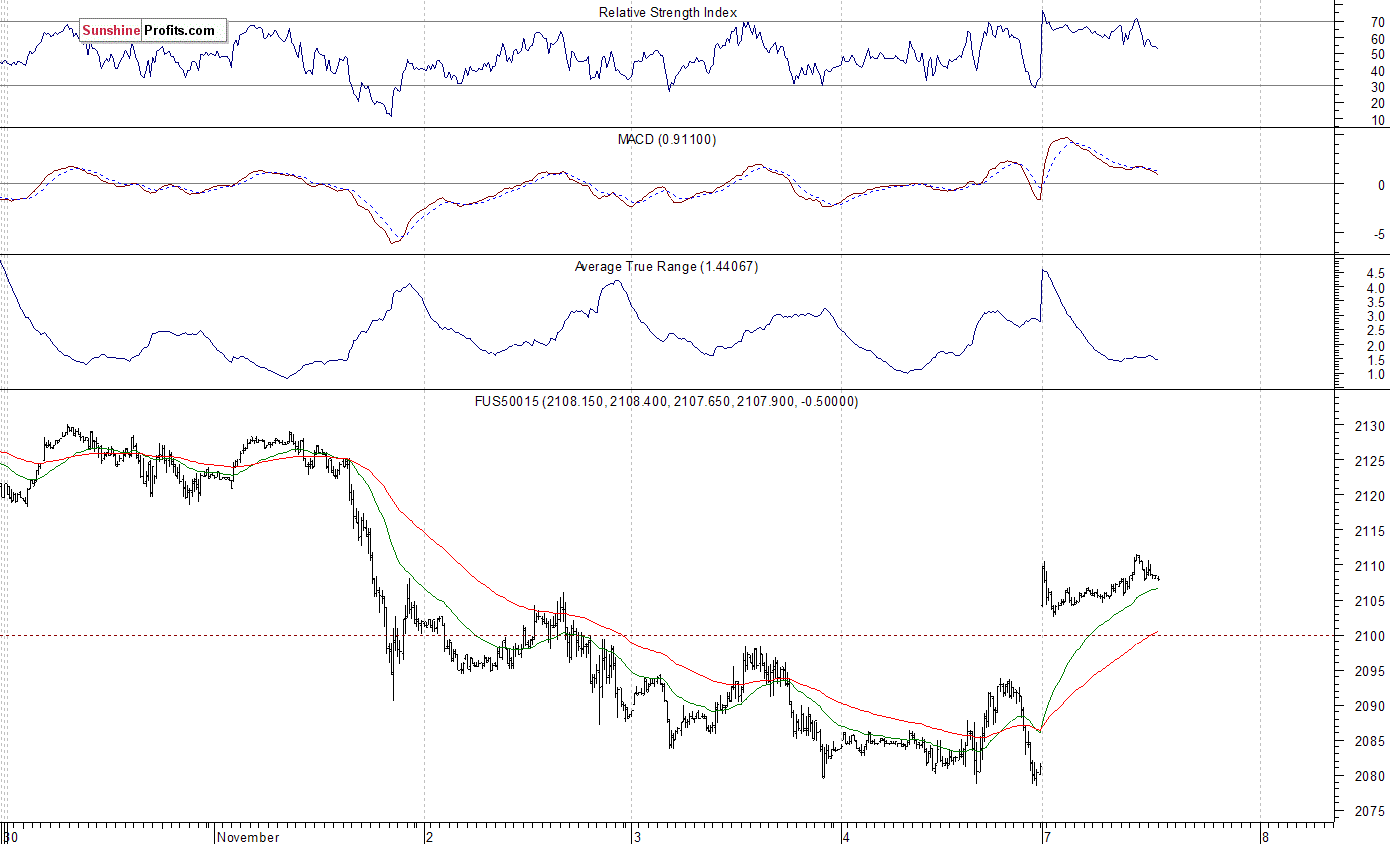
Expectations before the opening of today's trading session are positive, as investors react to U.S. presidential election news, with index futures currently up 1.3-1.5%. The European stock market indexes have gained 1.6-1.8% so far. The S&P 500 futures contract trades within an intraday uptrend, as it sharply bounces off its Friday's lows, following today's daily gap up. The nearest important level of support is at around 2,080-2,100, marked by recent fluctuations. On the other hand, resistance level is at 2,120-2,140, marked by previous short-term consolidation:
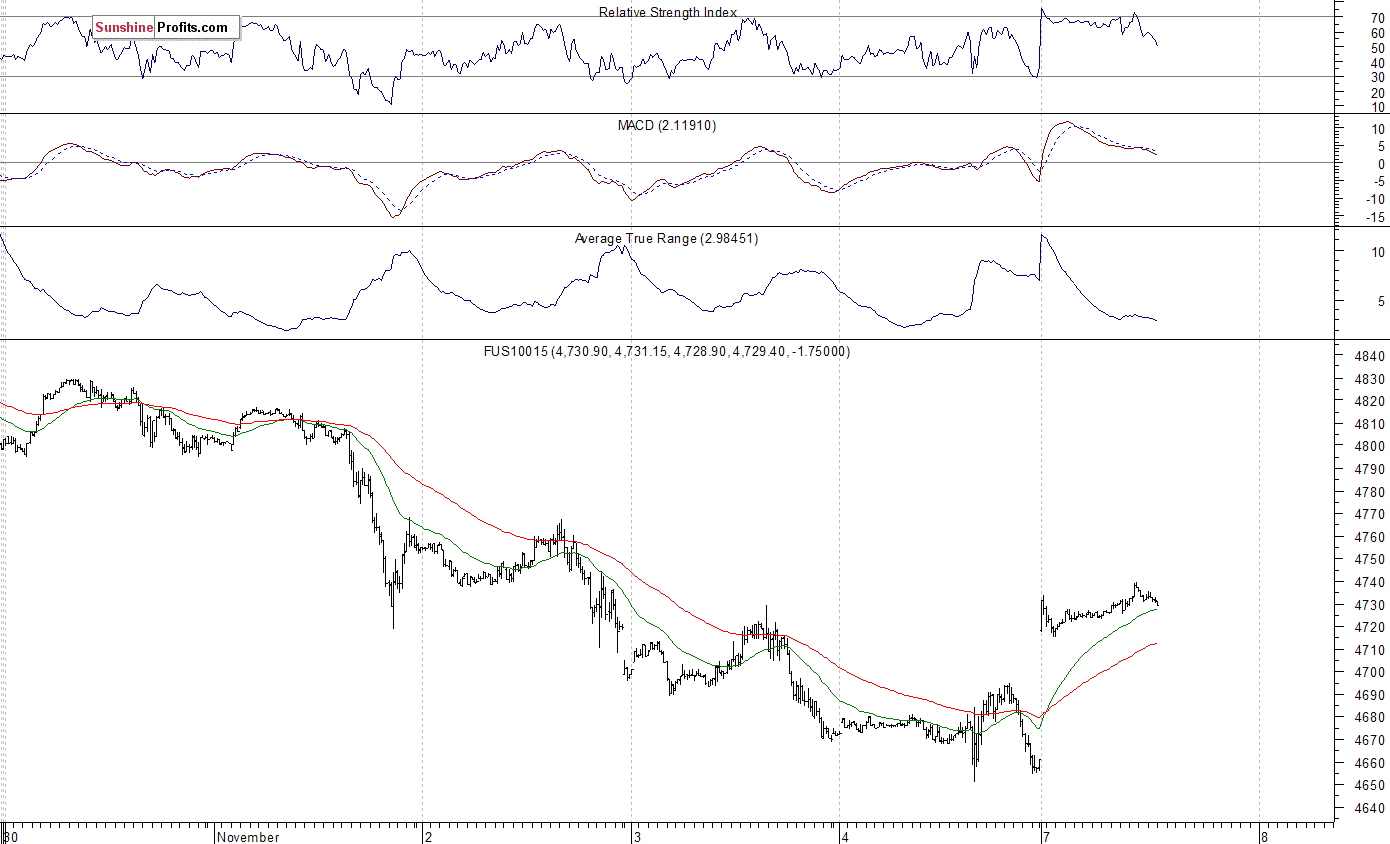
The technology Nasdaq 100 futures follows a similar path, as it currently trades within an intraday uptrend. The market retraces its recent move down. The nearest important level of resistance is at around 4,750-4,800. On the other hand, support level remains at 4,680-4,700, among others, as the 15-minute chart shows:
Concluding, the broad stock market slightly extended its short-term downtrend on Friday, as investors reacted to economic data releases, among others. We decided to close our profitable short position (opened on July 18 at 2,162 - S&P 500 index) at the opening of Friday's trading session - the average opening price of the S&P 500 index was at 2,085. Overall, we gained 77 index points on that over three-month-long speculative short trade following June - July rally off "Brexit" low. Currently, we prefer to be out of the market, avoiding low risk/reward ratio trades. We will let you know when we think it is safe to get back in the market.
Thank you.
Paul Rejczak
Stock Trading Strategist
Stock Trading Alerts
