

Stock Trading Alert originally sent to subscribers on January 7, 2016, 6:25 AM.
Briefly: In our opinion, no speculative positions are justified.
Our intraday outlook is now neutral, and our short-term outlook is neutral:
Intraday outlook (next 24 hours): neutral
Short-term outlook (next 1-2 weeks): neutral
Medium-term outlook (next 1-3 months): bearish
Long-term outlook (next year): bullish
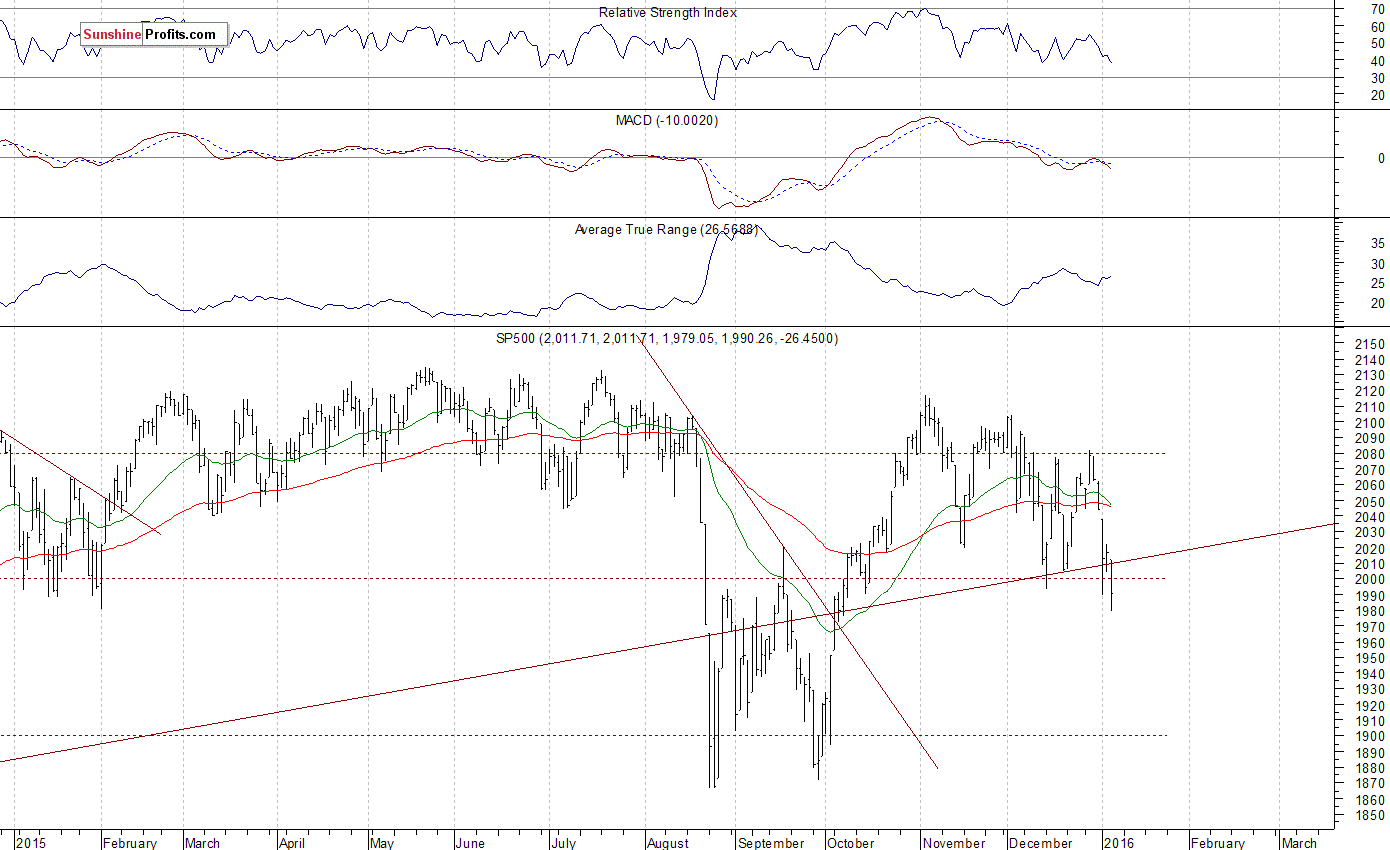
The U.S. stock market indexes lost 0.9-1.5% on Wednesday, extending their recent move down, as investors reacted to economic data releases, oil prices decline. The S&P 500 index broke below 2,000 mark. The nearest important level of support is at 1,990-2,000, and the next potential support level is at around 1,950, marked by early October daily gap up, among others. On the other hand, level of resistance is at 2,000 mark, and the next important resistance level is at around 2,040, marked by Monday's daily gap down of 2,038.20-2,043.62. There have been no confirmed positive signals so far. However, we can see some short-term oversold conditions which may lead to an upward correction at some point:
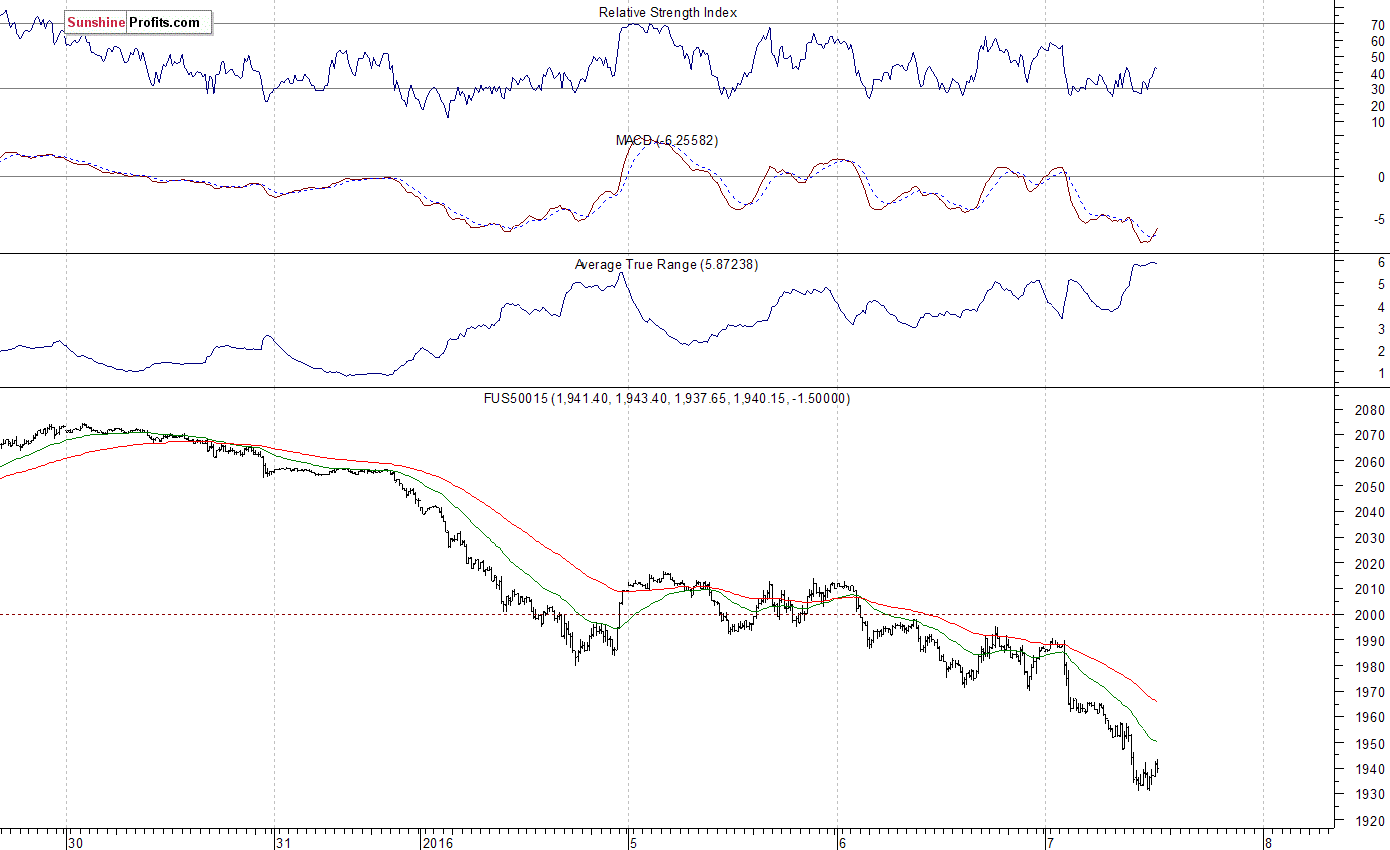
Expectations before the opening of today's trading session are very negative, with index futures currently down 2.2-3.0%, as investors react to Chinese stock market, oil prices sell-off. The main European stock market indexes have lost 2.7-3.3% so far. Investors will now wait for the Initial Claims number release at 8:30 a.m. The S&P 500 futures contract trades within a sharp intraday downtrend, as it extends its recent sell-off. The nearest important level of resistance is at around 1,950-1,970, marked by previous local lows. On the other hand, potential support level is at 1,910-1,930, marked by some last year's local highs. There have been no confirmed positive signals so far. However, we can see short-term oversold conditions:
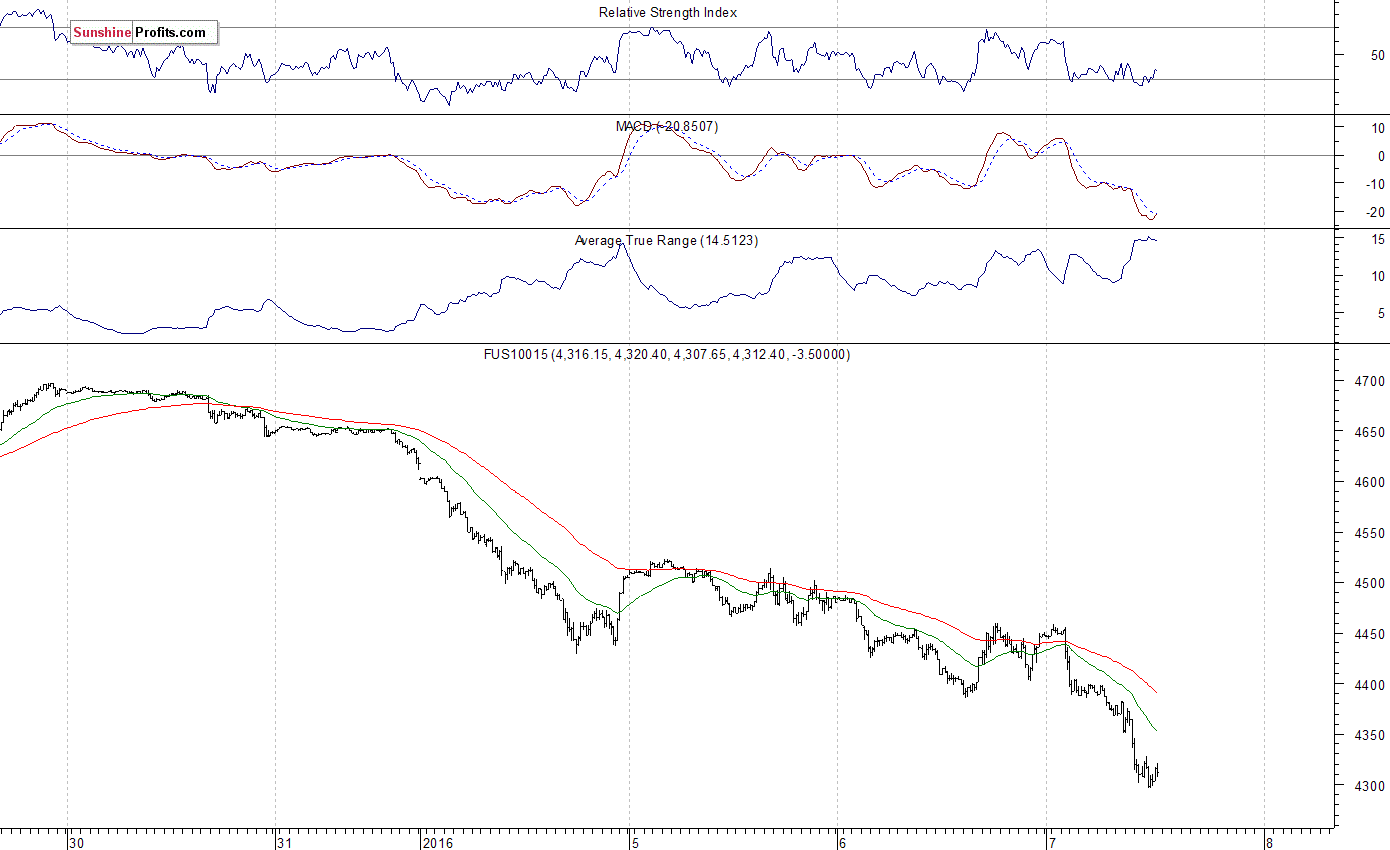
The technology Nasdaq 100 futures contract follows a similar path, as it accelerates its short-term downtrend. It currently trades close to 4,300 mark. The nearest important level of resistance is at around 4,350-4,400. There have been no confirmed short-term positive signals so far. The market broke below yesterday's intraday consolidation, as we can see on the 15-minute chart:
Concluding, the broad stock market is expected to open much lower today, as the index futures are down more than 2% right now. However, we can see some short-term technical oversold conditions. Therefore, we decided to close our profitable speculative short position (2,077.34, S&P 500 index) at the opening of today's cash market trading session. As of this morning, we prefer to be out of the market, avoiding low risk/reward ratio trades. We will let you know when we think it is safe to get back in the market.
Thank you.
Paul Rejczak
Stock Trading Strategist
Stock Trading Alerts
