

Stock Trading Alert originally sent to subscribers on January 4, 2016, 6:36 AM.
Briefly: In our opinion, speculative short positions are favored (with stop-loss at 2,070 and profit target at 1,940, S&P 500 index)
Our intraday outlook is bearish, and our short-term outlook is bearish:
Intraday outlook (next 24 hours): bearish
Short-term outlook (next 1-2 weeks): bearish
Medium-term outlook (next 1-3 months): bearish
Long-term outlook (next year): bullish
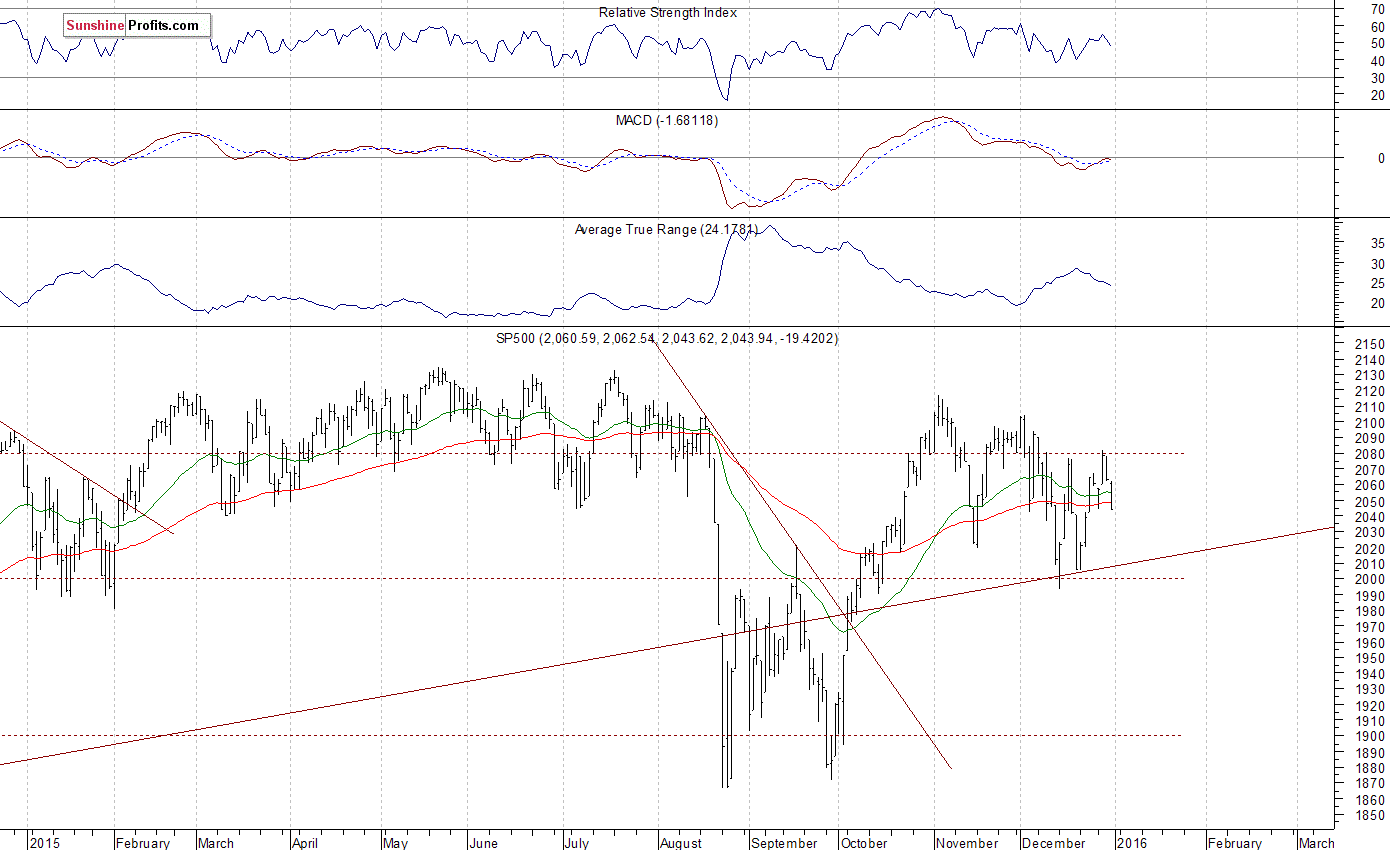
The U.S. stock market indexes lost 0.9-1.3% on Thursday, retracing more of their recent move up, as investors reacted to worse-than-expected economic data announcements (Initial Claims, Chicago PMI number). The S&P 500 index continues to trade within medium-term consolidation following October rally. The nearest important level of resistance is at around 2,080-2,100, marked by previous local highs. On the other hand, support level is at 2,000-2,020, among others. The index extends its fluctuations along its last year's February - August consolidation. There is no clear medium-term direction, as we can see on the daily chart:
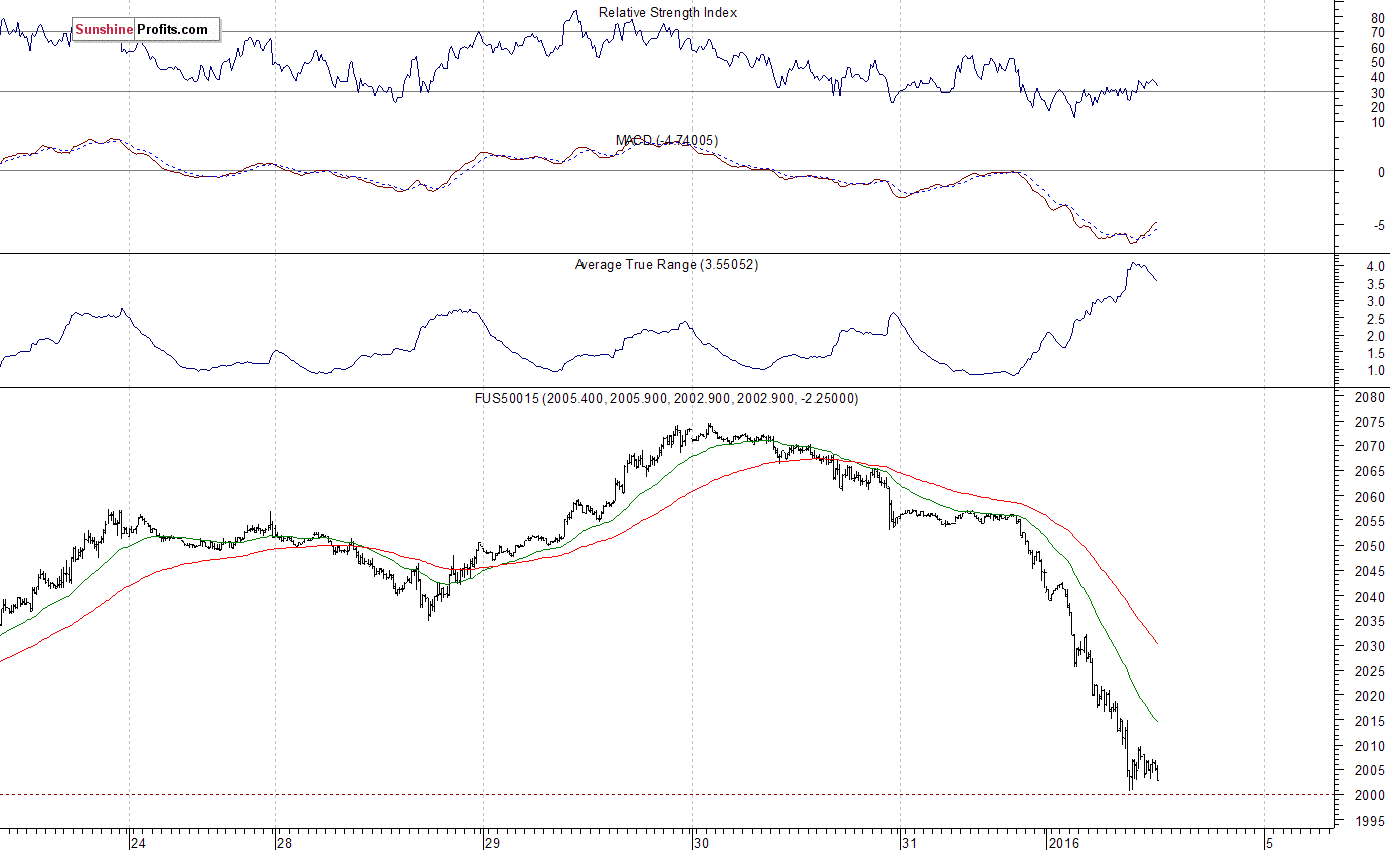
Expectations before the opening of today's trading session are negative, with index futures currently down 1.5-1.7%. The main European stock market indexes have lost between 2.0% and 3.4% so far. The markets react to China stock market plunge after worse-than-expected economic data releases. Investors will now wait for some U.S. economic data announcements: Construction Spending, ISM Index number at 10:00 a.m. The S&P 500 futures contract trades within an intraday downtrend, as it extends its Thursday's decline. The nearest important level of support is at 2,000. On the other hand, resistance level is at around 2,035, marked by previous local low. There have been no confirmed positive signals so far. However, we can see some short-term oversold conditions:
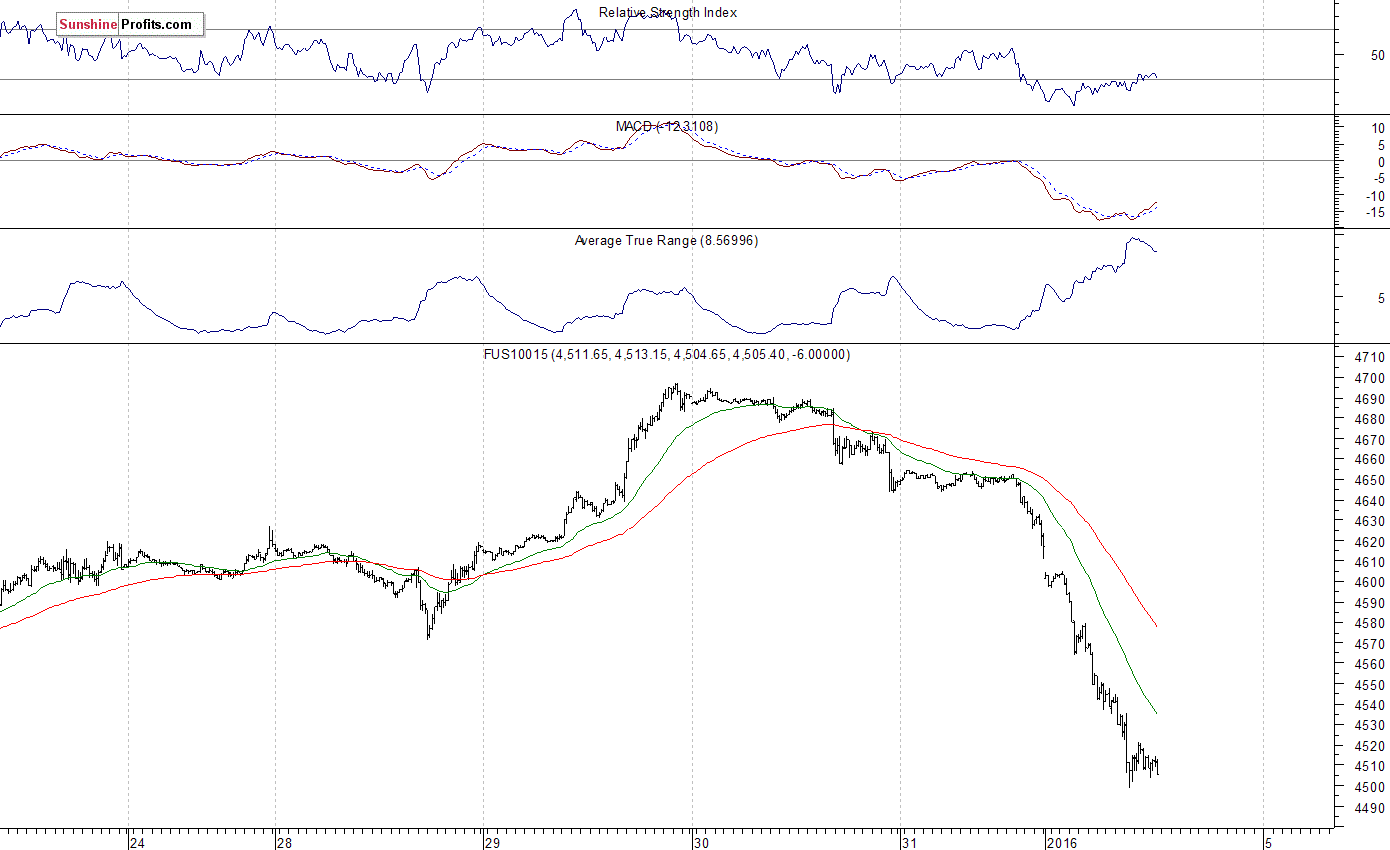
The technology Nasdaq 100 futures contract follows a similar path, as it continues its Thursday's move down. The nearest important level of support is at 4,500. On the other hand, resistance level remains at 4,570-4,600, among others. The market remains within a relatively sharp intraday downtrend. However, we can see short-term technical oversold conditions, as the 15-minute chart shows:
Concluding, the broad stock market is expected to open much lower this morning on the back of Asian stocks sell-off. It is hard to say whether this is a new short-term downtrend leading to breakdown below December low or just another volatile pull-back within two-month long consolidation, but we continue to maintain our already profitable speculative short position (2,077.34, S&P 500 index). We expect a medium-term downward correction or an uptrend reversal. However, to protect our gains and to follow a potential new downtrend, we decided to move our stop-loss level down to 2,070, and profit target level down to 1,940. You can trade S&P 500 index using futures contracts (S&P 500 futures contract - SP, E-mini S&P 500 futures contract - ES) or an ETF like the SPDR S&P 500 ETF - SPY. It is always important to set some exit price level in case some events cause the price to move in the unlikely direction. Having safety measures in place helps limit potential losses while letting the gains grow.
Thank you.
Paul Rejczak
Stock Trading Strategist
Stock Trading Alerts
