
Stock Trading Alert originally sent to subscribers on September 15, 2014, 6:49 AM.
Briefly: In our opinion, speculative short positions are favored (with stop-loss at 2,030 and a profit target at 1,900, S&P 500 index)
Our intraday outlook is bearish, and our short-term outlook is bearish:
Intraday
(next 24 hours) outlook: bearish
Short-term (next 1-2 weeks) outlook: bearish
Medium-term (next 1-3 months) outlook: neutral
Long-term outlook (next year): bullish
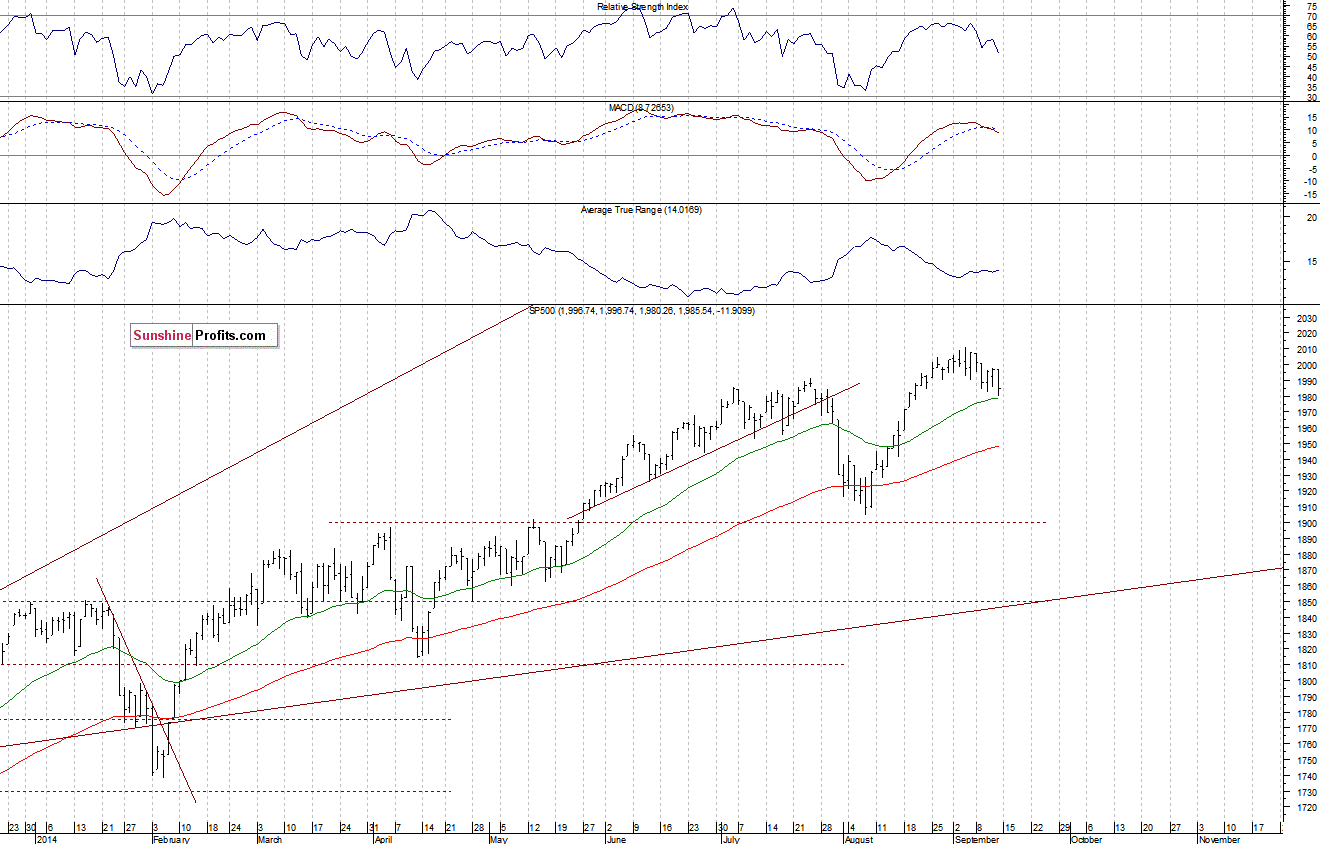
The main U.S. stock market indexes lost between 0.4% and 0.6% on Friday, retracing some more of their August rally, as investors took profits. Our Friday’s negative intraday outlook has proved accurate. The S&P 500 index remains in a slightly descending trading channel, however, it is still relatively close to the September 4 all-time high of 2,011.17. The nearest important resistance level is at around 2,000-2,010, and the level of support is at 1,980-1,985, among others. There have been no confirmed negative signals so far, however, we still can see negative technical divergences, accompanied by medium-term overbought conditions:
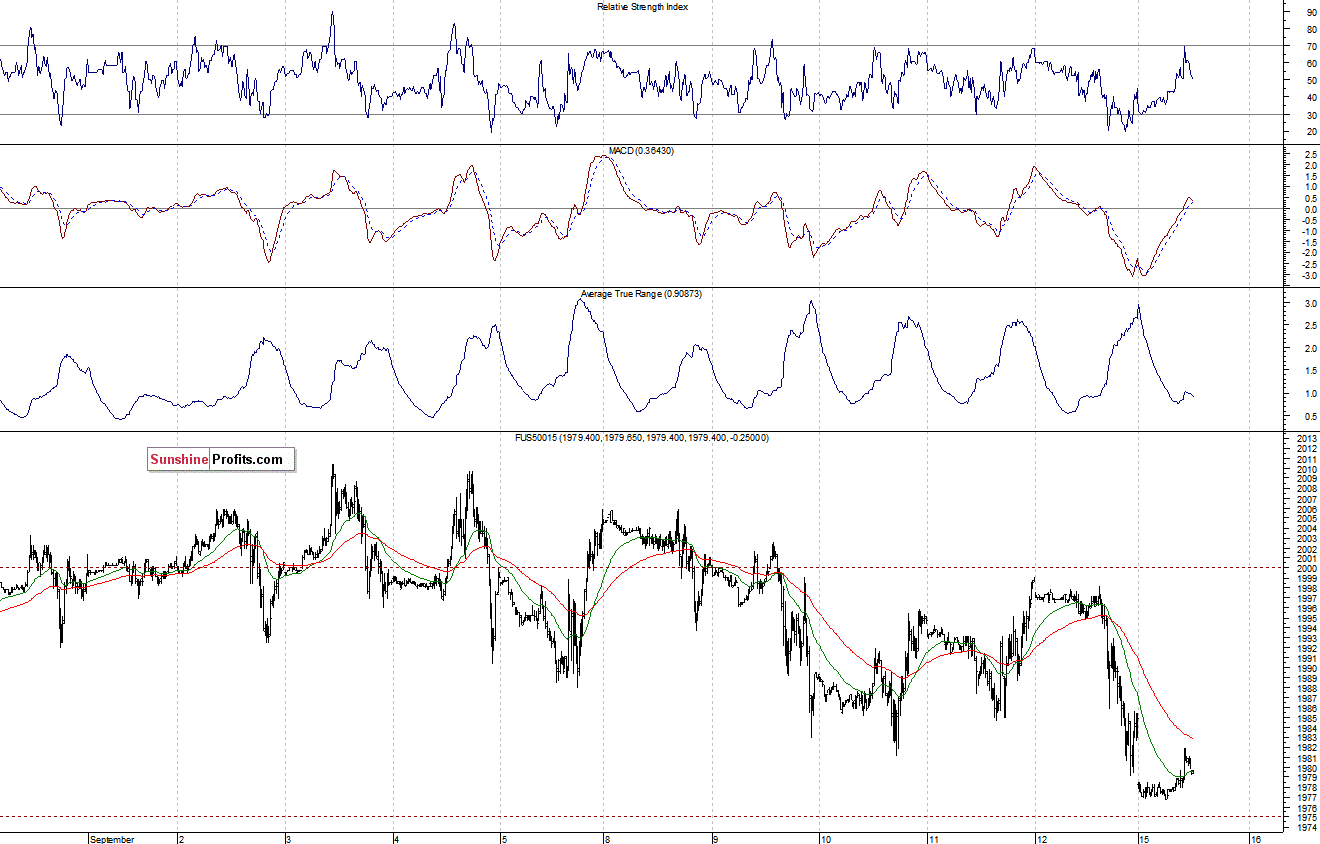
Expectations before the opening of today’s session are slightly negative, with index futures currently down 0.1-0.2%. The European stock market indexes have been mixed so far. Investors will now wait for some economic data announcements: Empire Manufacturing number at 8:30 a.m., Industrial Production, Capacity Utilization at 9:15 a.m. The Industrial Production is a monthly report that tracks total output from the nation’s factories, mines and utilities. It is released by the Federal Reserve around the 15th of each month. The data gives insight into the performance of the economy. The S&P 500 futures contract (CFD) trades close to its local lows, as it extends last week’s move down. The resistance level is at around 1,985, among others. On the other hand, potential level of support is at 1,970-1,975:
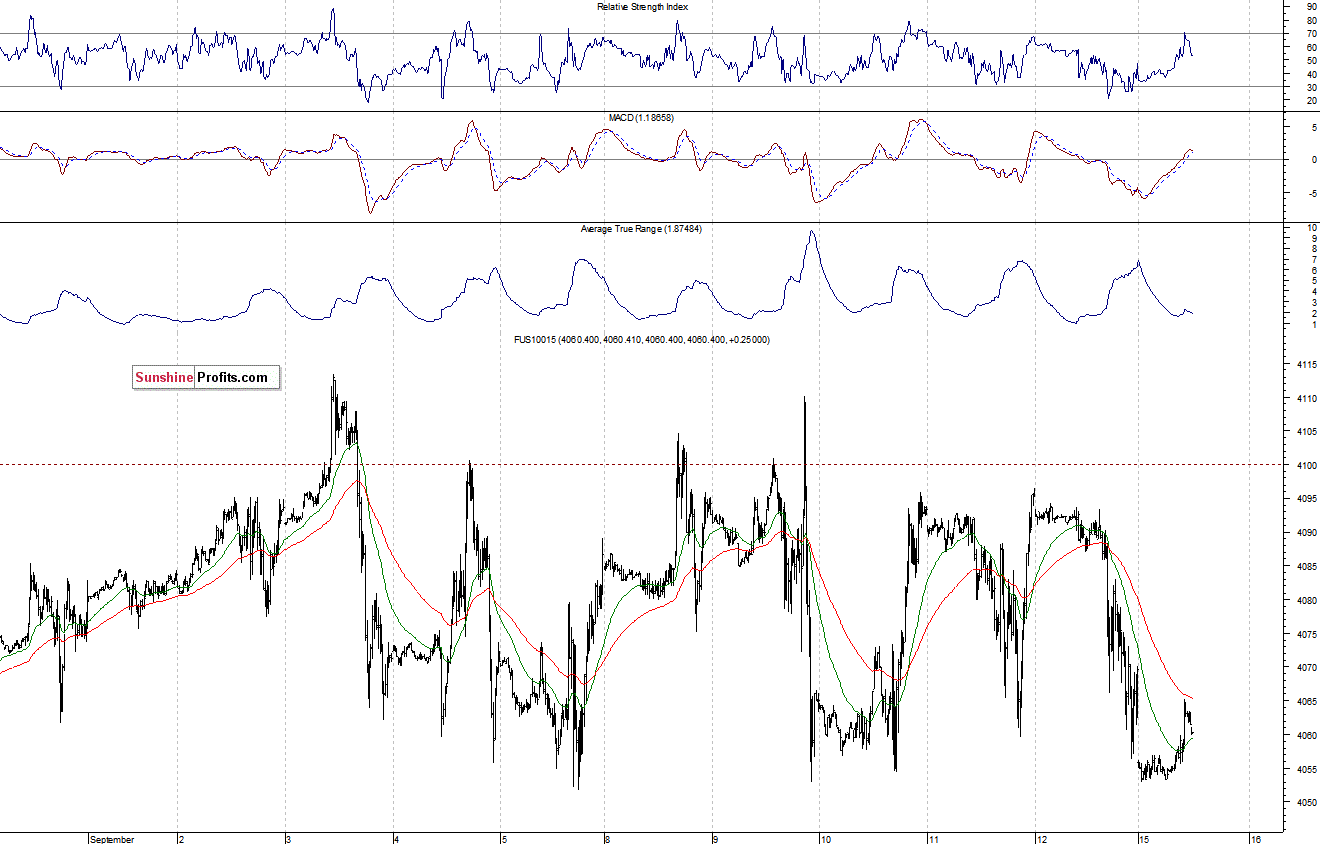
The technology Nasdaq 100 futures contract (CFD) remains close to its recent local lows, testing the support level of 4,050-4,060. On the other hand, the level of resistance is at around 4,090-4,100. There is no clear short-term direction, as we can see on the 15-minute chart:
Concluding, the broad stock market is in a short-term downtrend, as it moves further away from the level of resistance at 2,000-2,010. We remain bearish, expecting a downward correction or uptrend reversal. Therefore, we continue to maintain our already profitable speculative short position with entry point at 2,000.5 (S&P 500 index). The stop-loss is at the level of 2,030 and potential profit target is at 1,900 (S&P 500 index). It is always important to set some exit price level in case some events cause the price to move in the unlikely direction. Having safety measures in place helps limit potential losses while letting the gains grow.
Thank you.
Paul Rejczak
Stock Trading Strategist
Stock Trading Alerts
