

Bitcoin might be expensive according to Vítor Constâncio, Vice President of the European Central Bank. In his interview with CNBC, we read:
Investors flocking into bitcoin are taking a risk by buying at such high prices, the vice president of the European Central Bank (ECB) Vitor Constancio told CNBC Wednesday.
"It's a very particular asset, it's a speculative asset by definition looking to the developments in its price. Investors are taking that risk of buying at such high prices," Constancio noted.
In just over the last year bitcoin has gone from under $1,000 to passing the $10,000 marker. Earlier in the week, the global cryptocurrency market broke through the $300 billion milestone, showing that the appetite for digital currencies is on the rise.
Constancio told CNBC that the price of bitcoin is likely to fluctuate more, but this is not set to hurt other markets in any way.
While right about the extent of the rally and possibly elevated Bitcoin prices, it is only an indication that Bitcoin might be relatively expensive. This doesn’t necessarily mean that it won’t go up further still. Remember Bitcoin at $2,000? Wasn’t it already expensive back then? How about at $5,000? $10,000? The point here is that the mere fact that something is historically expensive is not necessarily a sign that it will revert right away. Make no mistake, the current rally in Bitcoin seems overextended, particularly if we look at it from a longer time horizon. This suggests that we should tread very carefully but doesn’t mean that we won’t see more upside. This point of view is reflected in today’s alert.
For now, let’s focus on the charts.
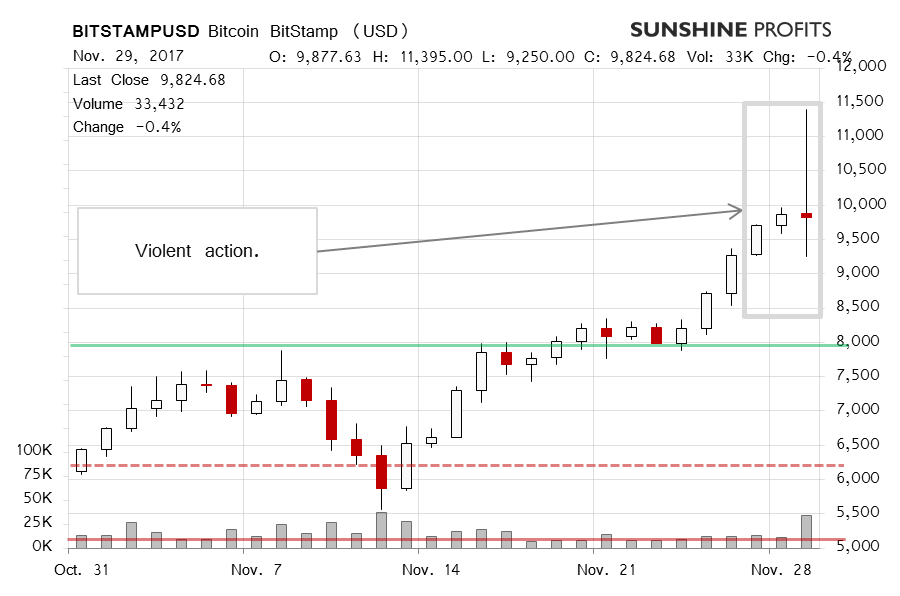
We saw a potentially very important day in the Bitcoin market yesterday with the currency going well above $11,000 and then retracing the whole move up and closing slightly down for the day. What might this mean for the Bitcoin market? Recall our previous comments:
The move up was confirmed and we saw a continuation. Right now, Bitcoin is creeping toward $10,000. Yes, the initial move was strong, but today’s action has been somewhat less pronounced. Also, we have to consider the fact that the volume has not been particularly strong but, at the same time, we’ve seen major moves to the upside starting on subdued volume.
A major move to the upside followed but the action itself was eerily reminiscent of a possible topping pattern. The volume was significant, far more pronounced than during the preceding days. Also, Bitcoin moved further up but the RSI actually declined. This was followed by volatile action today with Bitcoin going up and down in a relatively large range (tighter than yesterday’s trading but still, pretty volatile compared with what we saw in the earlier days). The volume today has also been significant (and the day is not over yet).
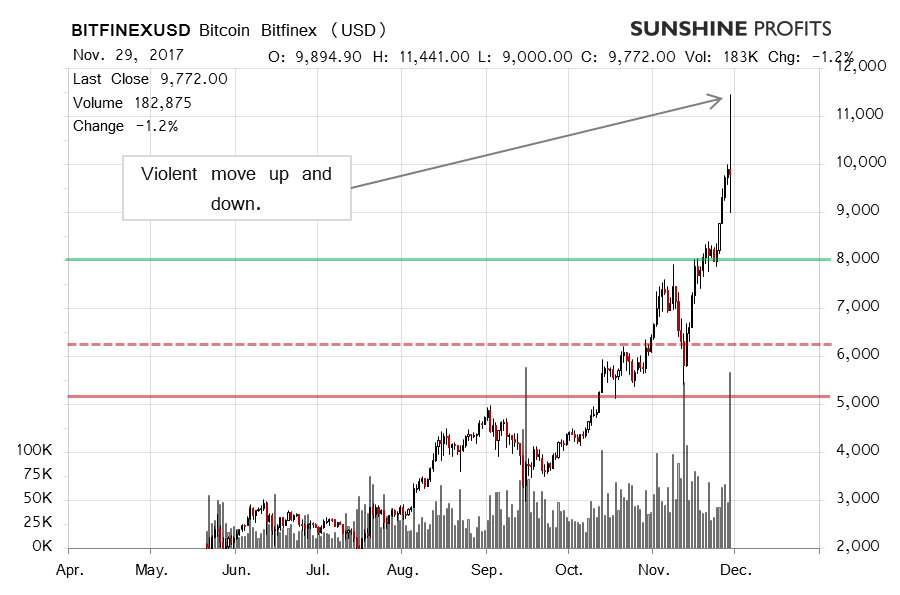
On the long-term Bitfinex chart, the move up $11,000 is very clearly visible. The psychological barrier of $10,000 was first breached and then Bitcoin came back below this level. If you recall our recent commentary:
(…) Bitcoin is around $9,500, after yet another all-time high above $9,700. This means we’re very close to the $10,000, which level might be important for psychological reasons. First of all, Bitcoin might encounter some resistance as traders might get the feeling that the move has exhausted itself. On the other hand, a confirmed move above $10,000 might be a very bullish event. Since we have not seen a decisive sign of weakness so far, the situation remains unchanged for the short-term, which mean bullish, in our opinion.
The situation became more bullish with Bitcoin above $10,000 but relatively quickly the currency withdrew to below $10,000. Today, we saw another attempt at $10,000 and it was unsuccessful as well. Taking this into account together with the extent of the recent rally, we sent a message to our subscribers in which we closed the hypothetical speculative long positions. The position was initialized on November 16, 2017 with Bitcoin at around $7,775 and closed today on November 30, 2017 with Bitcoin around $9,300. This means a hypothetical gain of 19.6% in roughly two weeks.
On the other side, both yesterday and today, Bitcoin tested the 38.2% Fibonacci retracement level based on the recent move up ($9,135) and failed to move below this level both times. This suggests that there might still be strength in the market. Consequently, Bitcoin seems to be in no man’s land at the moment but failure to break below the mentioned support in the next couple of days might serve as a bullish confirmation. This means we might reestablish hypothetical long positions if we don’t see weakness in the days to come. At the same time, the situation seems to risky to put on hypothetical longs just now.
If you have enjoyed the above analysis and would like to receive free follow-ups, we encourage you to sign up for our daily newsletter – it’s free and if you don’t like it, you can unsubscribe with just 2 clicks. If you sign up today, you’ll also get 7 days of free access to our premium daily Gold & Silver Trading Alerts. Sign me up!.
Thank you.
Regards,
Mike McAra
Bitcoin Trading Strategist
Bitcoin Trading Alerts
