

Oil Trading Alert originally sent to subscribers on April 11, 2016, 5:29 AM.
Trading position (short-term; our opinion): No positions are justified from the risk/reward perspective.
On Friday, crude oil extended gains as renewed hopes for output freeze in combination with the closure of the Keystone pipeline and Baker Hughes report supported the price. In this environment, light crude climbed to the barrier of $40, invalidating earlier breakdown under medium-term support/resistance line. What’s next for the commodity?
On Friday, Russia reported that its crude output fell in Apr, ahead of a meeting of major oil-producing countries in Doha. Additionally, Kuwait OPEC governor told that an OPEC-Non OPEC production freeze agreement could be completed even without cooperation from Iran, which renewed hopes for output freeze deal. On top of that, the closure of the Keystone pipeline cut 590,000 barrels per day from the market, which supported the price as well. Also on Friday, Baker Hughes reported that U.S. oil rigs fell by 8 last week to 354, which was the lowest level since Nov 2009. Thanks to these circumstances, light crude climbed to the barrier of $40, invalidating earlier breakdown under medium-term support/resistance line. What’s next for the commodity? Let’s examine charts and find out (charts courtesy of http://stockcharts.com).
Quoting our previous Oil Trading Alert:
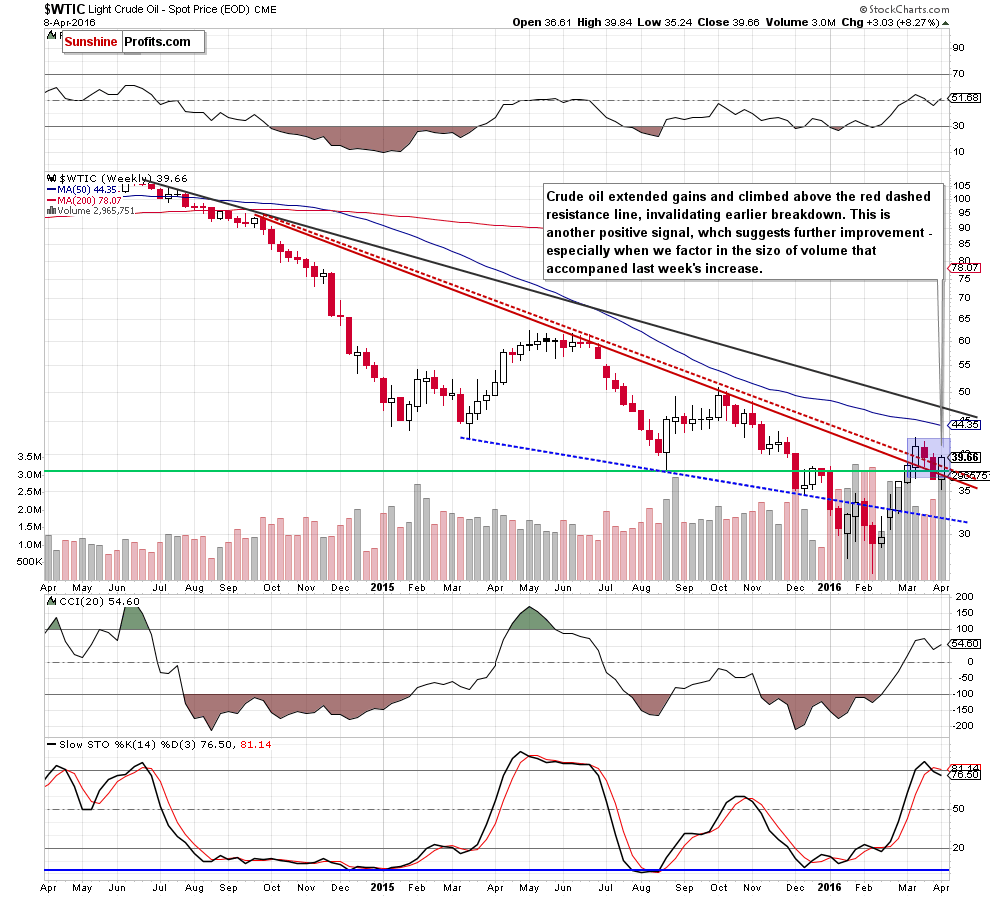
(…) although crude oil moved little lower yesterday, the commodity remains above the lower border of the blue consolidation and the red declining line, which means that invalidation of earlier breakdowns and its positive impact on light crude is still in effect, suggesting further improvement. However, such price action will be more likely and reliable if the commodity increases above the red dashed declining line (currently around $38.40).
From today’s point of view, we see that the situation developed in line with the above scenario and crude oil moved higher once again. Thanks to last week’s increase, the commodity climbed above the red dashed declining line, invalidating earlier breakdown. This is another positive signal, which suggests further improvement – especially when we take into account the size of volume that accompanied last week’s upswing.
Are there any factors that could encourage oil bears to act in the coming days? Let’s examine the daily chart and find out.
On Friday, we wrote the following:
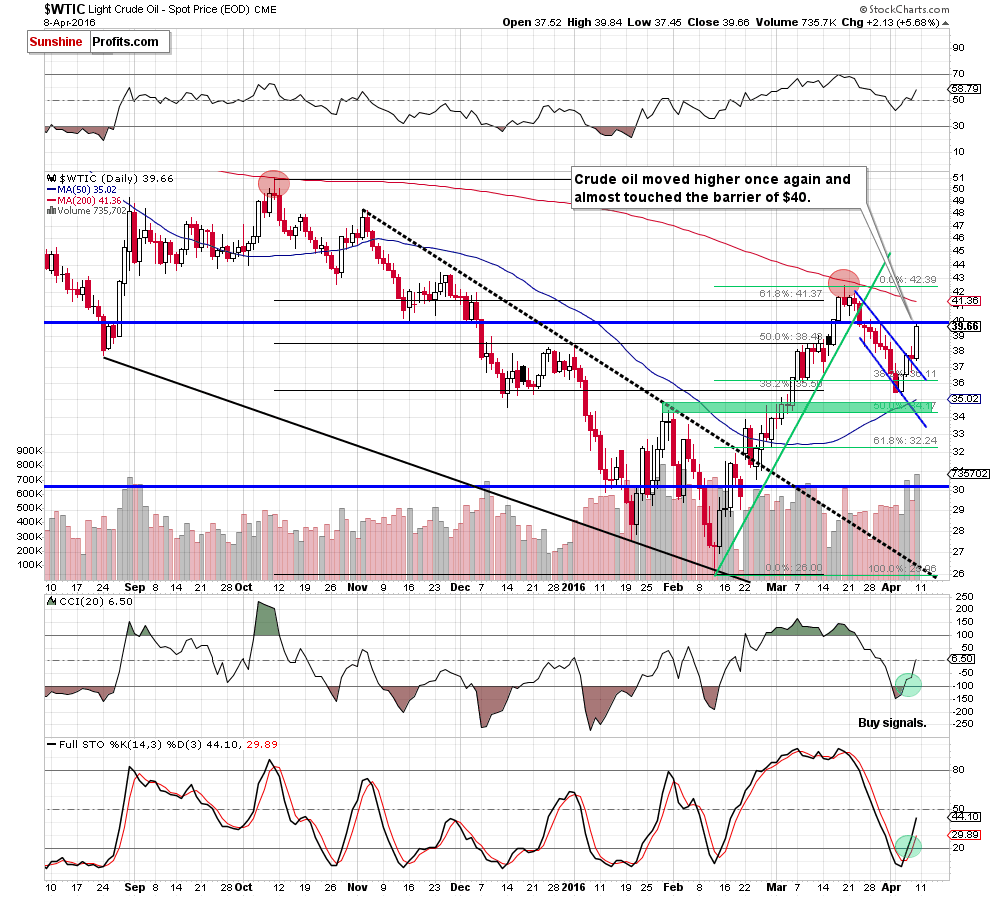
(…) shallow pullback encouraged oil bulls to act, which resulted in a rebound and a climb above the upper border of the blue declining trend channel. As a result, light crude climbed to the 38.2% Fibonacci retracement based on entire Mar-Apr decline, which resulted in a reversal and crude oil gave up some gains. Despite this fact, the commodity closed the day above the blue line, which suggests a verification of earlier breakout. If this is the case, light crude extends gains from here and the initial upside target would be around $38.86 (the 50% Fibonacci retracement based on entire Mar-Apr decline).
As you see on the daily chart, the situation developed in line with our Friday's assumptions and crude oil bounced off the upper border of the blue declining trend channel. With this increase light crude almost touched the barrier of $40 and closed the day slightly below it. What’s next? We think that oil bears may push the commodity little lower later today as the proximity to the psychologically important level of $40 will likely encourage some day traders to take profits off the table.
Nevertheless, even if we see such price action, we should keep in mind that Friday’s increase materialized on significant volume, which confirms oil bulls’ strength. Additionally, buy signals generated by the indicators are still in play, which in combination with the medium-term picture suggests further improvement in the coming days. If this is the case, and light crude increases once again, the initial upside target would be around $40.78-$40.94, where the resistance zone (created by the 76.4% and 78.6% Fibonacci retracement levels based on recent decline) is. At this point, it is worth noting that not far from this area is also the 200-day moving average, which could trigger another pullback later this week.
Summing up, crude oil extended gains invalidated earlier breakdown under the medium-term red dashed declining resistance line, which is another positive signal in previous days. Additionally, Friday’s (and also the last week’s) upward move materialized on significant volume, which suggests further improvement. However, with recent upswing, light crude also reached the barrier of $40, which could encourage oil bears to trigger a pullback from here in the coming day.
Very short-term outlook: mixed
Short-term outlook: mixed with bullish bias
MT outlook: mixed with bullish bias
LT outlook: mixed
Trading position (short-term; our opinion): No positions are justified from the risk/reward perspective. We will keep you – our subscribers – informed should anything change.
As a reminder – “initial target price” means exactly that – an “initial” one, it’s not a price level at which we suggest closing positions. If this becomes the case (like it did in the previous trade) we will refer to these levels as levels of exit orders (exactly as we’ve done previously). Stop-loss levels, however, are naturally not “initial”, but something that, in our opinion, might be entered as an order.
Since it is impossible to synchronize target prices and stop-loss levels for all the ETFs and ETNs with the main market that we provide this level for (crude oil), the stop-loss level and target price for popular ETN and ETF (among other: USO, DWTI, UWTI) are provided as supplementary, and not as “final”. This means that if a stop-loss or a target level is reached for any of the “additional instruments” (DWTI for instance), but not for the “main instrument” (crude oil in this case), we will view positions in both crude oil and DWTI as still open and the stop-loss for DWTI would have to be moved lower. On the other hand, if crude oil moves to a stop-loss level but DWTI doesn’t, then we will view both positions (in crude oil and DWTI) as closed. In other words, since it’s not possible to be 100% certain that each related instrument moves to a given level when the underlying instrument does, we can’t provide levels that would be binding. The levels that we do provide are our best estimate of the levels that will correspond to the levels in the underlying assets, but it will be the underlying assets that one will need to focus on regarding the sings pointing to closing a given position or keeping it open. We might adjust the levels in the “additional instruments” without adjusting the levels in the “main instruments”, which will simply mean that we have improved our estimation of these levels, not that we changed our outlook on the markets.
Thank you.
Nadia Simmons
Forex & Oil Trading Strategist
Przemyslaw Radomski, CFA
Founder, Editor-in-chief
Gold & Silver Trading Alerts
Forex Trading Alerts
Oil Investment Updates
Oil Trading Alerts
