

Oil Trading Alert originally sent to subscribers on December 30, 2015, 9:19 AM.
Trading position (short-term; our opinion): Short positions (with a stop-loss order at $39.12 and an initial downside target at $33.66) are justified from the risk/reward perspective.
Although crude oil moved higher yesterday, the key resistance lines continues to keep gains in check. What does it mean for the commodity? Will the oil-to-gold ratio give us more clues about future moves?
Let’s examine charts and find out (charts courtesy of http://stockcharts.com).
Quoting our previous Oil Trading Alert:
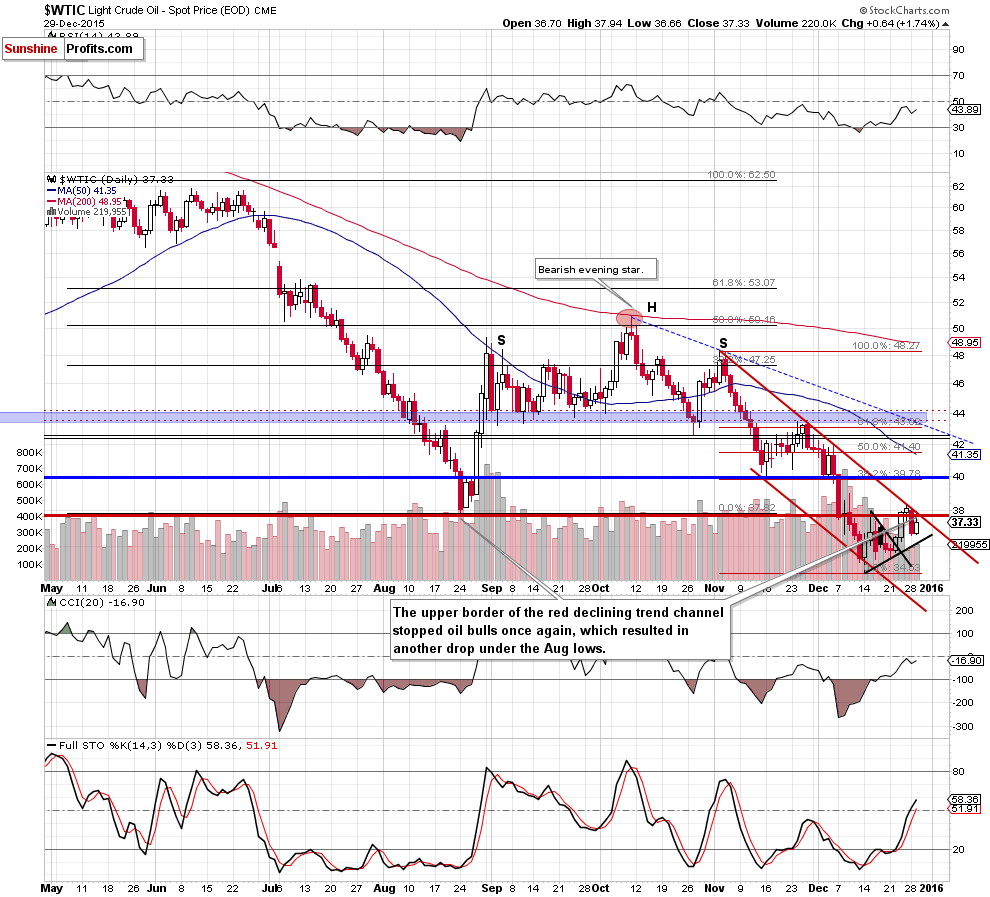
(…) we would like to draw your attention to buy signals generated by the daily indicators, which suggests that another test of the Aug low and the strength of the upper line of the red declining trend channel can’t be ruled out.
Looking at the charts, we see that the situation developed in line with the above scenario and oil bulls pushed the commodity to our upside targets. Despite this improvement, the key resistance area created by the Aug low and the upper line of the red declining trend channel withstood the buying pressure and triggered a pullback. This means that as long as there is no breakout above this zone lower values of the commodity are more likely than not. Therefore, if light crude extends losses from here, we’ll see drop to (at least) the black support line base on the recent lows in the coming days. If it is broken, a way to $35.35 (and then to Dec low) will be open.
Are there any other technical factors that could encourage oil bears to act? Let’s take a closer look at the oil-to-gold ratio and find out.
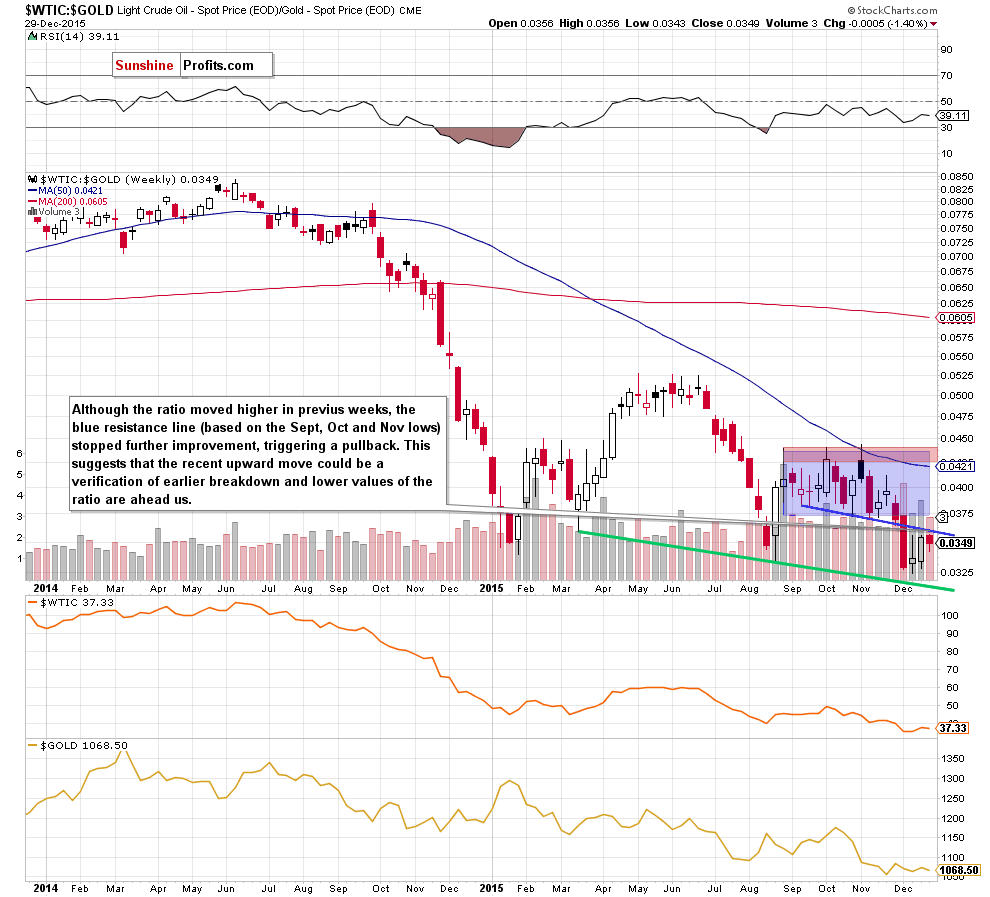
On the above chart, we see that the ratio rebounded in previous weeks, which resulted in an increase to the previously-broken blue line based on the Sept, Oct and Nov lows. As you see, this resistance stopped further improvement, triggering a pullback. In our opinion, such price action suggests that the recent upward move could be a verification of earlier breakdown. If this is the case, the ratio will extend declines from here, which will translate to lower values of light crude in the coming week(s).
At this point, probably many of you will ask: What about gold? Taking into account the fact that the recent upward move in the ratio has corresponded to increases in gold, we think that further deterioration in the ratio will weaken the price of the commodity. Nevertheless, if you want to have a more complete picture of gold (and the precious metal sector) we encourage you to sign up for Gold & Silver Trading Alerts or the All-Inclusive Package that includes it.
Summing up, crude oil moved higher, but the resistance zone created by the Aug low and the upper border of the declining trend channel stopped oil bulls, which suggests lower values of the commodity in the coming days. Consequently, in our opinion, the medium-term trend remains down and further deterioration is just around the corner. Therefore, short positions (with a stop-loss order at $39.12 and an initial downside target at $33.66) are justified from the risk/reward perspective.
Very short-term outlook: berish
Short-term outlook: bearish
MT outlook: bearish
LT outlook: mixed with bearish bias
Trading position (short-term; our opinion): Short positions (with a stop-loss order at $39.12 and an initial downside target at $33.66) are justified from the risk/reward perspective. We will keep you – our subscribers – informed should anything change.
Thank you.
Nadia Simmons
Forex & Oil Trading Strategist
Przemyslaw Radomski, CFA
Founder, Editor-in-chief
Gold & Silver Trading Alerts
Forex Trading Alerts
Oil Investment Updates
Oil Trading Alerts
