

Oil Trading Alert originally sent to subscribers on September 21, 2015, 9:09 AM.
Trading position (short-term; our opinion): Short positions with a stop-loss order at $54.12 and initial (!) target price at $35.72 are justified from the risk/reward perspective.
On Friday, crude oil declined and lost 3.37% as concerns over the U.S. economy and energy demand weighed on investors’ sentiment. A stronger U.S. dollar pushed the commodity lower as well. Thanks to these circumstances, light crude slipped under the 50-day moving average, invalidating earlier breakout. What does it mean for the commodity?
On Friday, crude oil extended Thursday’s drop as the Fed’s decision to keep interest rates unchanged raised worries over the health of the economy and added to concerns that a global supply glut may exist longer than expected. Additionally, the USD Index bounced off the session low and erased almost all Thursday’s drop, making crude oil more expensive for buyers holding other currencies. What’s interesting, the Baker Hughes report, which showed a third straight weekly decline in active U.S. oil drilling rigs, failed to help. In this environment, crude oil moved lower, invalidating earlier breakout above the 50-day moving average. What’s next for the commodity? (charts courtesy of http://stockcharts.com).
Quoting our Friday’s commentary:
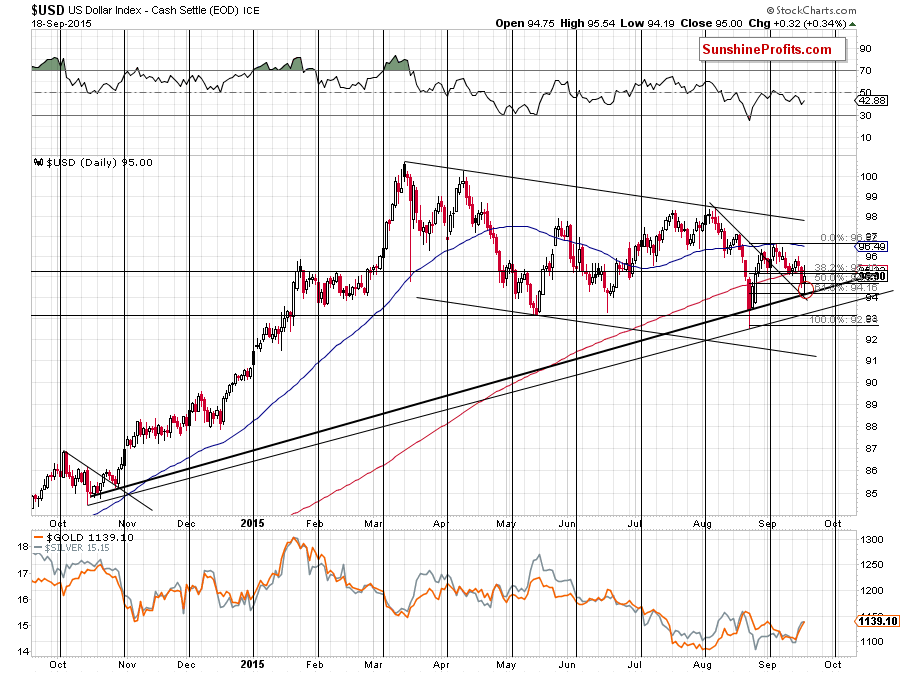
(…) the greenback slipped to the 50% Fibonacci retracement, but earlier today the index moved lower and approached a solid support zone (slightly above 94) created by the declining support line, the 61.8% Fibonacci retracement and the medium-term rising support line based on the daily closing prices (…) Therefore, we think that (…) reversal is just around the corner. If we see such action, it would a bearish sign for crude oil and we’ll see lower values of the commodity.
Looking at the daily chart of the USD Index, we see that the situation developed in line with the above scenario and the greenback bounced off the solid support zone, invalidating earlier breakdown under the 50% Fibonacci retracement. This is a positive signal, which suggests further improvement in the U.S. currency (and lower values of light crude) in the coming days.
Having said that, let’s check what impact this increase had on the technical picture of crude oil.
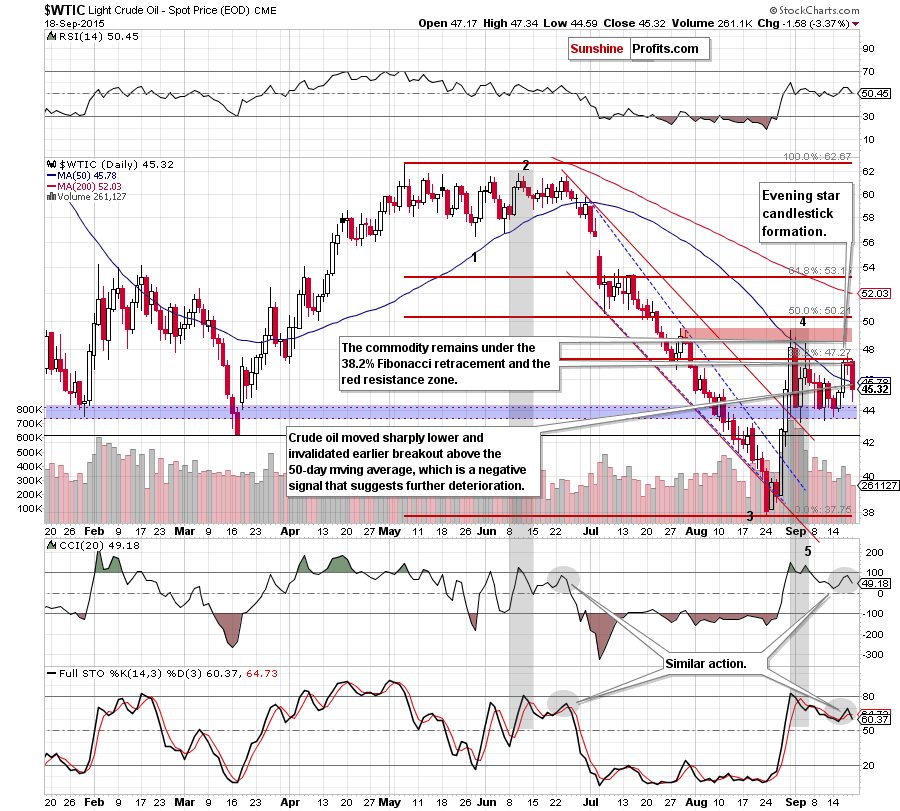
On the daily chart, we see that Friday’s increase in the USD Index in combination with Thursday’s invalidation of small breakout above the 38.2% Fibonacci retracement triggered a decline, which took light crude below the previously-broken 50-day moving average. In this way, crude oil invalidated earlier breakout, which is a negative signal. Additionally, recent candlesticks formed an evening star on the daily chart, which suggests that further deterioration is just a matter of time.
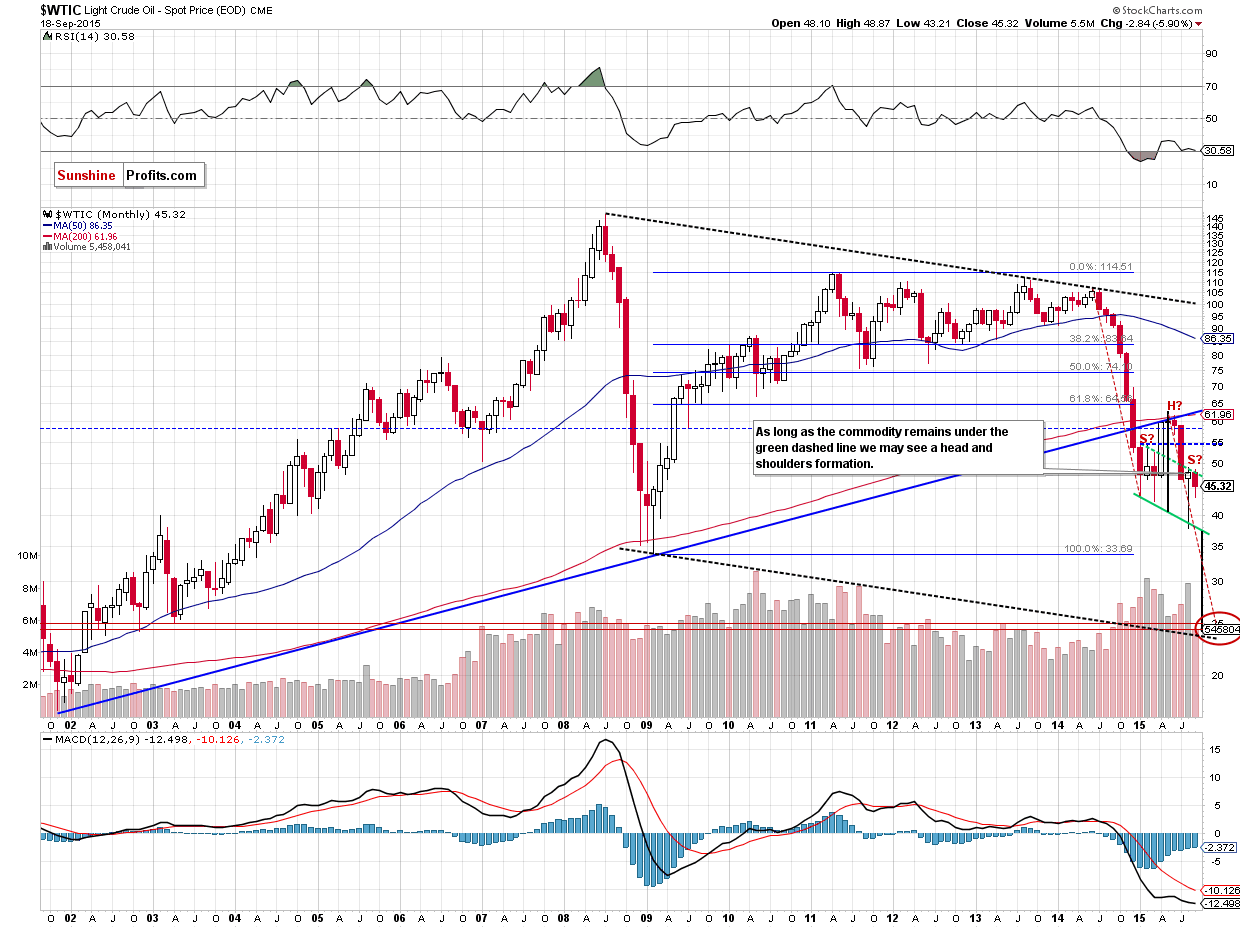
On top of that, the commodity remains under the green dashed line (marked on the monthly chart), which means that the probability of the bearish head and shoulders formation (and a significant profit potential on the current trade) is still very high.
Finishing today’s alert, we would like to draw your attention to the crude oil-to-oil stocks ratio (if you want to know more interesting ratios, we encourage you to sign up for Oil Investment Updates or the Fundamental Package that includes it).
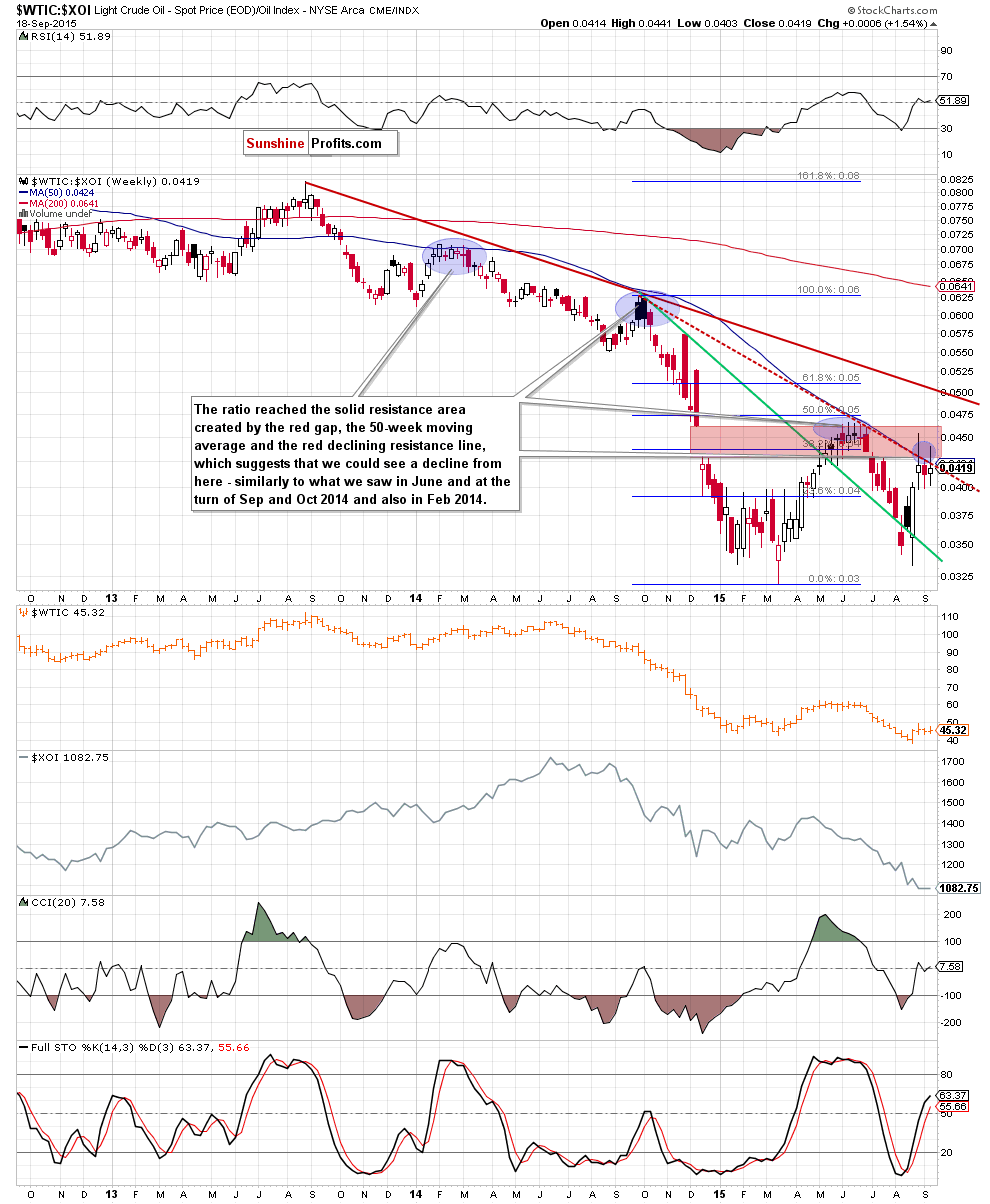
Looking at the above chart, we see that the ratio came back to the key resistance area created by the red gap, the 38.2% Fibonacci retracement (based on the Oct-Mar declines), the red dashed declining resistance line (based on the Oct and Jun highs) and the 50-week moving average.
As you see on the chart, in previous months, the 50-week moving average was strong enough to stop further improvement and trigger a sizable downward move, which suggests that we could see similar price action in near future – especially when we take into account all the above-mentioned bearish factors.
What does it mean for crude oil? Based on price action that we have seen in the past, we think that lower values of the ratio are just around the corner. If this is the case, and the ratio declines from here, such price action will likely translate to a pullback in light crude – similarly to what we saw in June, at the turn of Sep and Oct and also in Feb 2014.
Summing up, crude oil moved lower once again and invalidated earlier breakout above the 50-day moving average, creating a bearish evening star candlestick formation on the daily chart. This means that the outlook for crude oil remains bearish and it will most likely remain the case at least as long as crude oil remains below the August high. Therefore, we believe that short positions (which are already profitable as we entered them when crude oil was at about $46.68) continue to be justified from the risk/reward point of view.
Very short-term outlook: bearish
Short-term outlook: bearish
MT outlook: bearish
LT outlook: mixed with bearish bias
Trading position (short-term; our opinion): Short positions with a stop-loss order at $54.12 (yes, that far as the medium-term outlook is unlikely to change as long as crude oil stays below the declining medium-term resistance line) and initial (!) target price at $35.72 are justified from the risk/reward perspective. We will keep you – our subscribers – informed should anything change.
Thank you.
Nadia Simmons
Forex & Oil Trading Strategist
Przemyslaw Radomski, CFA
Founder, Editor-in-chief
Gold & Silver Trading Alerts
Forex Trading Alerts
Oil Investment Updates
Oil Trading Alerts
