
Oil Trading Alert originally sent to subscribers on February 4, 2014, 10:50 AM.
Trading position (short-term): In our opinion no positions are justified from the risk/reward perspective.
On Monday, crude oil lost 0.84% as weaker-than-expected U.S. and Chinese economic data fueled concerns over crude oil demand. Thanks to this news, light crude closed the day below $97 for the first time since Jan.27.
Data released over the weekend showed that China’s Manufacturing Purchasing Managers' Index dropped to a six-month low, falling to 50.5 in January from 51.0 in December. This weaker-than-expected numbers raised questions about economic growth in the world's second largest oil consumer (after the U.S.) and weighted on the price of light crude.
On top of that, yesterday’s data showed that U.S. manufacturing PMI dropped to 53.7 in January (from December's 55.0). Additionally, the Institute for Supply Management said that its manufacturing purchasing managers index fell to 51.3 in January (a seven-month low), while analysts expected the index to moved down to 56.4. The above data added to recent worries about weakness in emerging markets and fueled concerns over crude oil demand sending crude oil below $97.
Having discussed the above, let’s move on to the technical changes in the crude oil market (charts courtesy of http://stockcharts.com.)
In our last Oil Trading Alert, we wrote:
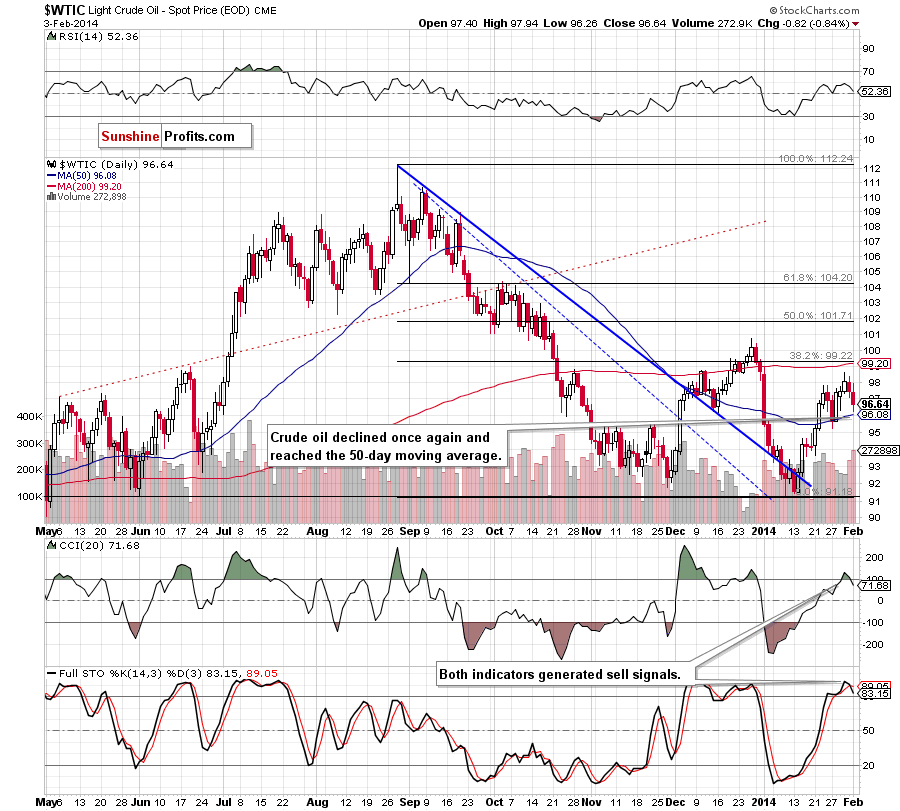
(…) crude oil extended its decline and (…) slipped below the previous high, which is not a positive signal – especially when we take into account the fact that Friday’s drop materialized on relatively large volume. On top of that, the CCI and Stochastic Oscillator are overbought and close to generating sell signals. Connecting the dots, it seems that a bigger pullback is just around the corner.
As you see on the above chart, crude oil extended losses and approached the 50-day moving once again. If this strong support encourages buyers to push the order button, we will likely see a corrective upswing in the coming days. However, if it is broken, we will see further deterioration and the next downside target will be the Jan.27 low at $95.21. At this point it’s worth noting that yesterday’s downswing materialized on large volume, which confirms the strength of the sellers. Additionally, the CCI and Stochastic Oscillator generated sell signal, which supports the latter scenario.
Having discussed the current situation in light crude, let’s take a look at WTI Crude Oil (the CFD).
Quoting our last Oil Trading Alert:
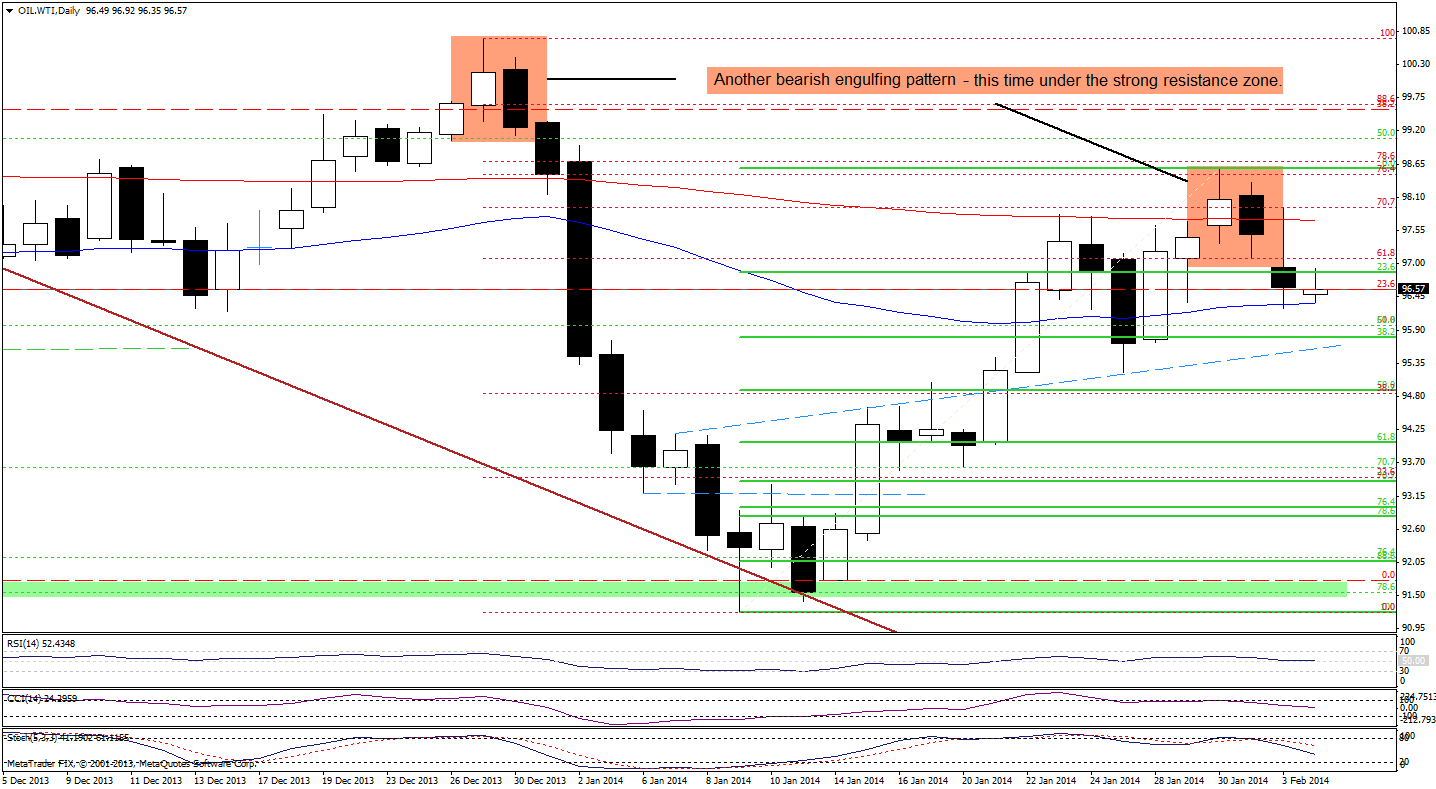
(…) the CFD formed a bearish engulfing pattern (…) such candlestick formation triggered a strong sell off at the end of December. From this perspective, it seems that if oil bulls do not manage to invalidate this bearish pattern, we may see similar price action in the coming days (…) the CCI and Stochastic Oscillator generated sell signals, which is another bearish sign (we saw similar situation in previous months and back then it had a negative impact on the price). Please note that the nearest support is the 50-day moving average (currently around $96.37), which corresponds to the Jan.29 low.
Looking at the above chart, we see that WTI Crude Oil extended its decline, dropped below the 23.6% Fibonacci retracement level and reached the 50-day moving average. As you see on the daily chart, this strong support encouraged oil bulls to act and triggered a small (at least at the moment when these words are written) corrective upswing earlier today. Despite this growth, the CFD still remains below the previously-broken 200-day moving average, which serves as resistance. Additionally, sell signals remain in play supporting the bearish case.
At this point, we should consider two scenarios. On one hand, as long as the CFD remains above the 50-day moving average, further declines are limited and we may see another attempt to move higher (even to the 200-day moving average). On the other hand, we should keep in mind that oil bears have more favorable factors on their side and if the 50-day moving average is broken, we will see a drop to (at least) the 38.2% Fibonacci retracement level based on the recent rally.
Summing up, the situation has deteriorated as the CCI and Stochastic Oscillator generated sell signals and crude oil declined (on large volume) to the 50-day moving average. As mentioned earlier, if this strong support encourages oil bulls to act, we will likely see a corrective upswing in the coming day (or days). However, if it is broken, we will see further deterioration and the next downside target will be the Jan.27 low at $95.21. Please note that the current situation in the CFD is similar to what we noticed in the case of light crude, and WTI Crude Oil doesn’t give us any particular clues about future’s moves in crude oil. Nevertheless, in both cases oil bears have more favorable factors on their side and it seems that further deterioration is just around the corner.
Very short-term outlook: mixed
Short-term outlook: bullish
MT outlook: bullish
LT outlook: mixed
Trading position (short-term): xxx
Thank you.
Nadia Simmons
Forex & Oil Trading Strategist
Forex Trading Alerts
Oil Investment Updates
Oil Trading Alerts
