
Visit our archives for more gold articles.
Recently, the Reserve Bank of India has imposed restrictions on import of gold. The government has also increased the import duty on gold to 8 per cent to discourage further purchase of gold. Did it do enough to stop the buyers?
The prices of gold maintain an upward march on increased buying by stockists and jewelers to meet the festive and marriage season demand amid a firm global trend.
In the global market, which normally sets the price trend on the domestic front, gold has risen to over $1,333 per ounce and reached its highest level since July 31. On the domestic front, we have seen similar price action where gold climbed up to over Rs 81,000 per ounce.
Another bullish factor supporting the upsurge is speculation that the demand will increase amid signs of a pickup in the Chinese economy, the world's second-biggest consumer of the metal.
What impact have these circumstances had on the gold's chart? Where are the nearest support zones and resistance levels? Let's take a closer look at the charts and find out what's the current outlook for gold priced in rupees.
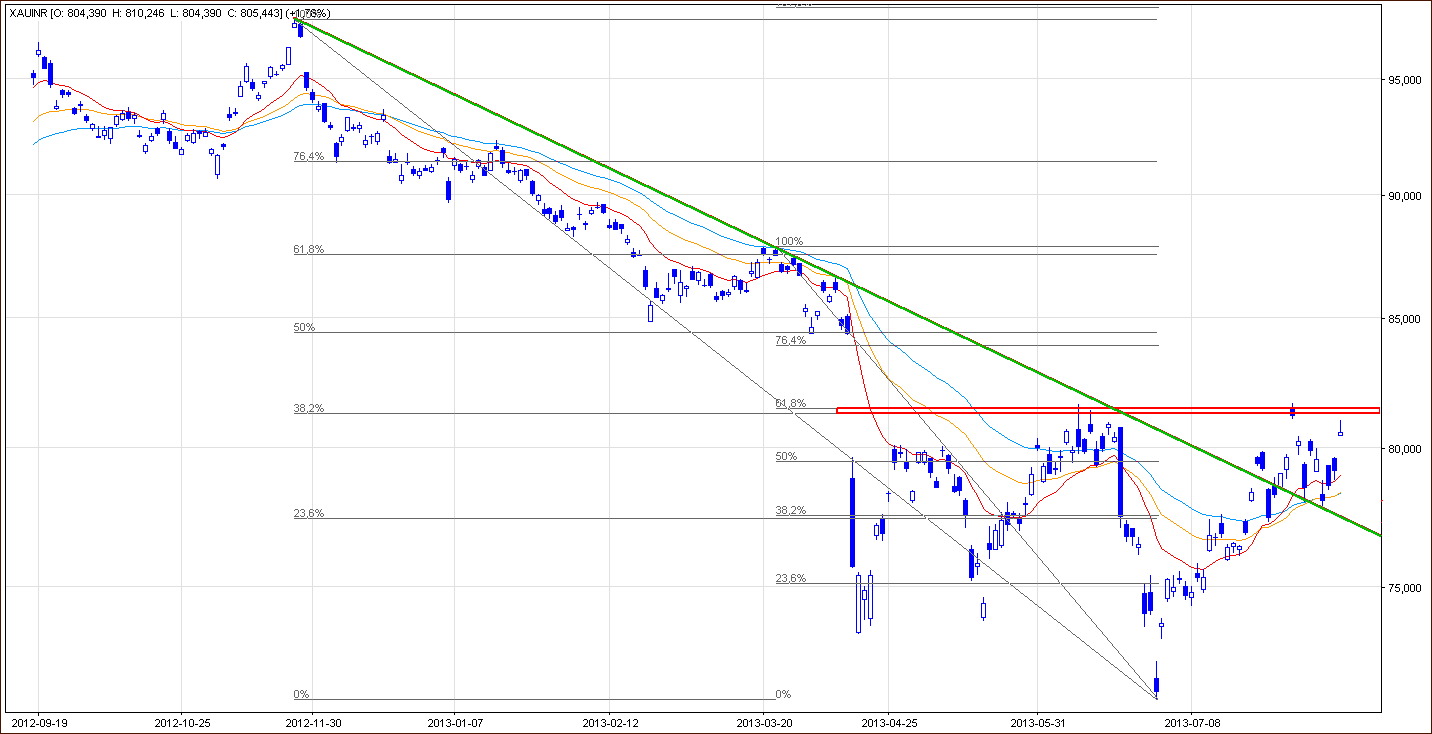
Let's take the same chart and zoom in a little bit to see the current situation more clearly.
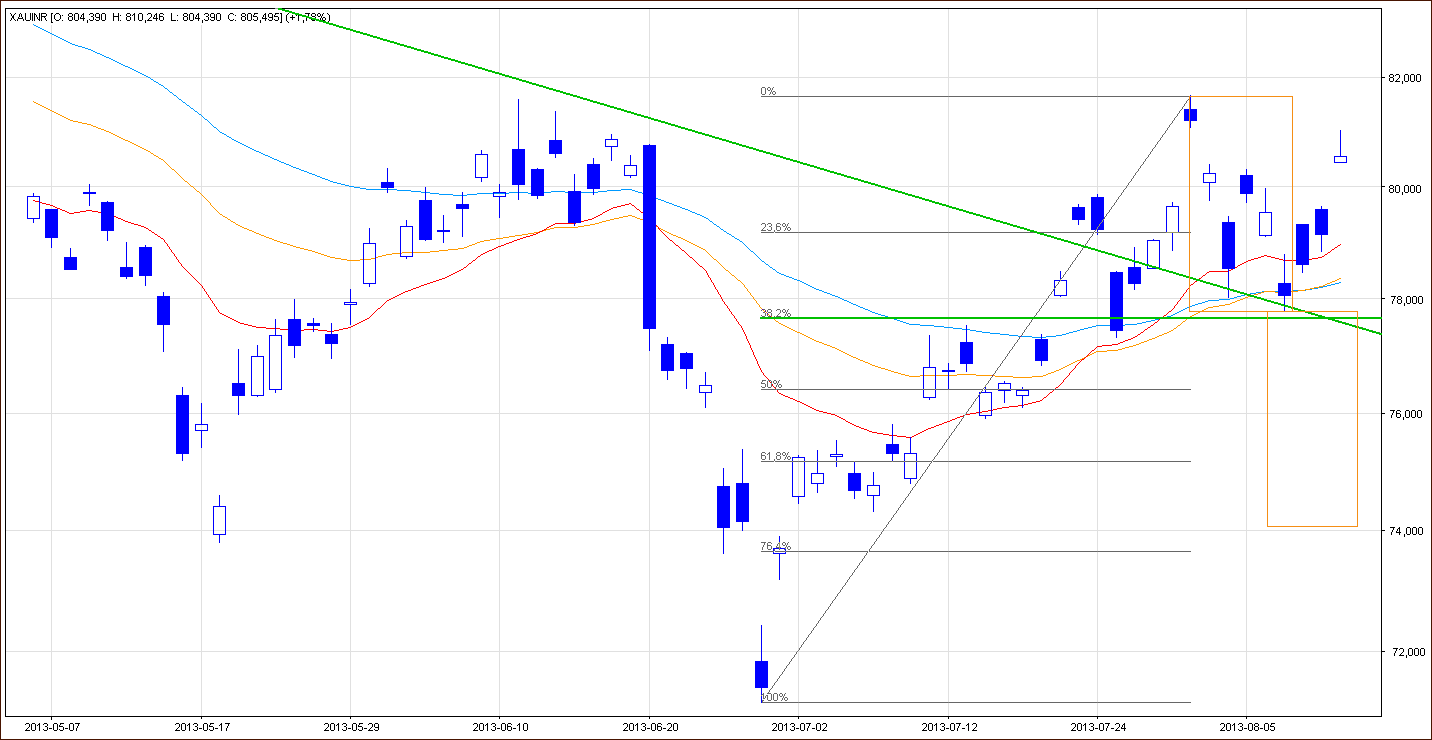
On the above chart we see that the situation has improved during past week. Last Wednesday, the price stopped at a strong support zone based on the previously-broken declining downtrend line and the 32.8% Fibonacci retracement level.
This convenient position encouraged gold bulls to take control. In the following days, buyers tried to push the price higher but the psychological barrier of Rs 80,000 slowed further growth. However, today after a higher open the yellow metal edged up and reached over Rs 81,000 per ounce. In this way, gold is still trading above this psychological barrier.
Will this improvement last long? What's next?
If the buyers manage to push the prices higher, we might see a bullish scenario: further growth at least to the June top at Rs 81,670. Please note that the next resistance is at the Rs 84,298 level where the April's low is. Slightly above this level is also the 127.2% Fibonacci extension level, which, together with the above-mentioned bottom, forms a strong resistance zone.
At this point, itâs worth mentioning that all three moving averages still serve as support.
If the bulls fail, we should prepare for a bearish scenario. In this case, if the price of gold drops below the recent decline's low, we may see a bearish double top formation. According to theory, the price target for the pattern is slightly above the Rs 74,000 level. However, before the sellers shall be able to make the decline happen, they will have to break below several support levels. The first one is the 50% Fibonacci retracement level. The second one is around the Rs 76,000 level and the next one is the 61.8% Fibonacci retracement level.
If you'd like to stay up-to-date with our latest free commentaries regarding gold, silver and related markets, please sign up today.
Thank you.
Nadia Simmons
Back