

Although GBP/USD increased a bit recently, the resistance area created by the mid-October highs continues to keep gains in check. What’s next for the exchange rate?
EUR/USD
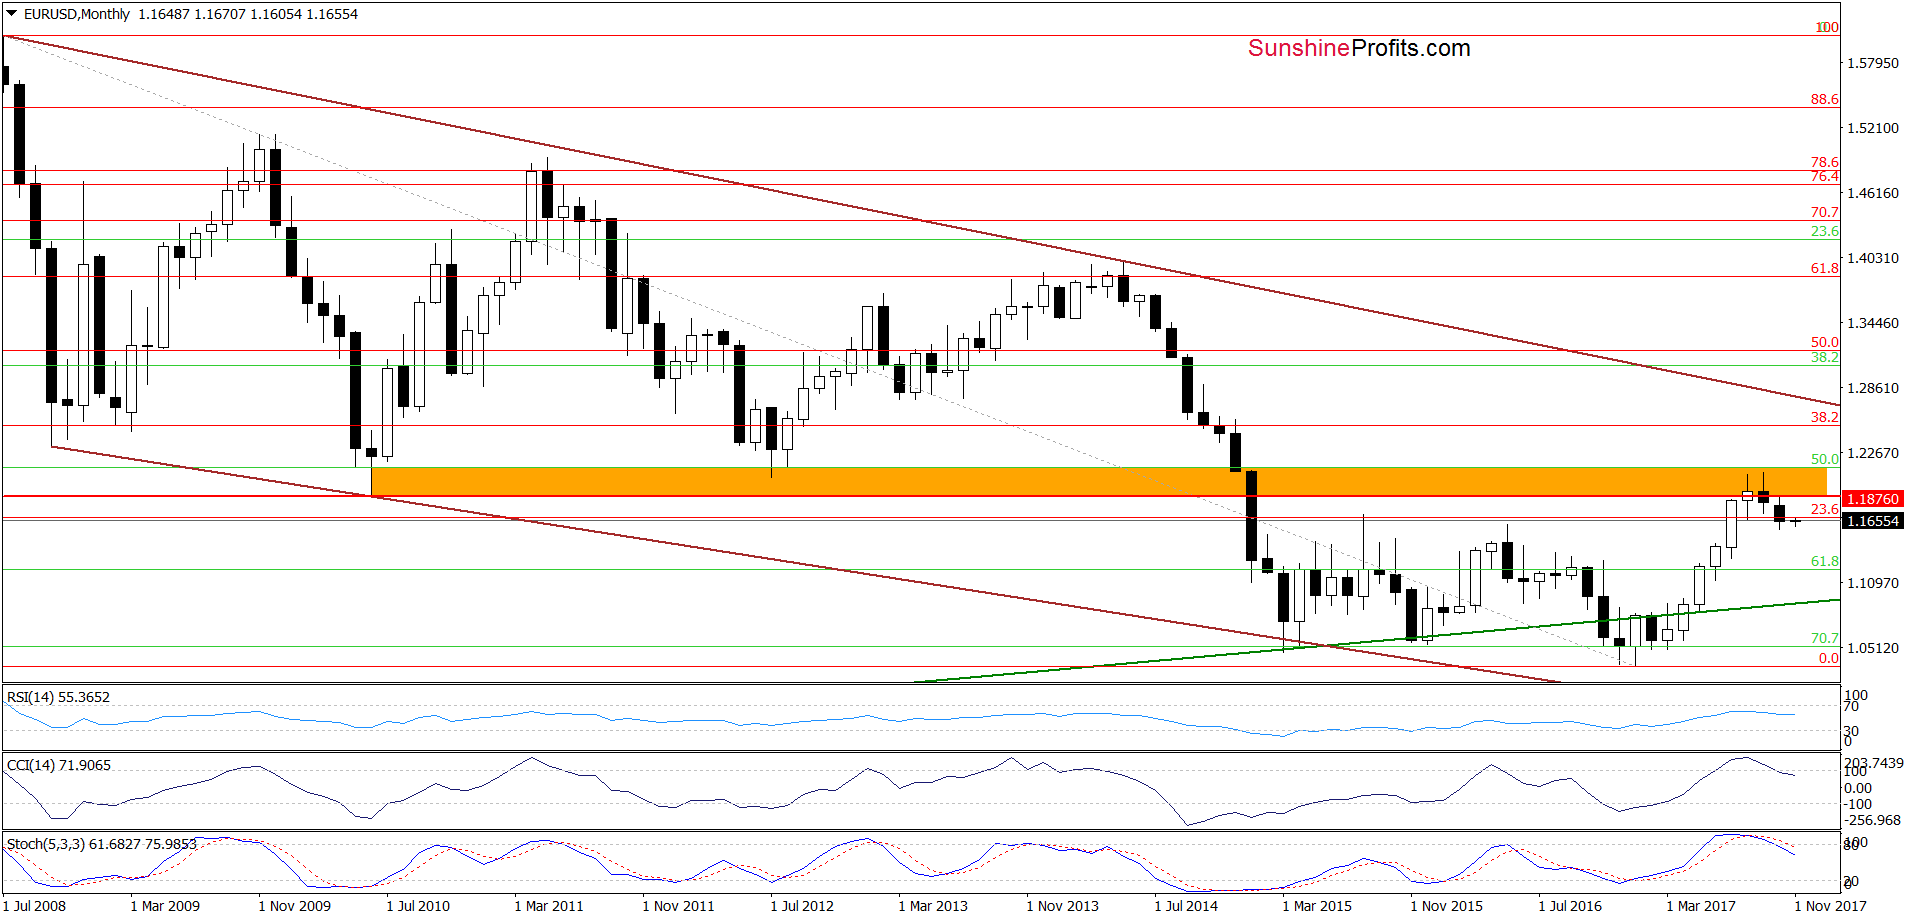
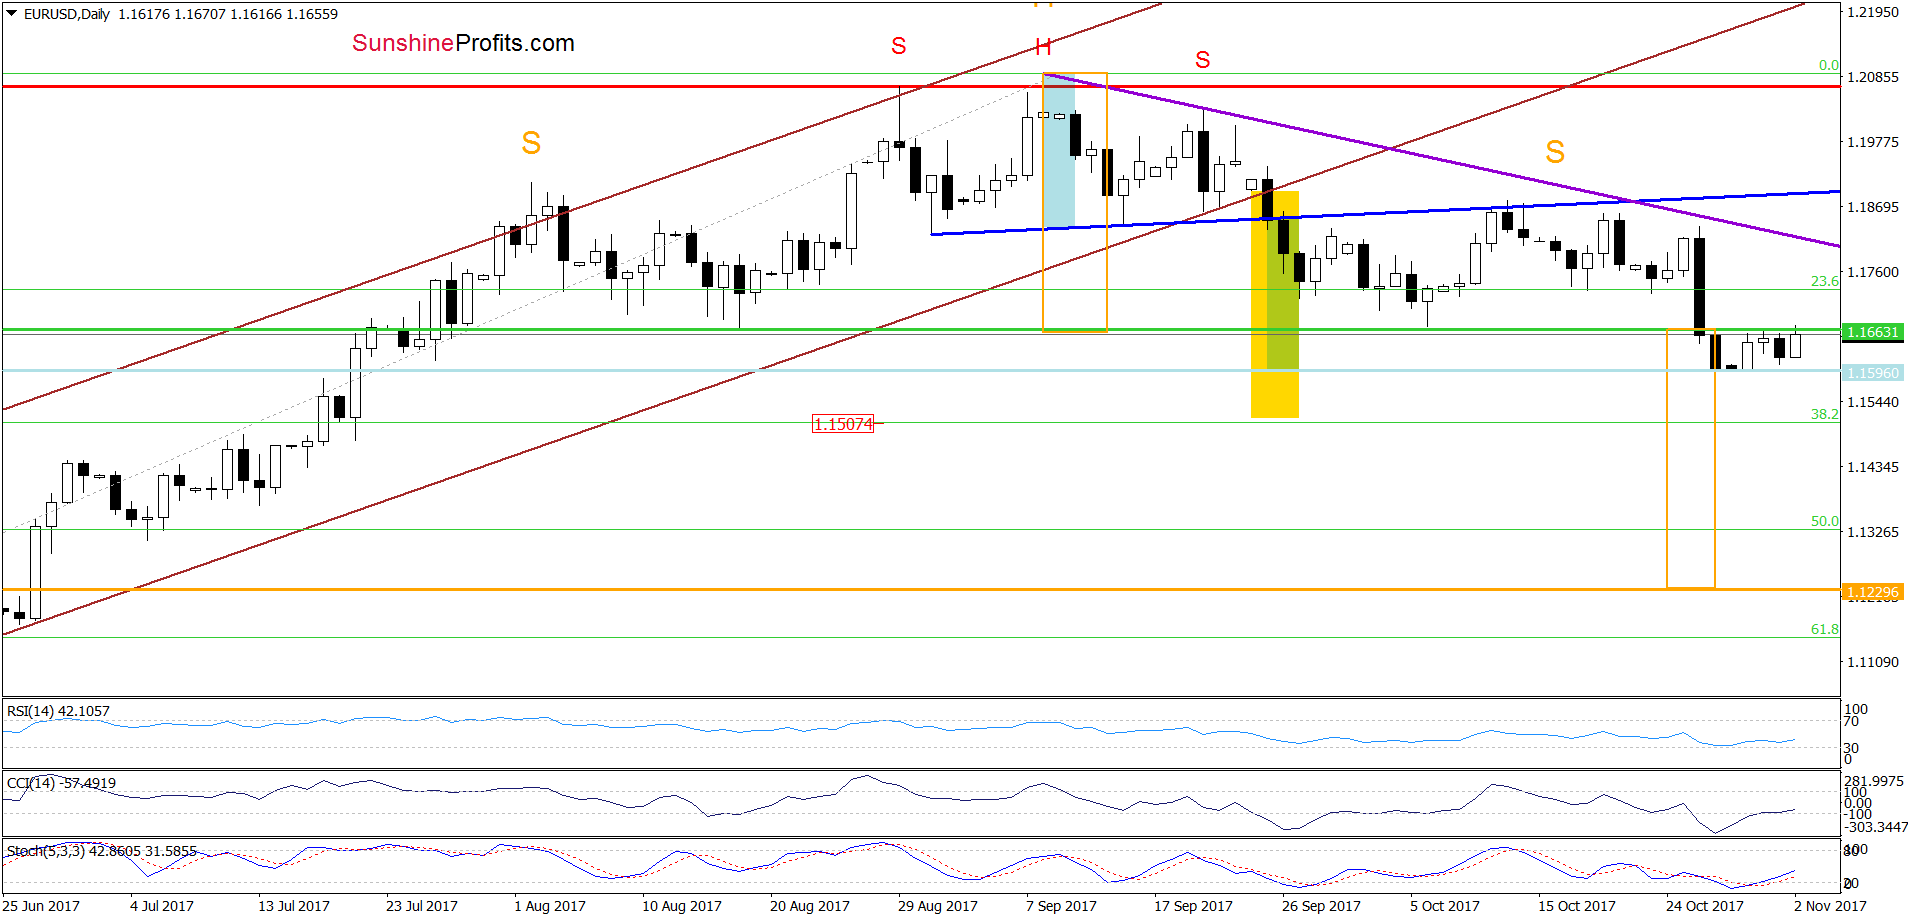
In our Forex Trading Alert posted on September 25, we wrote the following:
(…) we clearly see a potential head and shoulders formation. Therefore, if EUR/USD declines under the neck line of the pattern (the blue support line based on the previous lows), we’ll see a downward move to around 1.1596, where the size of the move will correspond to the height of the formation.
From today’s point of view, we see that currency bears realized the above-mentioned scenario on Friday, which somewhat reduced the selling pressure and resulted in a rebound in the following days.
Despite the recent increase, the green horizontal line based on the mid-August and early October lows continues to keep gains in check. This suggests that as long as there is no daily closure above this resistance all upswings could be nothing more than verifications of the earlier breakdown below this line.
What does it mean for the exchange rate? In our opinion, if this is the case and EUR/USD reverses from current levels in the near future, currency bears will likely not only test the recent lows, but also push the exchange rate to around 1.1508, where the size of declines will be equal to the height of the brown rising trend channel. Additionally, slightly below this level is also the 38.2% Fibonacci retracement, which increases the probability of reversal.
Very short-term outlook: mixed with bearish bias
Short-term outlook: bearish
MT outlook: mixed
LT outlook: mixed
GBP/USD
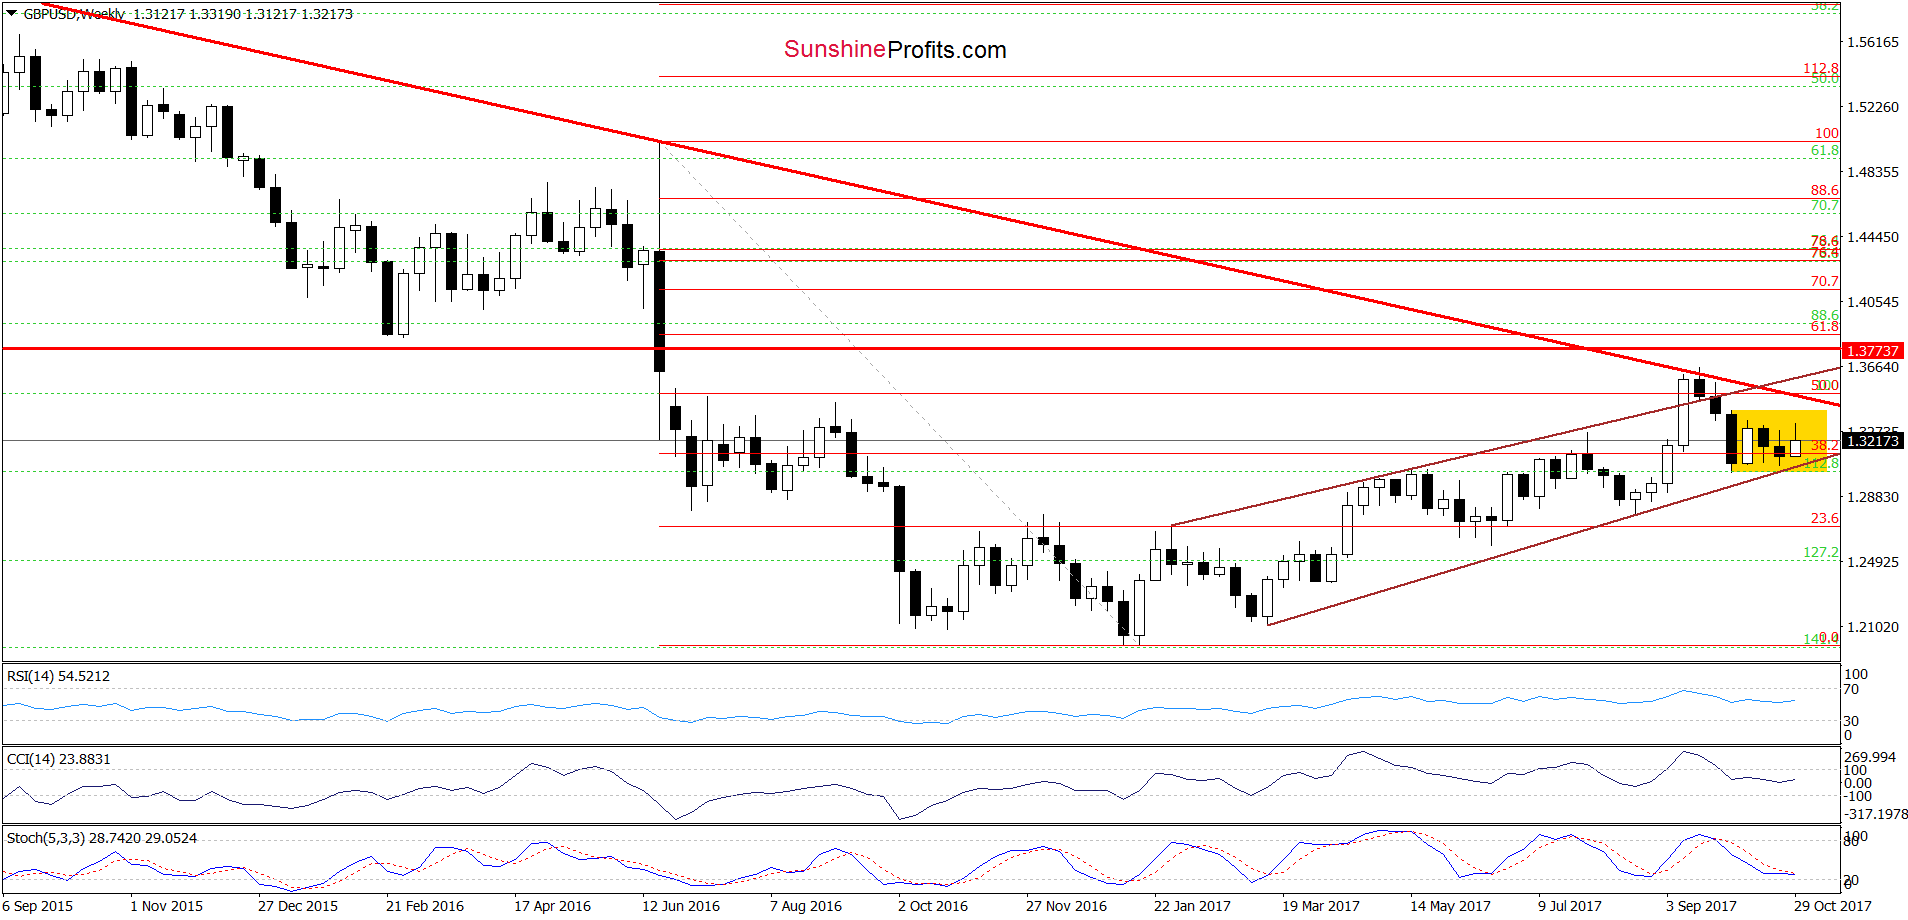
Looking at the weekly chart, we see that the overall situation in the medium term hasn’t changed much as GBP/USD is trading in the yellow consolidation inside the brown rising trend channel, which makes the broader perspective a bit unclear.
Will the daily chart give us more clues about future moves? Let’s check.
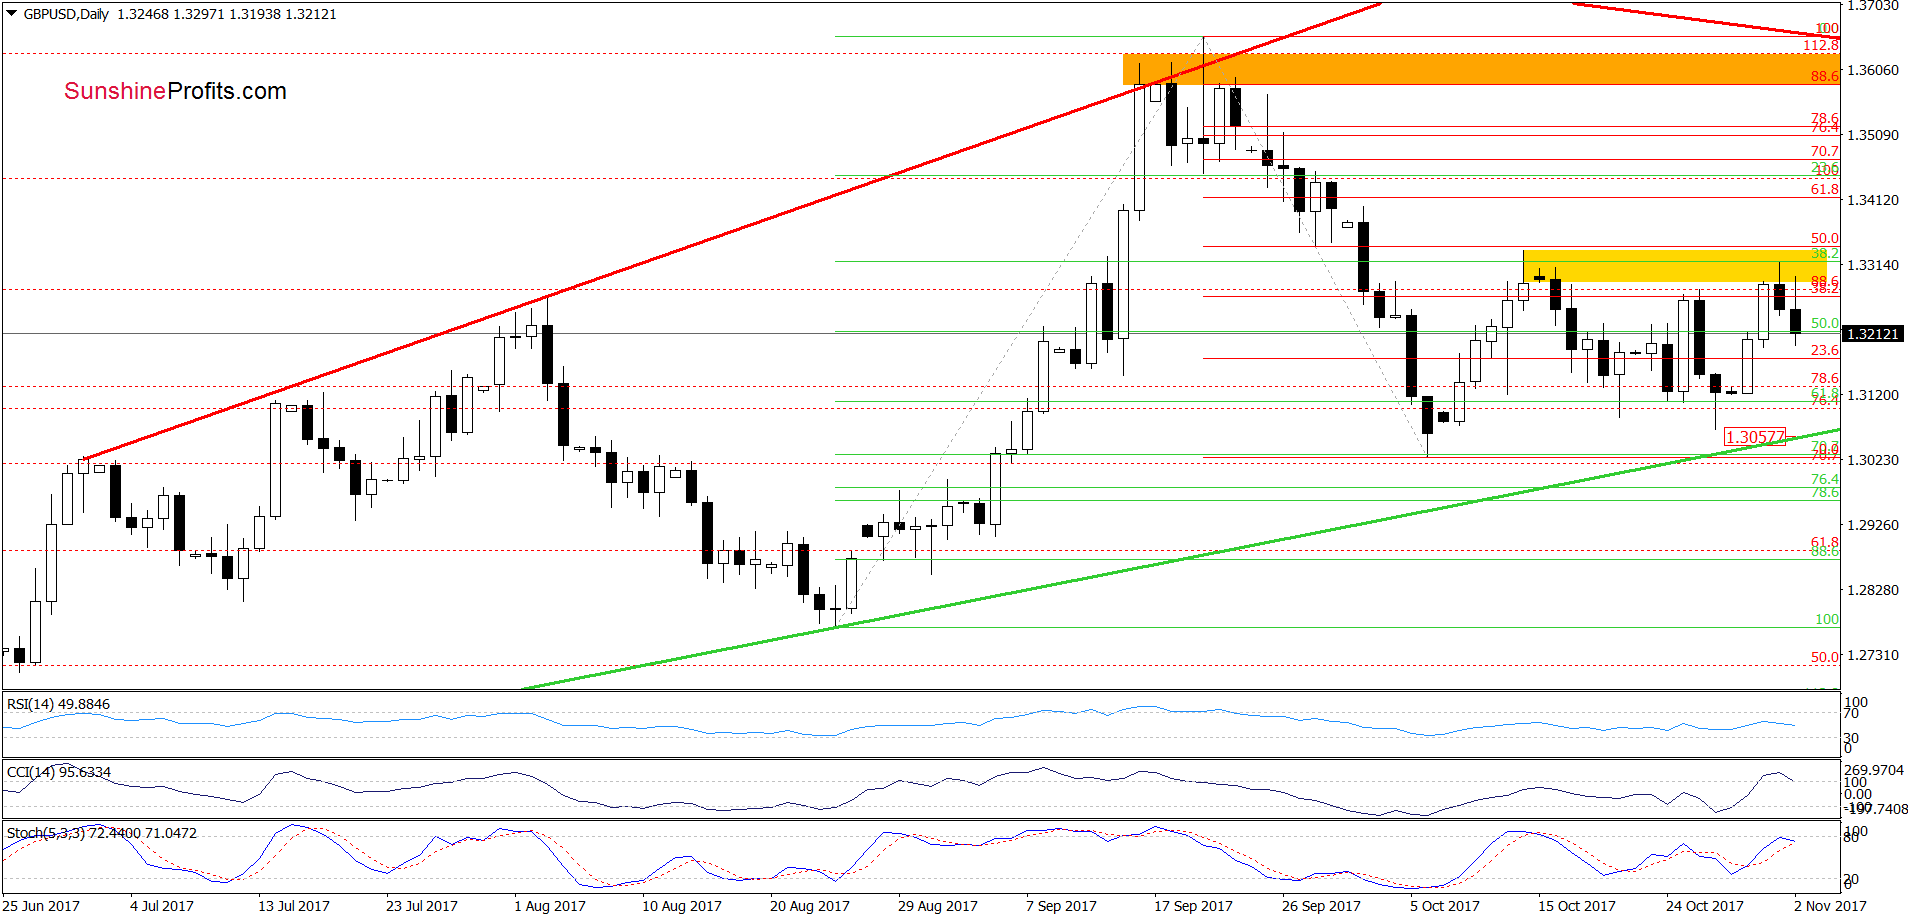
From the daily perspective, we see that although GBP/USD rebounded recently, the yellow resistance zone based on the 50% Fibonacci retracement and the previous highs stopped currency bulls, triggering a pullback.
Additionally, the CCI generated the sell signal, while the Stochastic Oscillator is very close to doing the same, which suggests that we’ll likely see a decline to the lower border of the brown rising trend channel (marked on the weekly chart) and the October lows in the coming days. Taking all the above into account, we believe that our profitable short positions continue to be justified from the risk/reward perspective.
Very short-term outlook: bearish
Short-term outlook: mixed with bearish bias
MT outlook: mixed with bearish bias
LT outlook: mixed
USD/CAD
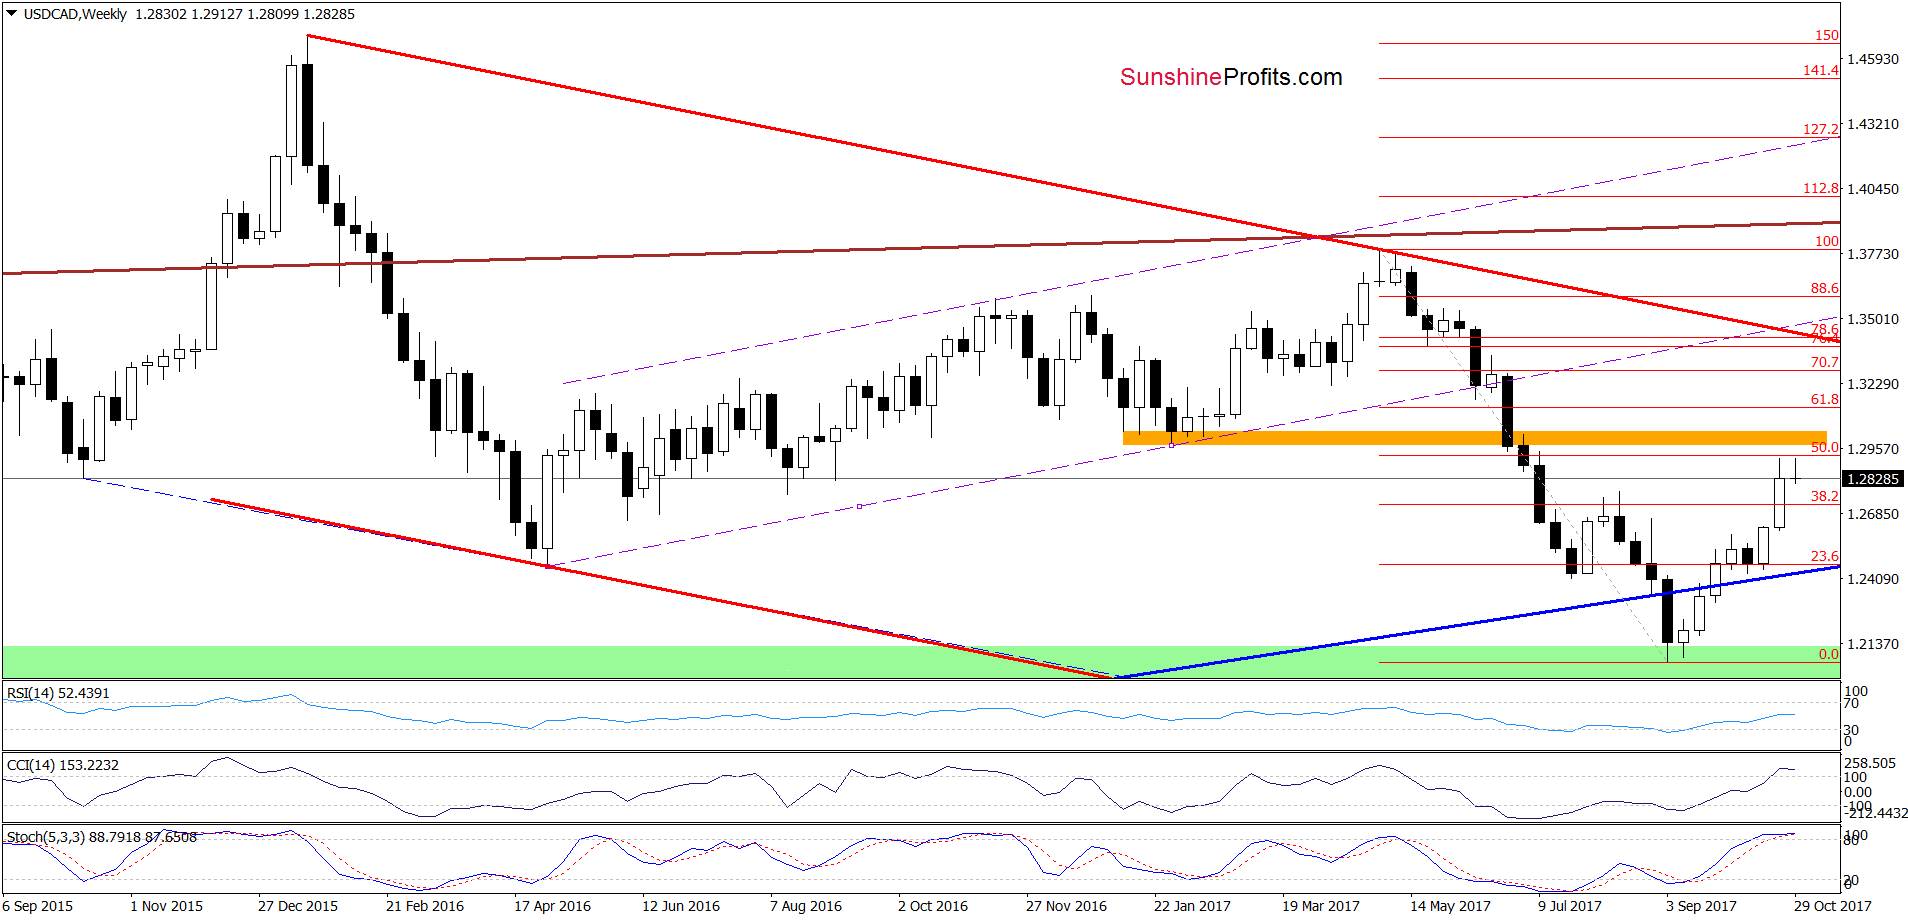
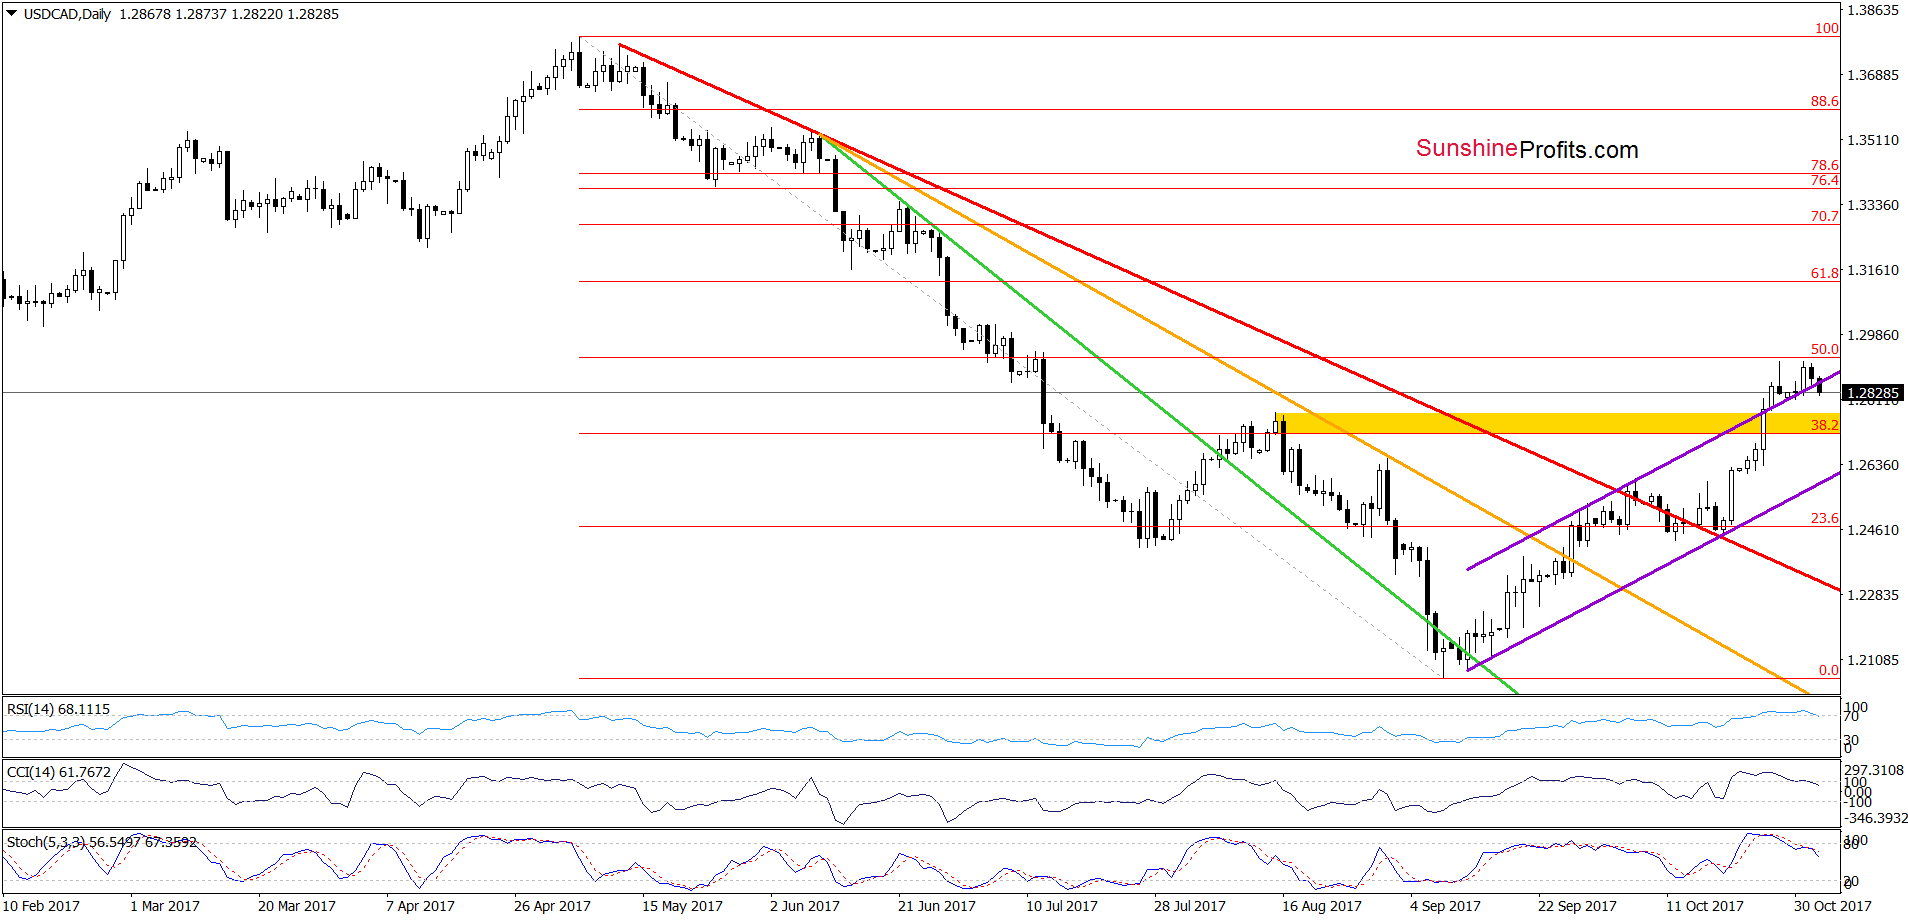
Looking at the daily chart, we see that the situation remains almost unchanged as USD/CHF is trading around the previously-broken upper border of the purple rising trend channel. Earlier today, the exchange rate dropped below this line, but in our opinion, this development will turn into bearish only if we see a daily closure under this resistance line.
Will we see such price action? On one hand, the RSI, the CCI and the Stochastic Oscillator generated the sell signals, suggesting further declines and (at least) a test of the yellow zone created by the mid-August highs and the 38.2% Fibonacci retracement.
However, on the other hand, as long as there is no daily closure inside the purple rising trend channel, the recent drop could be a verification of the earlier breakout, which would translate into one more move to the upside. Therefore, waiting at the sidelines for today’s closure is justified from the risk/reward perspective.
Very short-term outlook: mixed
Short-term outlook: mixed
MT outlook: mixed
LT outlook: mixed
Naturally, the above could change in the coming days and we’ll keep our subscribers informed, but that’s what appears likely based on the data that we have right now. If you enjoyed reading our analysis, we encourage you to subscribe to our daily Forex Trading Alerts.
Thank you.
Nadia Simmons
Forex & Oil Trading Strategist
Przemyslaw Radomski, CFA
Founder, Editor-in-chief, Gold & Silver Fund Manager
Gold & Silver Trading Alerts
Forex Trading Alerts
Oil Investment Updates
Oil Trading Alerts
