
Welcome to Sunshine Profits’ first Forex Trading Alert! My name is Nadia Simmons and I’d like to introduce you to the technical side of the currency market. As you may know, I’m interested in the crude oil market and everything related. However, the market that I’ve been specializing in, that I’ve spent most hours investigating (and that I like the most) is forex. I’ll share my knowledge and I hope that my technical point of view will help you better understand the current market situation and profit from this experience.
This is the initial Forex Trading Alert, which means that it’s slightly different from the ones that will follow. Today’s issue provides the general overview of the currency pairs that we will cover (EUR/USD, GBP/USD, USD/JPY, USD/CAD, and USD/CHF); the following alerts will be shorter and will focus mostly on trading implications (similarly to what I currently do in Oil Trading Alerts). I will provide the outlooks for each of the above-mentioned currency pairs, and I will provide trading suggestions (naturally, this is not investment advice) when the risk / reward ratio seems favorable enough to open a long or short position in any of them.
I invite you to read my daily forex commentary and… May the profits be with you.
At the beginning of the previous week, it seemed that the currency market would not surprise us as trading volumes were expected to remain thin due to the Christmas holiday. Meanwhile, it turned out that the end of the week was quite interesting as increased volatility helped exaggerate market moves.
On Friday, the euro rallied to its highest level against the U.S. dollar since the end of October 2011 as European Central Bank Governing Council member Jens Weidmann warned that keeping interest rates low may endanger political reforms. Although his words pushed the European currency higher, this improvement was only very temporary and in the following hours the euro reversed course and gave up earlier gains.
On the same day, we also saw an upswing in the case of the pound – the British currency climbed to its highest level since August 2011 as speculation that the Bank of England will raise interest rates sooner than previously anticipated pushed the currency higher.
It’s also worth mentioning that the U.S. dollar fell to the lowest level since November 2011 against the Swiss franc on Friday as the Swissie rallied along with the euro and the pound.
Meanwhile, the U.S. dollar rose to a new five-year high against the yen and also advanced against the Canadian dollar as rising expectations of further stimulus tapering by the Federal Reserve pushed the greenback higher. As a reminder, the U.S. central bank will start reducing its bond-buying stimulus program by $10 billion a month in January, amid indications of an improving U.S. economy.Please note that the yen continued to weaken as speculation that the Bank of Japan will have to expand its stimulus program in the coming months weighted on the currency.
At this point, you are probably wondering which significant data is likely to affect the currency market next week.
Today, the U.S. will release private sector data on pending home sales (a leading indicator of economic health). Tomorrow, investors will get the U.S. private sector data on consumer confidence and house price inflation, as well as a report on manufacturing activity in the Chicago region. On Wednesday, markets in Japan, Europe, Switzerland, the U.K., Canada and the U.S. will remain closed for the New Year’s holiday. On the following day, markets in Japan will remain closed for a bank holiday and the euro zone will release revised data on its manufacturing PMI. Later in the day, the Institute of Supply Management will release its manufacturing PMI, while the Labor Department will release its weekly report on initial jobless claims. Also on Thursday, the U.S. will publish data on construction spending. On Friday, markets in Japan will remain closed for a bank holiday and Switzerland will publish the results of its SVME manufacturing PMI.
Having discussed the above, let’s now move on to the technical part of this Forex Trading Alert and focus on the technical changes in the currency market. Today, we take a look at charts in different time horizons to have a more complete picture of the current situation in the market.
Let’s start with the long-term EUR/USD chart.
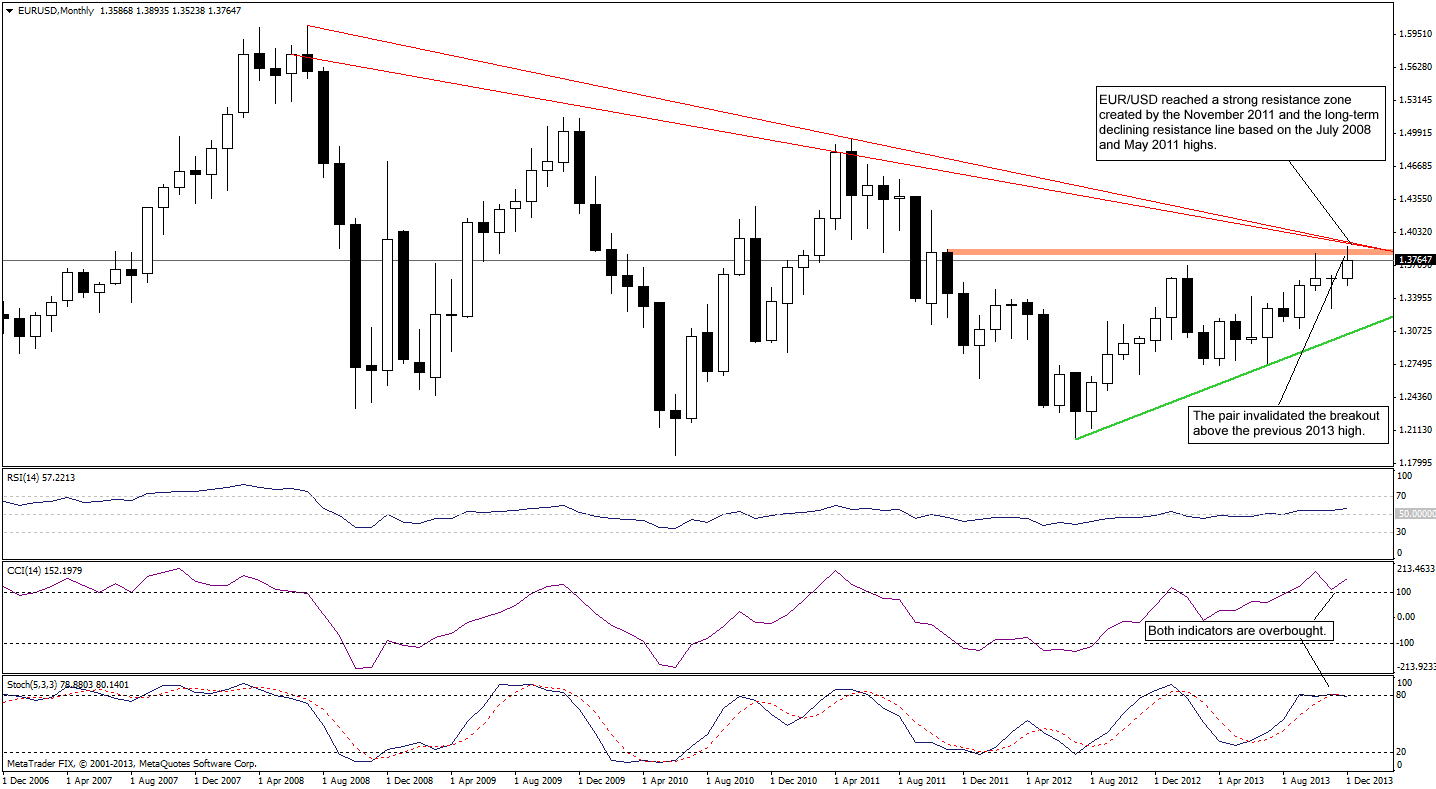
On the above chart, we see that although EUR/USD broke above the previous 2013 highs, the situation didn’t change. This upward move was only very temporary and the pair quickly invalidated the breakout above this resistance level, which is a bearish sign.
As you can see on the monthly chart, slightly above this area is also the long-term declining resistance line based on the July 2008 and May 2011 highs. From this perspective, it seems that even if the pair moves higher once again, this resistance line will likely stop further growth. Please note that the CCI and Stochastic Oscillator are overbought, which supports the bearish case.
Let’s zoom in our picture and check the weekly chart.
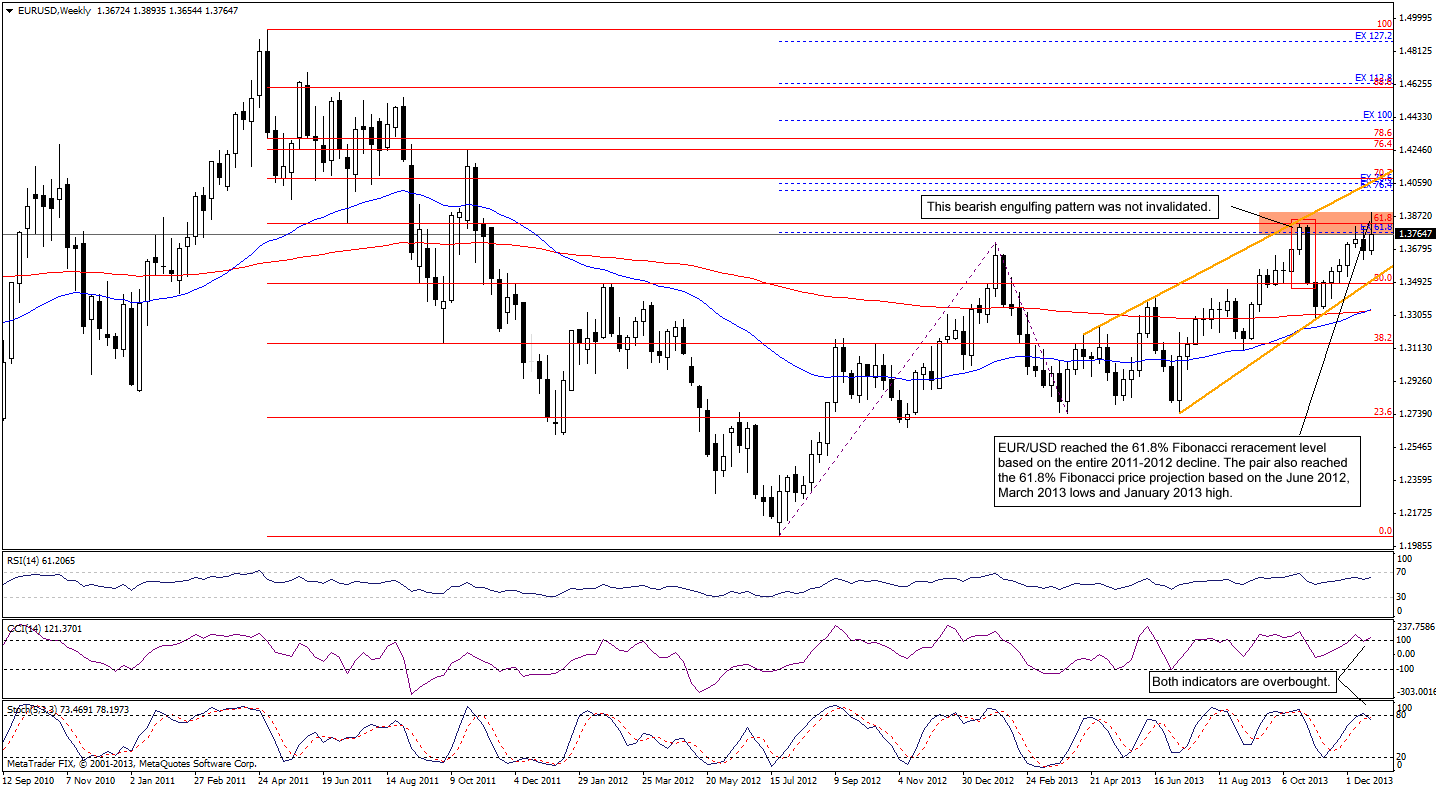
Looking at the above chart, we see that the EUR/USD pair remains in the medium-term rising trend channel (marked with orange lines). In October, the pair reached a strong resistance zone created by the 61.8% Fibonacci retracement level (based on the entire May 2011-July 2012 decline) and the 61.8% Fibonacci price projection (based on the July 2012 low, January 2013 high and March 2013 low). Back then, the combination of these two resistance levels with the upper line of the rising trend channel stopped further growth and the euro declined against the U.S. dollar. This sharp drop resulted in a big black candle, which together with the previous one created a bearish engulfing pattern.
As you can see on the above chart, it encouraged the sellers to act and resulted in further deterioration. With this downward move, the pair reached the lower line of the rising trend channel and reversed course. In the following weeks, we saw further improvement and the euro almost erased the entire Oct.-Nov. decline against the greenback. At the beginning of December, the strong resistance zone stopped the rally once again and triggered a downswing.
As mentioned earlier, although the pair broke above the previous 2013 highs the situation didn’t change as the breakout above this resistance level was quickly invalidated. Therefore, it seems that we may see a situation similar to the one we saw in October and that the euro will likely decline to the lower border of the rising trend channel once again (currently around 1.3492). Please note that this assumption is reinforced by the position of the indicators. There is a small negative divergence on the RSI (even though the indicator itself is still below the level of 70) and both other indicators generated sell signals, which is a bearish sign.
Let’s move on to the short-term chart.
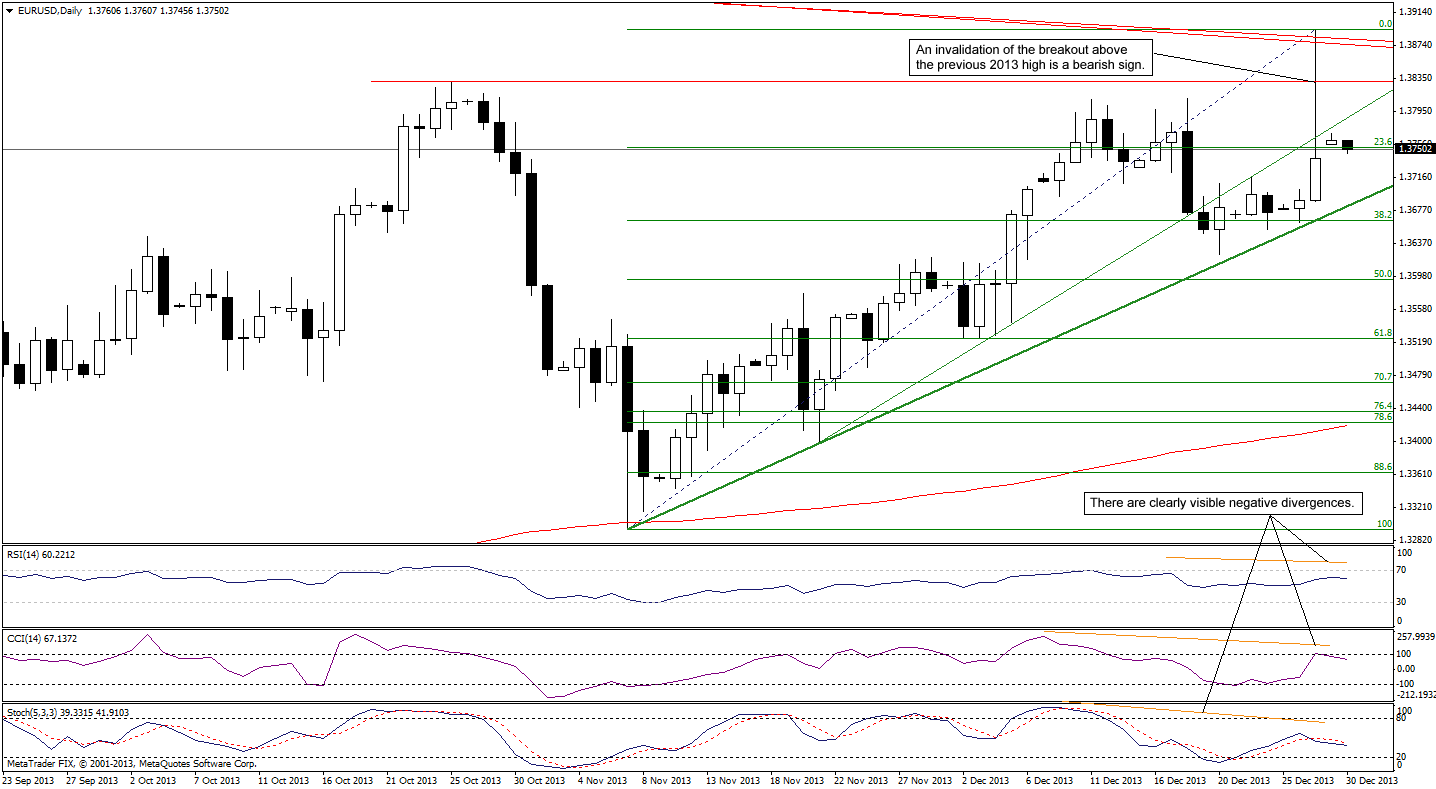
On the above chart, we see that the euro rose to a new annual high against the U.S. dollar on Friday. Although this intraday increase was sharp, it actually didn’t change much. The European currency moved above the previous 2013 high only very temporary, without a breakout in terms of daily closing prices, which is a negative signal.
From this perspective, we clearly see that the pair quickly declined below the rising support line based on the Nov. 21 and Dec. 4 lows, which now serves as resistance. Please note that recent days have formed a consolidation on the above chart. However, taking into account the length of the upper shadow of Friday’s candlestick, we clearly see the strength of the sellers. Therefore, if they manage to push the price below Friday’s low (which currently intersects with the short-term support line created by the Nov.7 and Nov. 21 lows), we will likely see further deterioration to at least 1.3625 where the Dec. 20 low is.
Once we know the current situation in EUR/USD, let’s move on to GBP/USD. We’ll start with the long-term chart.
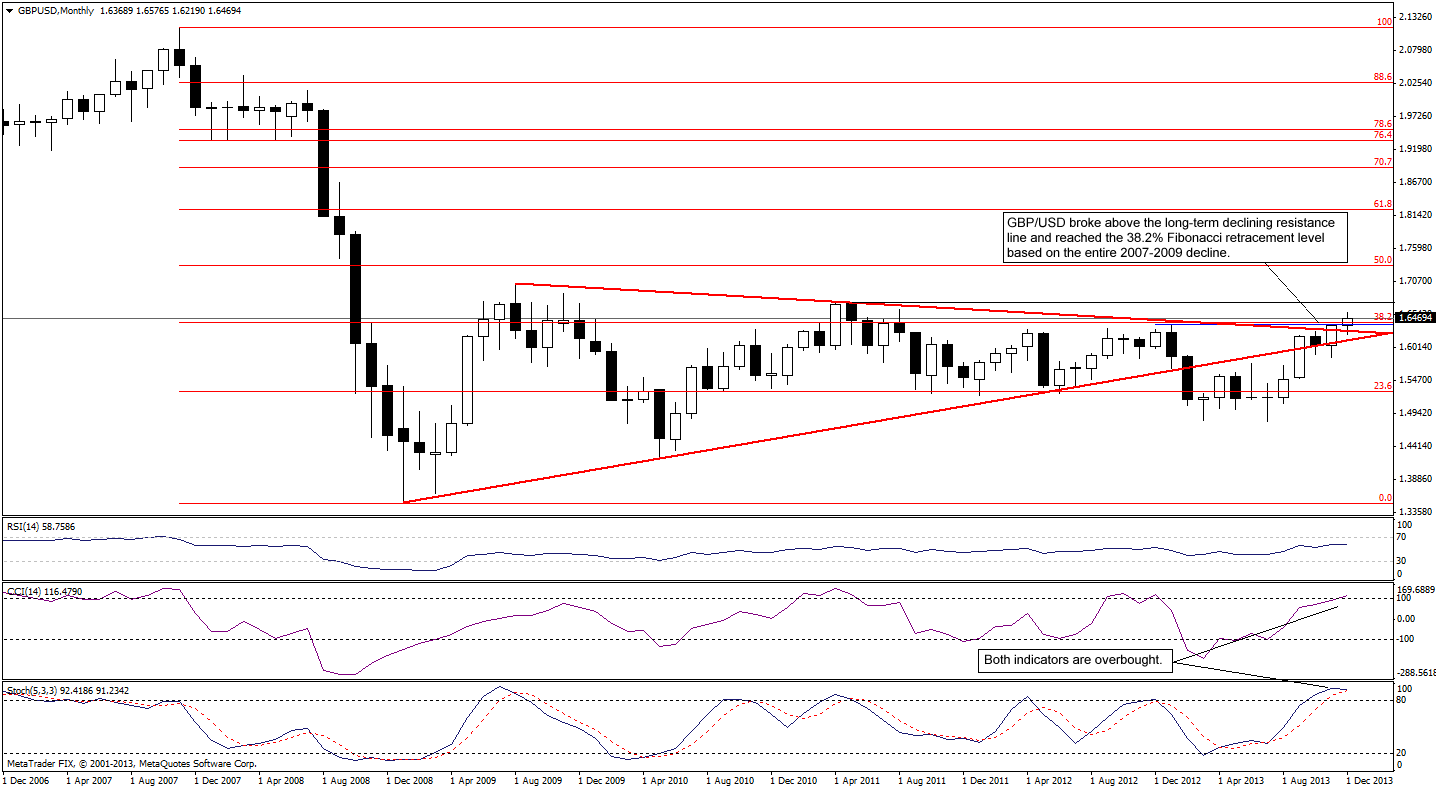
Looking at the above chart, we see that the pair broke above the long-term resistance line created by the August 2009 and April 2011 highs, which is a strong bullish signal for the pound. Additionally, it reached the 38.2% Fibonacci retracement level based on the entire 2007-2009 decline. From this perspective, it seems that as long as GBP/USD remains above the long-term support/resistance line, the space for further decline is limited. Please note that the next upside target is around 1.6744 where the April 2011 high is.
Let’s take a closer look at the weekly chart.
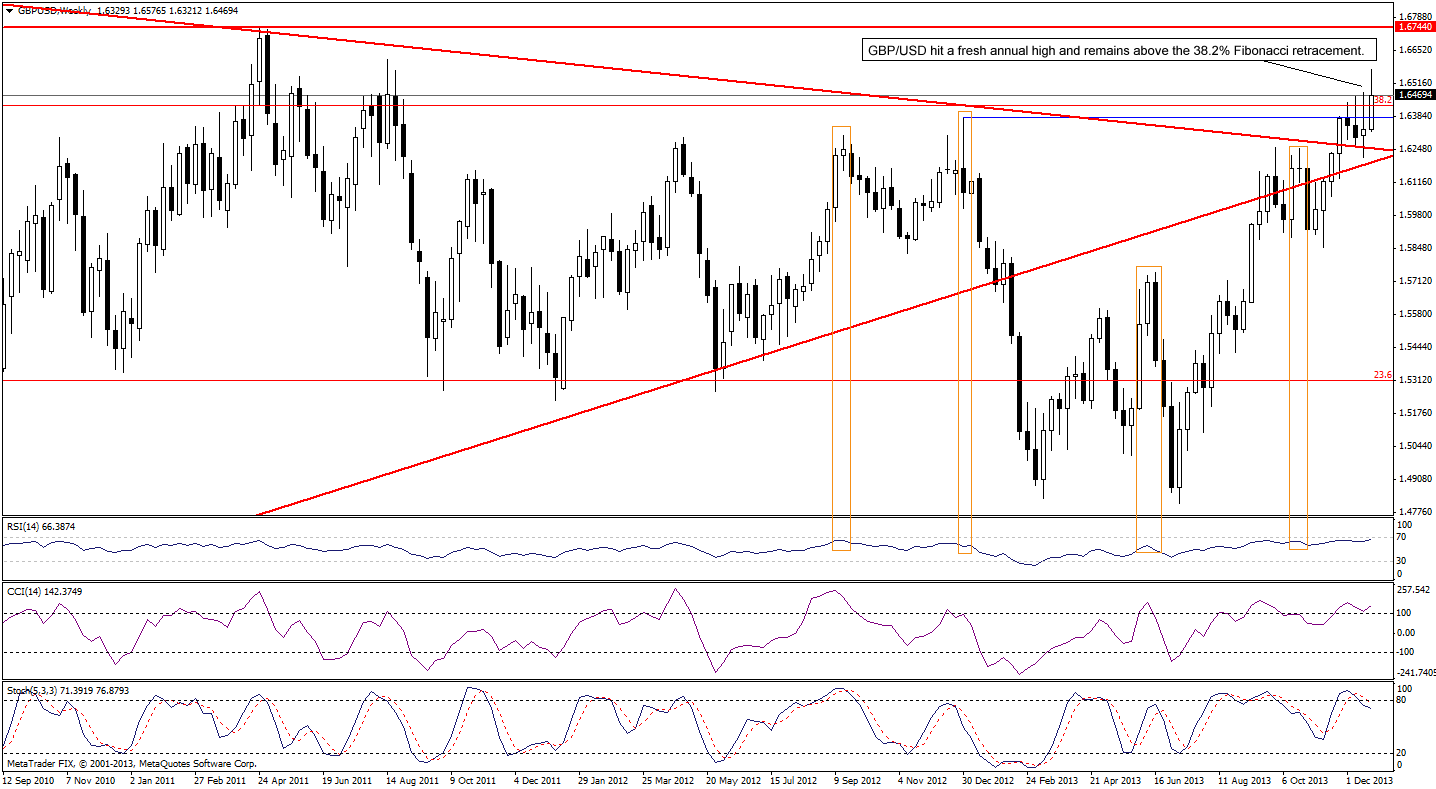
The first thing that catches the eye is the medium-term uptrend. From this perspective, we see that the pound against the U.S. dollar quickly invalidated a small drop below the long-term declining support/resistance line, which was a positive signal. These circumstances encouraged the buyers to act and resulted in an upswing, which took the pair above the 38.2% Fibonacci retracement level.
Looking at the weekly chart we see that the RSI is at its highest level this year. Earlier this year and also in 2012 lower values of the indicator were enough to trigger a corrective move. Therefore, if history repeats itself once again, we may see similar situation in the near future. Additionally, the CCI is overbought and the Stochastic Oscillator generated a sell signal, which supports the bearish case.
Let’s check the short-term outlook.
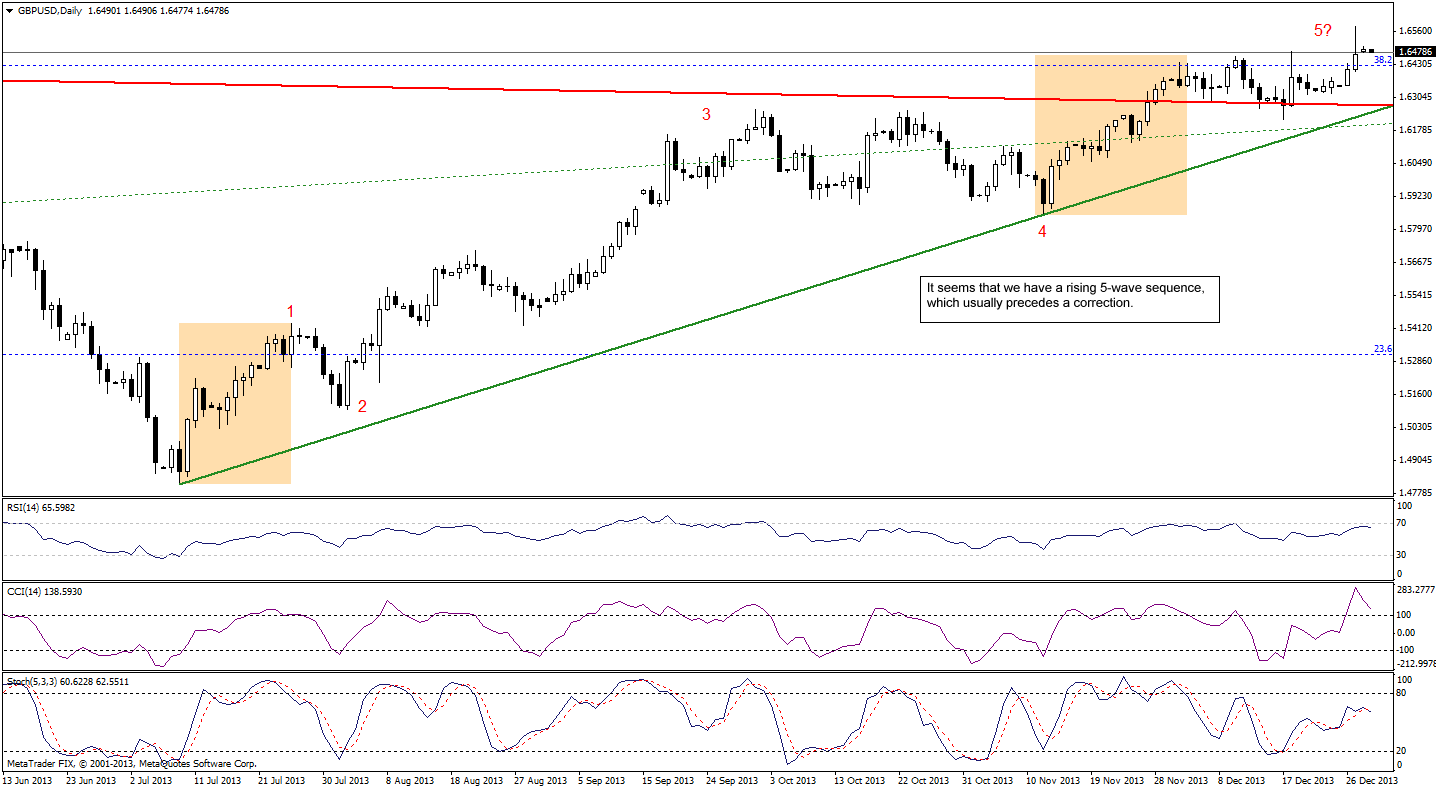
Looking at the above chart, we see that GBP/USD broke above the upper line of the consolidation range that we saw during the two previous weeks. Although we had a breakout, the pair quickly reversed course and slipped to the consolidation range, which is not a positive signal. From today’s point of view, we can notice another consolidation, but it seems that is just a pause before further deterioration – especially when we take into account the position of the indicators.
When we take a closer look, we see a small negative divergence between the RSI and the course (we can see the same in the case of the Stochastic Oscillator), which is a bearish sign. Additionally, the CCI is overbought and the Stochastic Oscillator generated a sell signal.
We should keep in mind that if the pound drops below the red long-term support line (which currently intersects with the green short-term rising support line), it will likely trigger a bigger corrective move. Please note that we can notice a rising 5-wave sequence on the above chart, which is in tune with the above assumption. According to the Elliott wave theory, this complete sequence usually precedes a correction and if that is the case, the pound will likely drop against the U.S. dollar in the near future. Additionally, when we take a closer look, we see that wave 1 is similar to wave 5, which reinforces the above. Therefore, we should keep an eye on this pair because it seems that a bigger move is just around the corner.
Having discussed the current situation in GBP/USD, let’s examine the long-term USD/JPY chart.
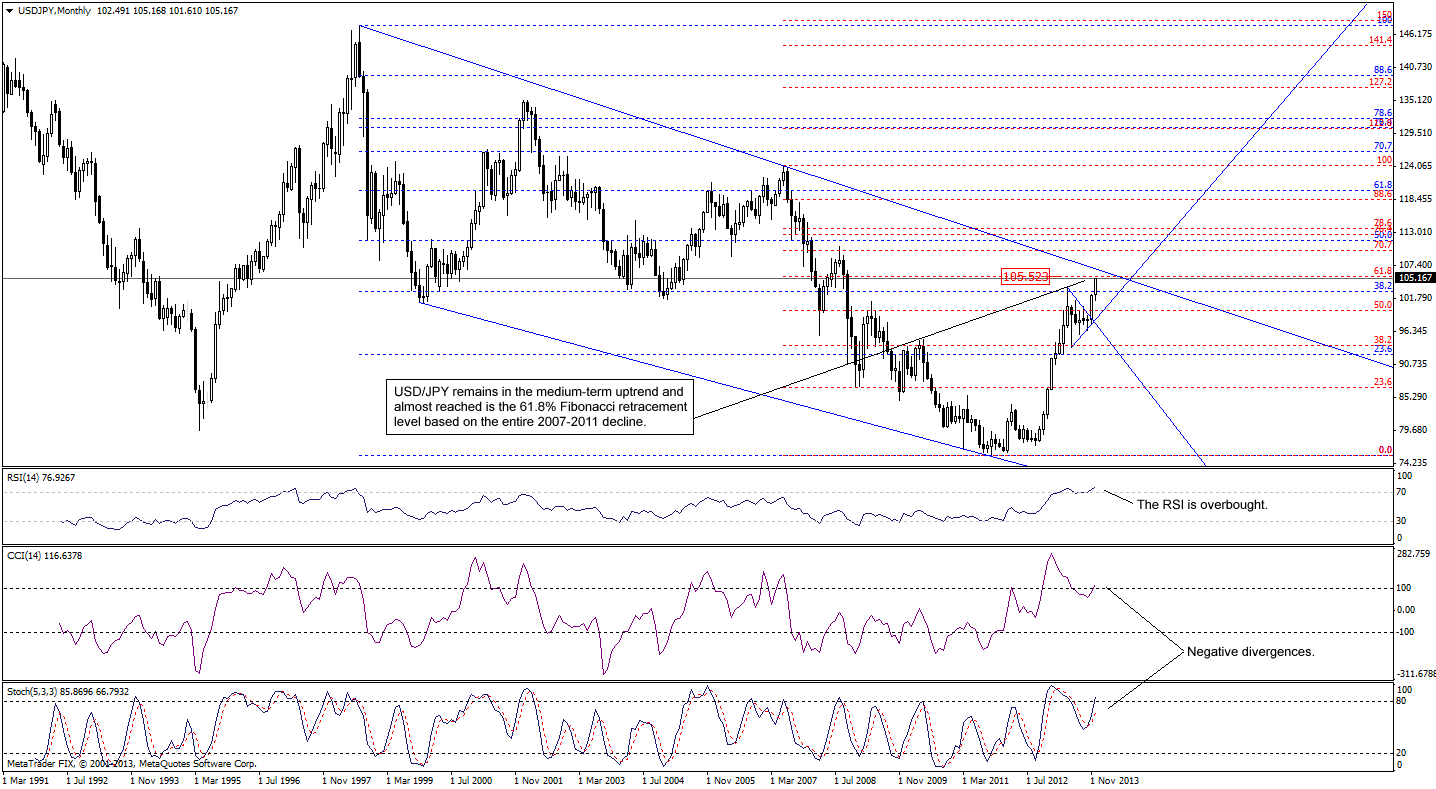
On the above chart, we see that the pair remains in the medium-term uptrend and it rose to the highest level since October 2008 in the previous week. With this rally, USD/JPY broke above the 38.2% Fibonacci retracement level based on the entire 1998-2011 decline, which is a strong bullish signal for the greenback. From this perspective, the nearest resistance is the 61.8% Fibonacci retracement level based on the entire 2007-2011 decline (around 105.52), which was almost reached.
Please note that this area is reinforced by the long-term declining resistance line based on the 1998 and 2007 highs and even if we see an upswing above the 61.8% retracement, this line will likely stop (or at least decelerate) further improvement – especially when we take into account the position of the RSI, which is overbought. Additionally, we can notice negative divergences between the course and both other indicators.
Let’s take a look at the medium-term picture.
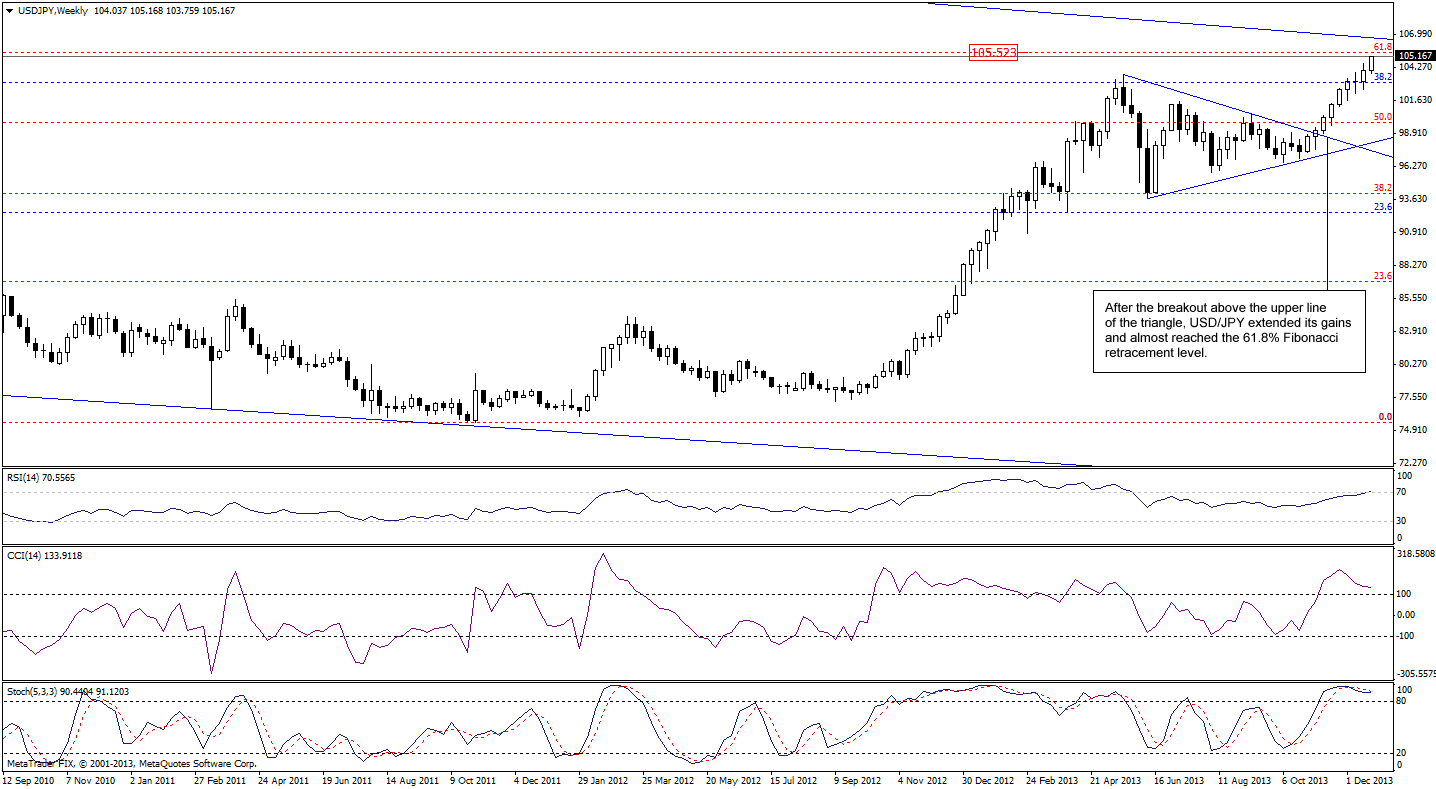
On the above chart, we see that USD/JPY broke above the medium-term resistance line (based on the previous 2013 and September highs), which is also the upper border of a triangle. According to theory, the upside target for this formation is around 107.67 (marked with the orange rectangle). However, before the buyers realize this scenario, they will have to break above the 61.8% Fibonacci retracement and the long-term resistance line, which will not be easy. As mentioned earlier, the combination of these resistance levels may stop (or at least decelerate) further improvement. Please note that the RSI reached the level of 70 and both other indicators almost generated sell signals, which suggests that the pair may reverse course in the coming week (or weeks).
Let’s move on to the short-term chart.
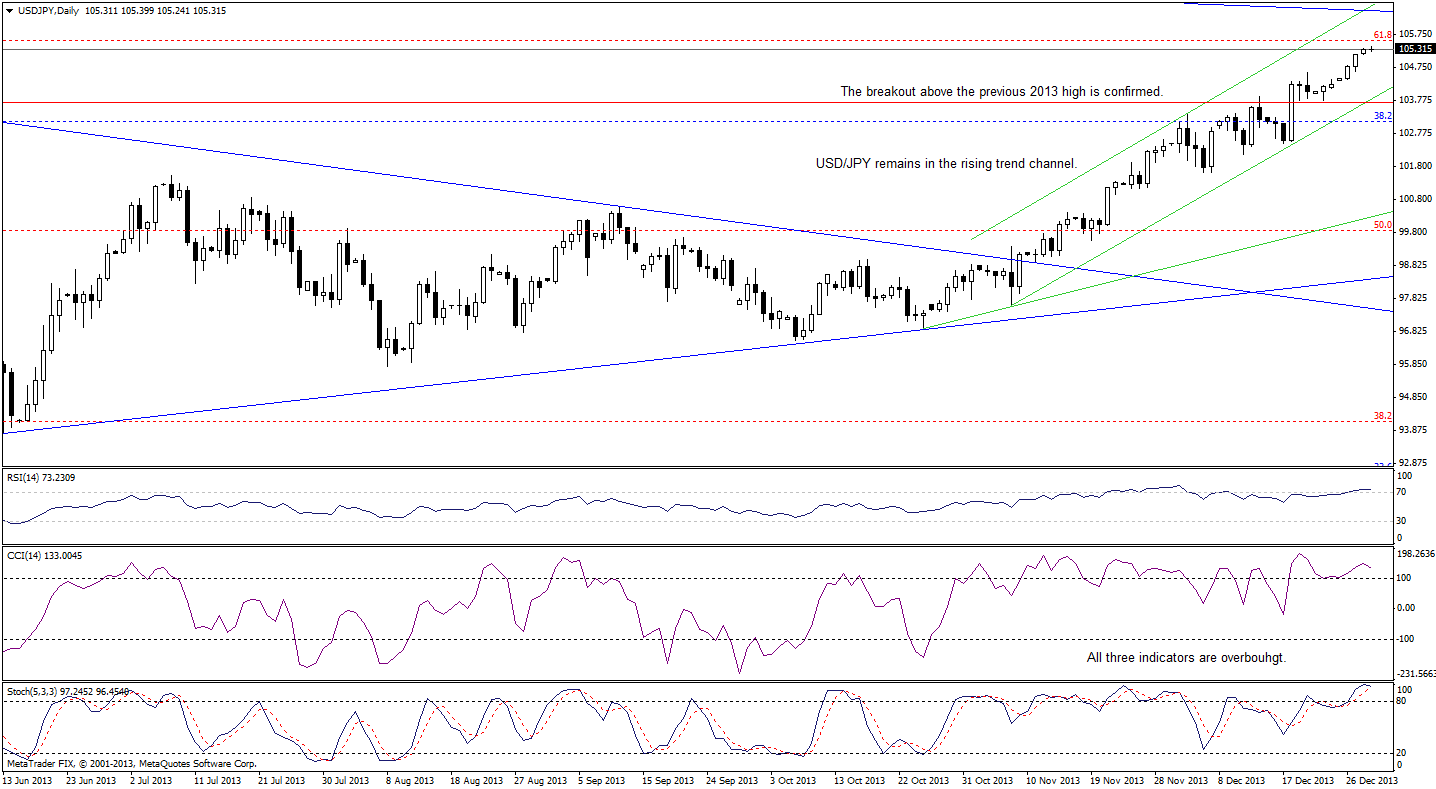
Looking at the above chart, we clearly see that the USD/JPY pair remains in the short-term uptrend, which is not threatened at the moment from technical point of view. However, when we take a look at the indicators, we clearly see that the RSI is overbought (above the level of 70), which suggests that we could see a pause or correction. Additionally, we can notice a negative divergence between the CCI and the course, which is a bearish signal. On top of that, both other indicators are overbought and very close to generating sell signals. Taking these circumstances into account, and combining them with the proximity to the strong resistance levels (the 61.8% Fibonacci retracement and the long-term declining resistance line), the pair could reverse course in the near future.
Please note that the nearest support is the short-term rising support line (which is also the lower border of the rising trend channel) based on the Nov.7 and Dec. 18 lows. If it is broken, a bigger corrective move is likely to be seen.
Once we know the above let’s focus on the long-term USD/CAD chart.
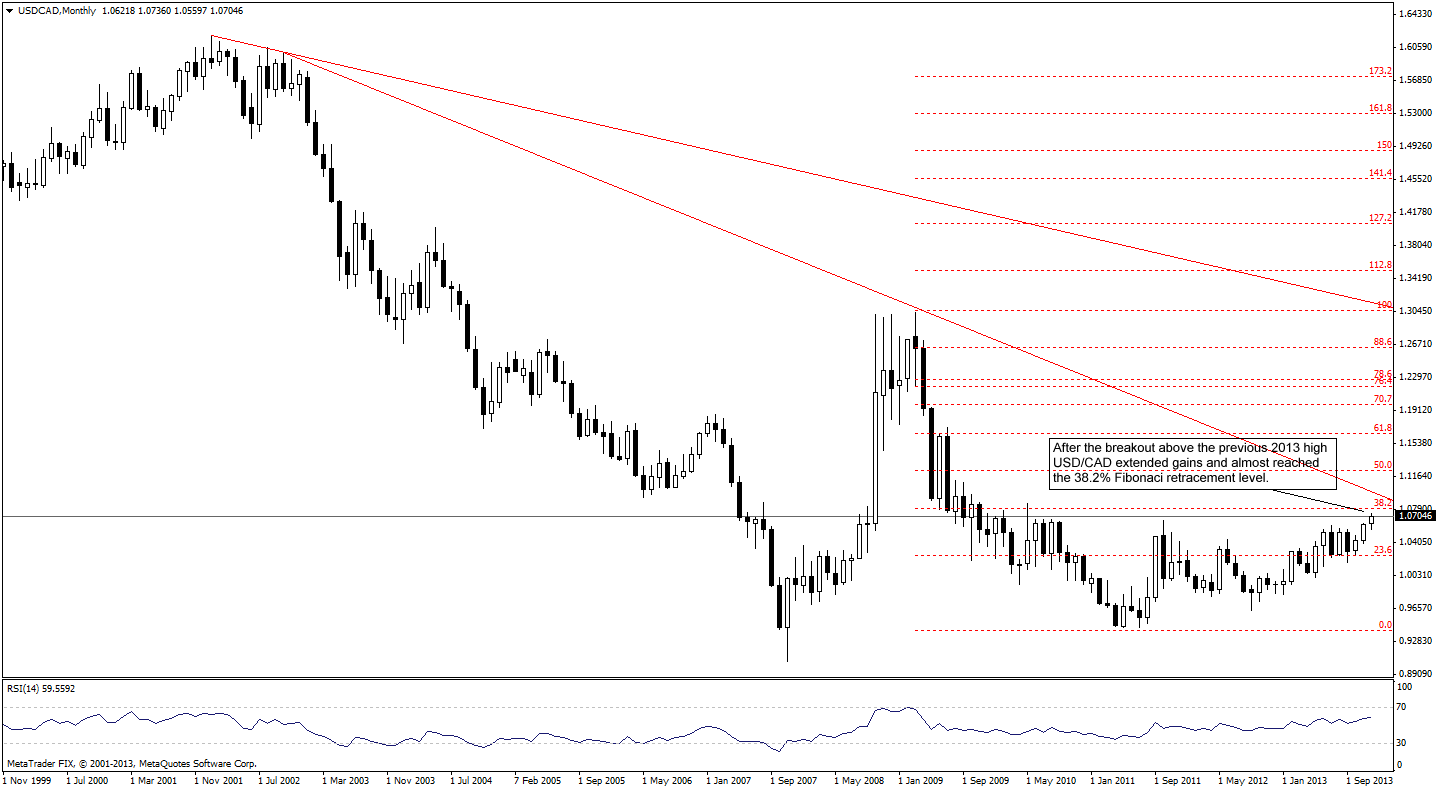
From this perspective we see that the pair successfully broke above the October 2011 high (which is a bullish signal) and approached a strong resistance created by the 38.2% Fibonacci retracement level. On top of that, slightly above this resistance level is the long-term declining resistance line based on the August 2002 and March 2009 highs, which will likely decelerate or even stop further growth.
Let’s zoom in our picture and take a look at the weekly chart.
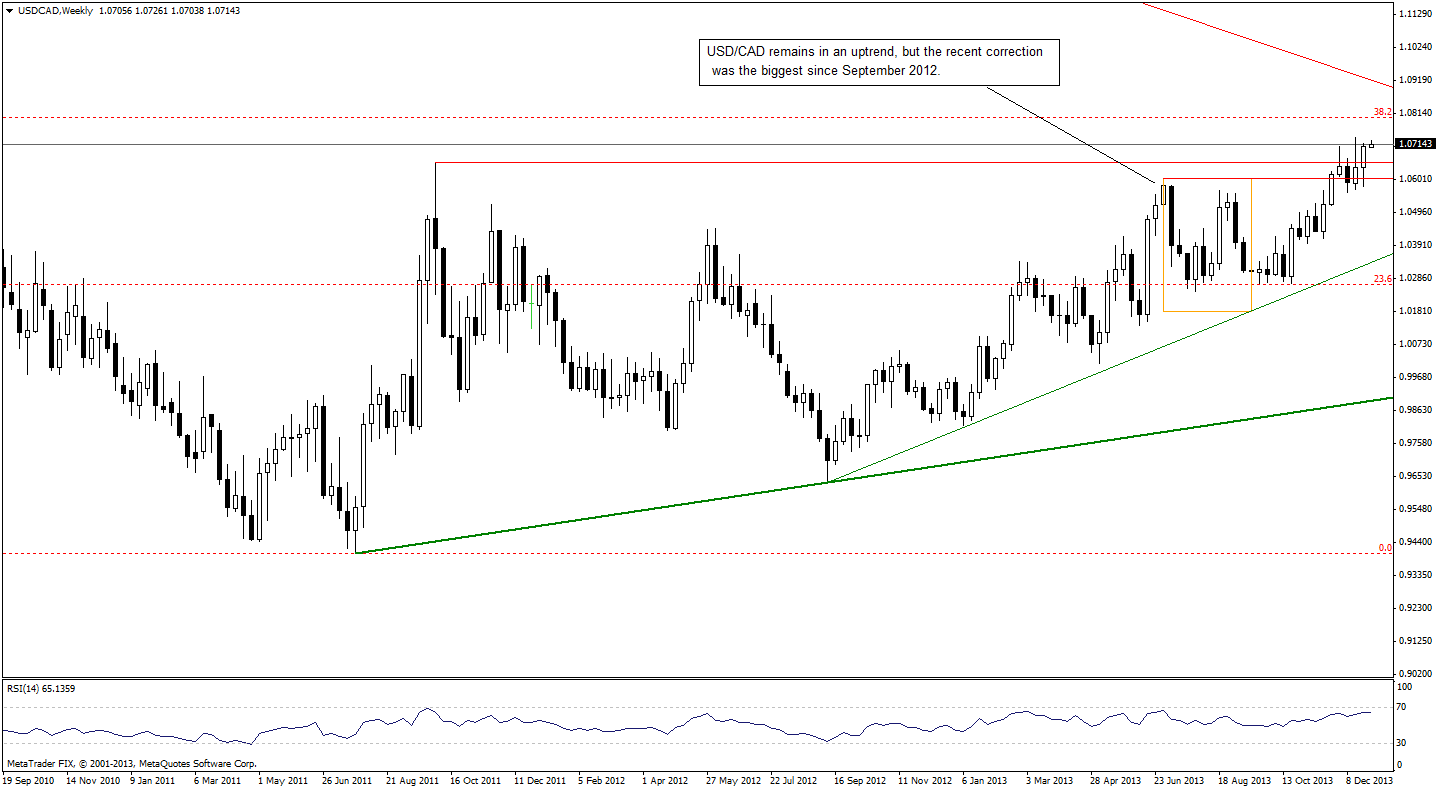
From this perspective we see that the trend remains up, however, the recent (July-September) correction was the biggest since the beginning of September 2012, which is a first bearish signal, which suggests that the strength of the buyers may wane in the following weeks. So far, USD/CAD rallied and hit a fresh annual high in December. Additionally, as mentioned earlier, the pair successfully broke above the October 2011 high (the breakout is not confirmed at the moment), which is a positive sign.
As you can see on the above chart, recent weeks have formed a consolidation. Therefore, if the pair breaks above the 2013 high, we will likely see an attempt to move above the 38.2% Fibonacci retracement level. However, if the buyers fail, we may see a decline below the previous 2013 high (at 1.0607). Please note that there is a small negative divergence between the RSI and the course, which is another bearish sign (not strong, but still).
Let’s take a closer look at the daily chart.
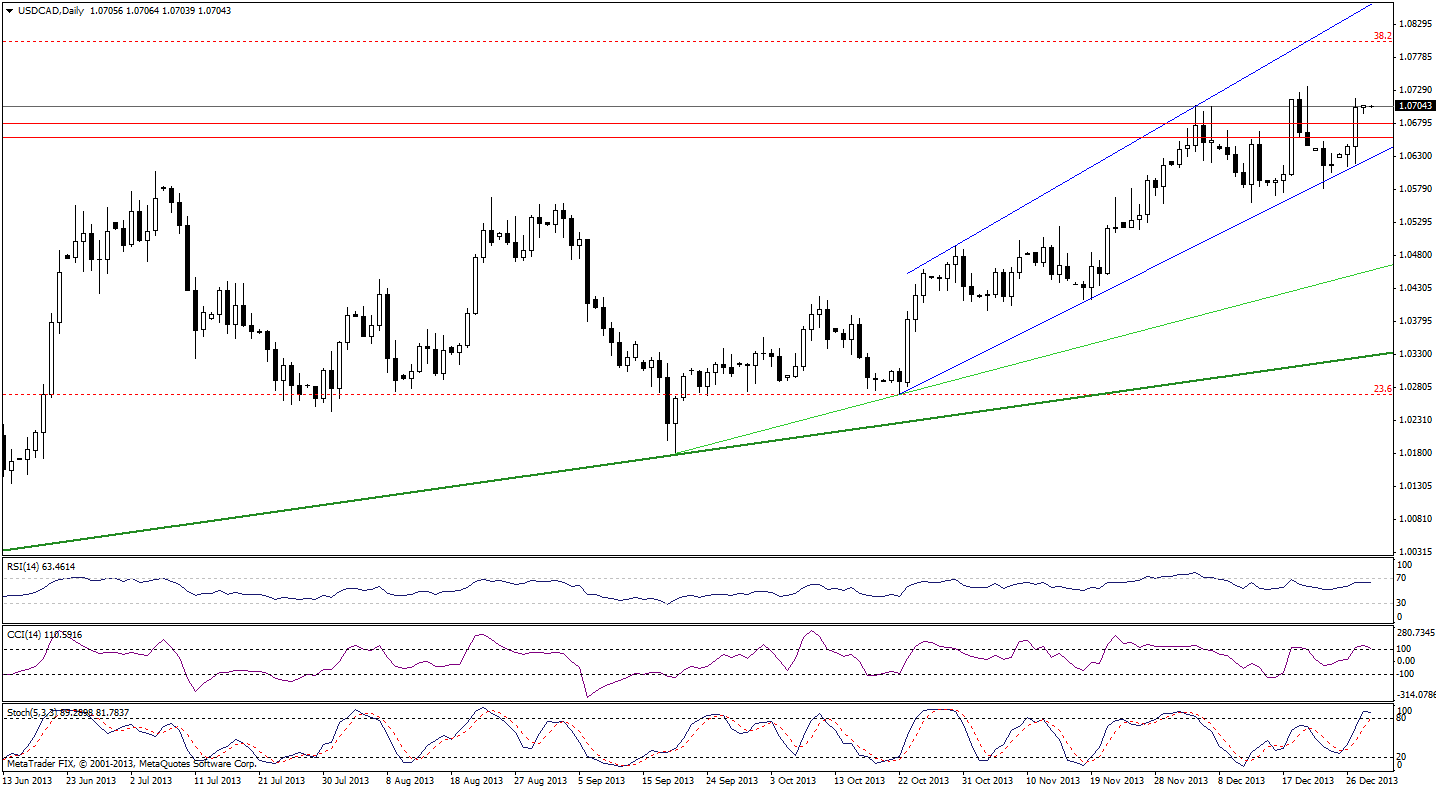
On the above chart, we see that despite last week’s drop, the lower border of the short-term rising trend channel successfully stopped further deterioration. The pair has been trading in the narrow range since the U.S. dollar hit an annual high against the Canadian dollar. From this perspective, it seems that the breakout above the 2013 high will trigger an upswing to the 38.2% Fibonacci retracement. On the other hand, the breakdown below the Dec. 23 low will likely push the pair lower – to at least 1.0524 where the Nov. 14 high is.
Please note that the RSI is not overbought yet, therefore, another move to the upside is likely to be seen. Despite this fact, we should keep in mind that both other indicators are overbought and may generate sell signals in the coming days, which will likely encourage sellers to act.
Finishing today’s Forex Trading Alert, let’s move on to the USD/CHF long-term chart.
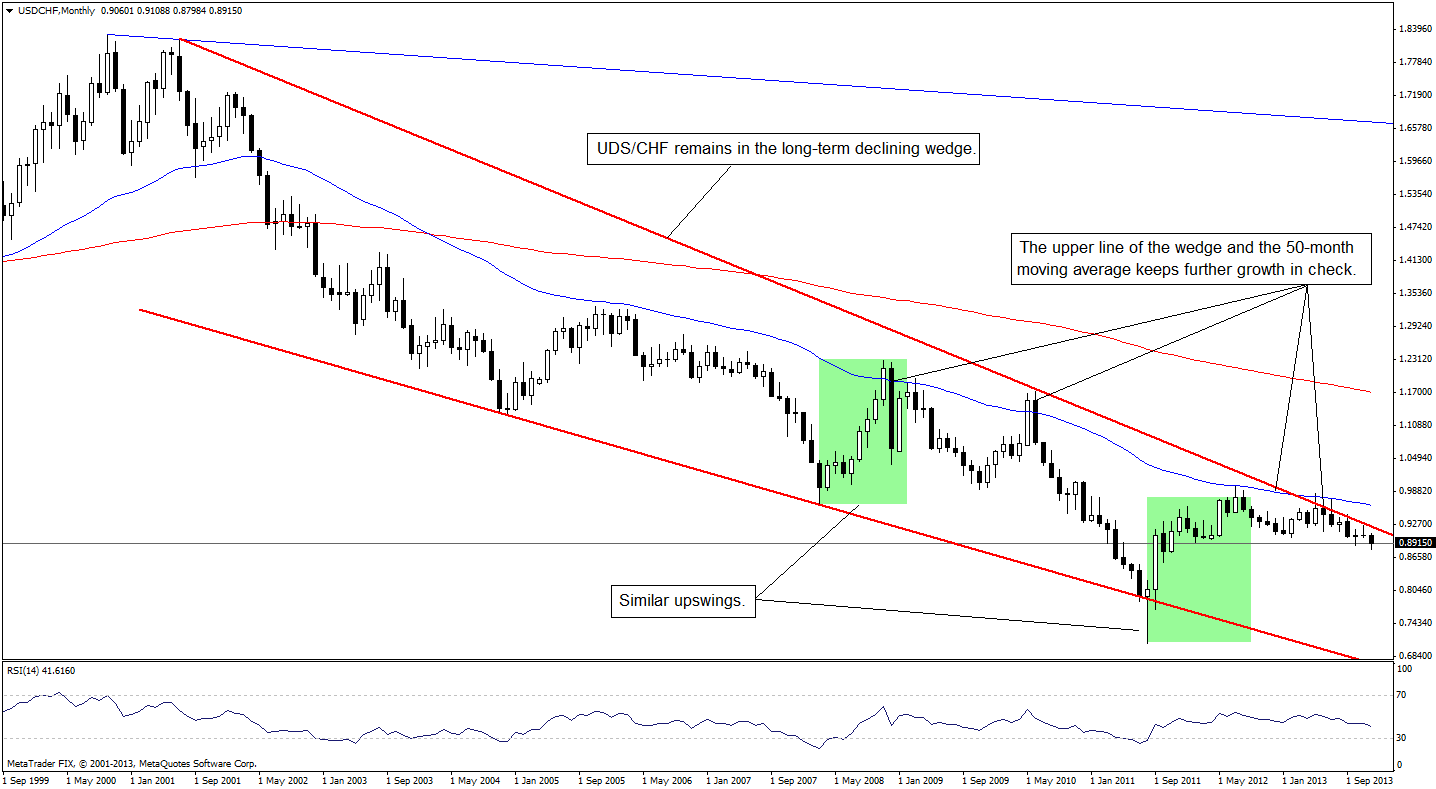
Looking at the above chart, we see that USD/CHF remains in the long-term downtrend. The pair has been trading in the long-term declining wedge since mid-2001. As you can see on the monthly chart, earlier this year the long-term declining resistance line (which is also the upper line of the declining wedge) successfully stopped further growth. Back then, it was also reinforced by the 50-month moving average, which pushed the U.S. dollar lower against the Swiss franc. Since then, USD/CHF has been trading below this strong long-term declining resistance line and it seems that as long as it remains below it, a bigger upward correction is unlikely.
Let’s check the weekly chart.
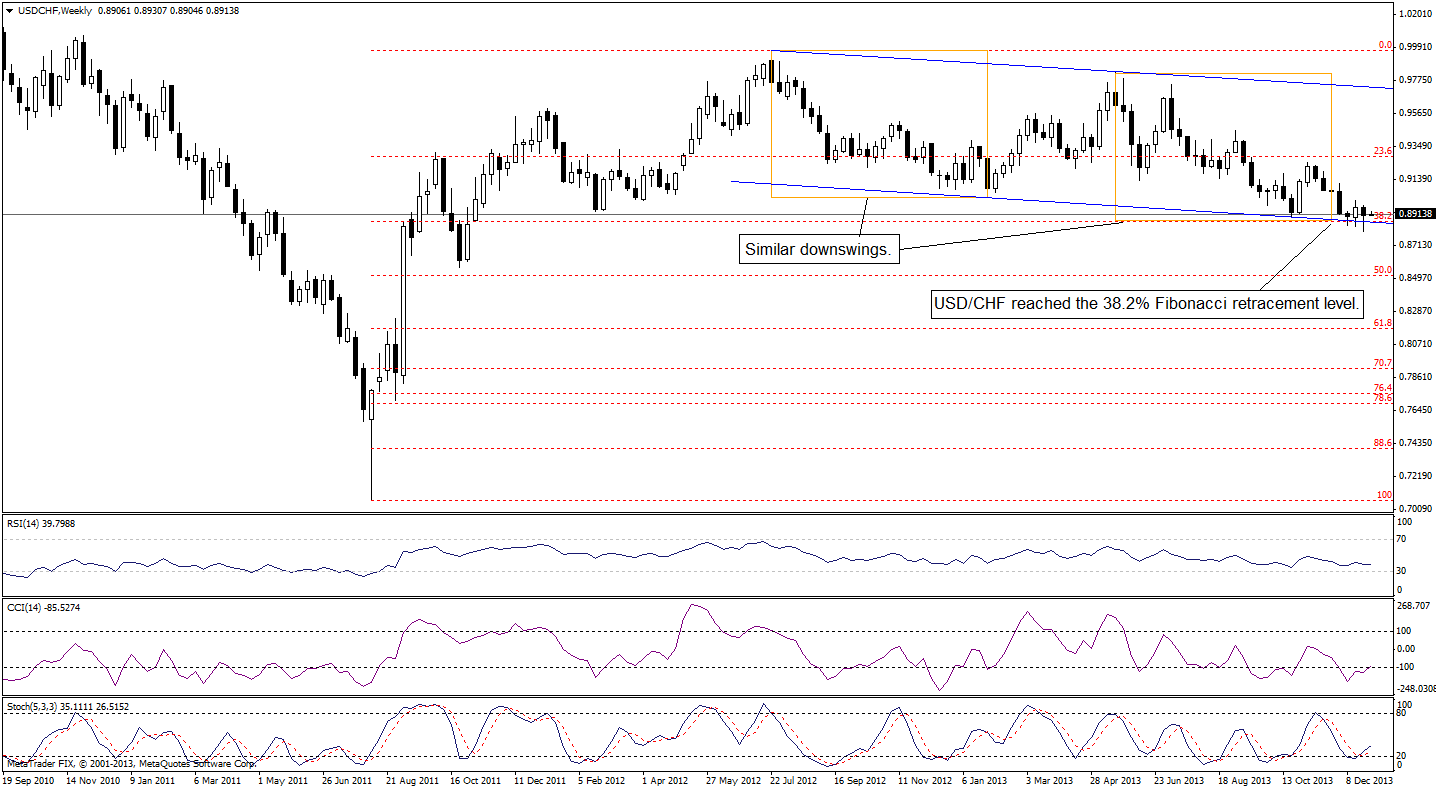
On the above chart, we clearly see that USD/CHF remains in the medium-term downtrend (the pair has been trading in the declining trend channel since July 2012). In the previous week, the pair reached the 38.2% Fibonacci retracement level based on the entire Aug. 2011-Jul. 2012 rally. Additionally, the recent decline is similar to that we saw from July 2012 to January 2013, therefore, we may see a pause or even an upward correction in the coming week (or weeks). On top of that, we see that the CCI and Stochastic Oscillator generated buy signals and there is also a small positive divergence between the RSI and the course, which supports this assumption. However, it is still too early to say that the improvement is more likely than not.
Before we summarize, let’s move on to the daily chart.
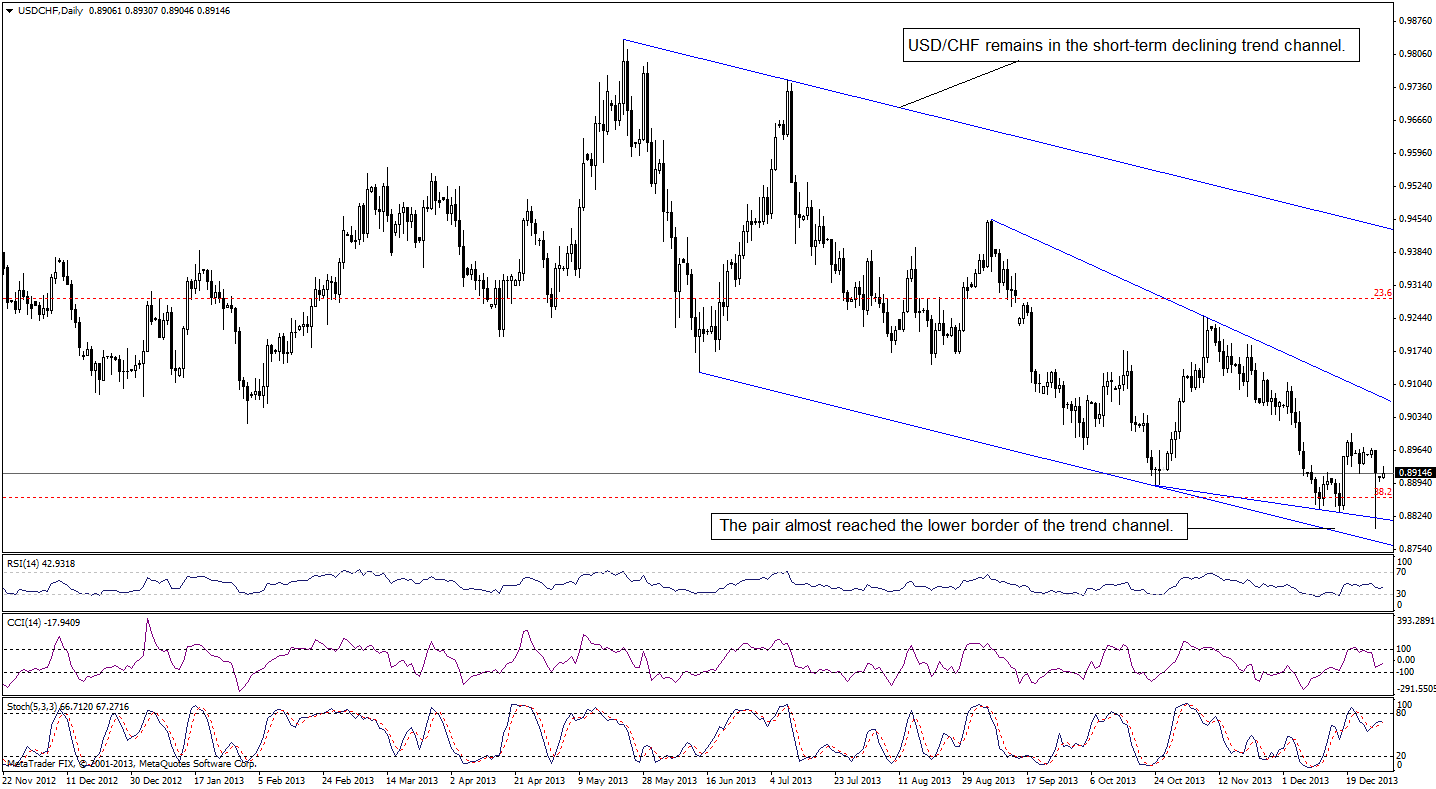
On the above chart we see, that USD/CHF remains in the short-term declining trend channel. As mentioned earlier, the pair reached the 38.2% Fibonacci retracement level, however, it also almost reached the lower border of the declining trend channel. As you can see on the daily chart, after a drop to a fresh annual low USD/CHF rebounded sharply, however, it still remains below the previous week’s high. From this perspective, the short-term trend remains down at least as long as the pair is trading below the short-term declining resistance line based on the September and November highs.
Summary
The long-, medium- and the short-term outlook for EUR/USD is bearish as the pair quickly invalidated the breakout above the previous 2013 high. Additionally, the long-term declining resistance line keeps further growth in check. The long-, medium- and short-term CCI and Stochastic Oscillator are overbought and there are negative divergences on a short-term basis, which supports the bearish case.
Although GBP/USD remains above the long-term support/resistance line and the outlook is bullish, it seems that we can notice a rising 5-wave sequence, which according to the Elliott wave theory, usually precedes a correction. If this is the case, the pound will likely drop against the U.S. dollar in the near future. Please note that this assumption is in tune with the position of the indicators (not only daily, but also medium-term ones).
USD/JPY remains in the medium-term uptrend, however, this pair approached the strong resistance zone created by the 61.8% Fibonacci retracement level based on the entire 2007-2011 decline and the long-term declining resistance line based on the 1998 and 2007 highs. Therefore, even if we see an upswing above the 61.8% retracement, this line will likely stop (or at least decelerate) further improvement – especially when we take into account the long- and medium- term position of the RSI, which is overbought. On top of that, the daily RSI is also overbought, which suggests that we could see a pause or correction.
In case of USD/CAD, we see that the pair approached the strong resistance zone, however, there is still some space for further growth – especially that the RSI is not overbought on a long-, medium- and short-term basis. From today’s point of view, it seems that the breakout/breakdown above/below the upper/lower line of the consolidation range that we saw on the weekly chart will likely show the direction of future’s move.
Finally, USD/CHF remains in the long-term downtrend and hit a fresh annual high in the previous week. Although the pair bounced off the strong support zone created by the 38.2% Fibonacci retracement level and the lower border of the short-term declining trend channel, it is too early to conclude that the bigger upward correction move is just around the corner. Nevertheless, similar downswings and the medium-term buy signals generated by the CCI and Stochastic oscillator support the buyers.
As mentioned in the opening paragraph of today’s alert (and as the title implies), this is the initial Forex Trading Alert, which means that it’s slightly different from the ones that will follow. Today’s issue provides the general overview of the currency pairs that we will cover; the following alerts will be shorter and will focus mostly on trading implications (similarly to what I currently do in Oil Trading Alerts). I will provide the outlook for each currency pair, and I will provide trading suggestions (naturally, this is not an investment advice) when the risk / reward ratio seems favorable enough to open a long or short position.
Thank you.
Nadia Simmons
Forex & Oil Trading Strategist
Oil Investment Updates
Oil Trading Alerts
