

Forex Trading Alert originally sent to subscribers on April 13, 2016, 5:51 AM.
Earlier today, official data showed that euro zone industrial production declined by 0.8% in Feb (month-on-month), missing analysts’ forecasts. Additionally, industrial production (year to year) rose less-than-expected in Feb, which pushed the euro lower against the greenback. As a result, EUR/USD declined under the Feb high, invalidating earlier breakout. How low could the exchange go in the coming days?
In our opinion the following forex trading positions are justified - summary:
- EUR/USD: short (stop-loss order at 1.1512; initial downside target at 1.0572)
- GBP/USD: none
- USD/JPY: none
- USD/CAD: none
- USD/CHF: none
- AUD/USD: none
EUR/USD
Yesterday, we wrote:
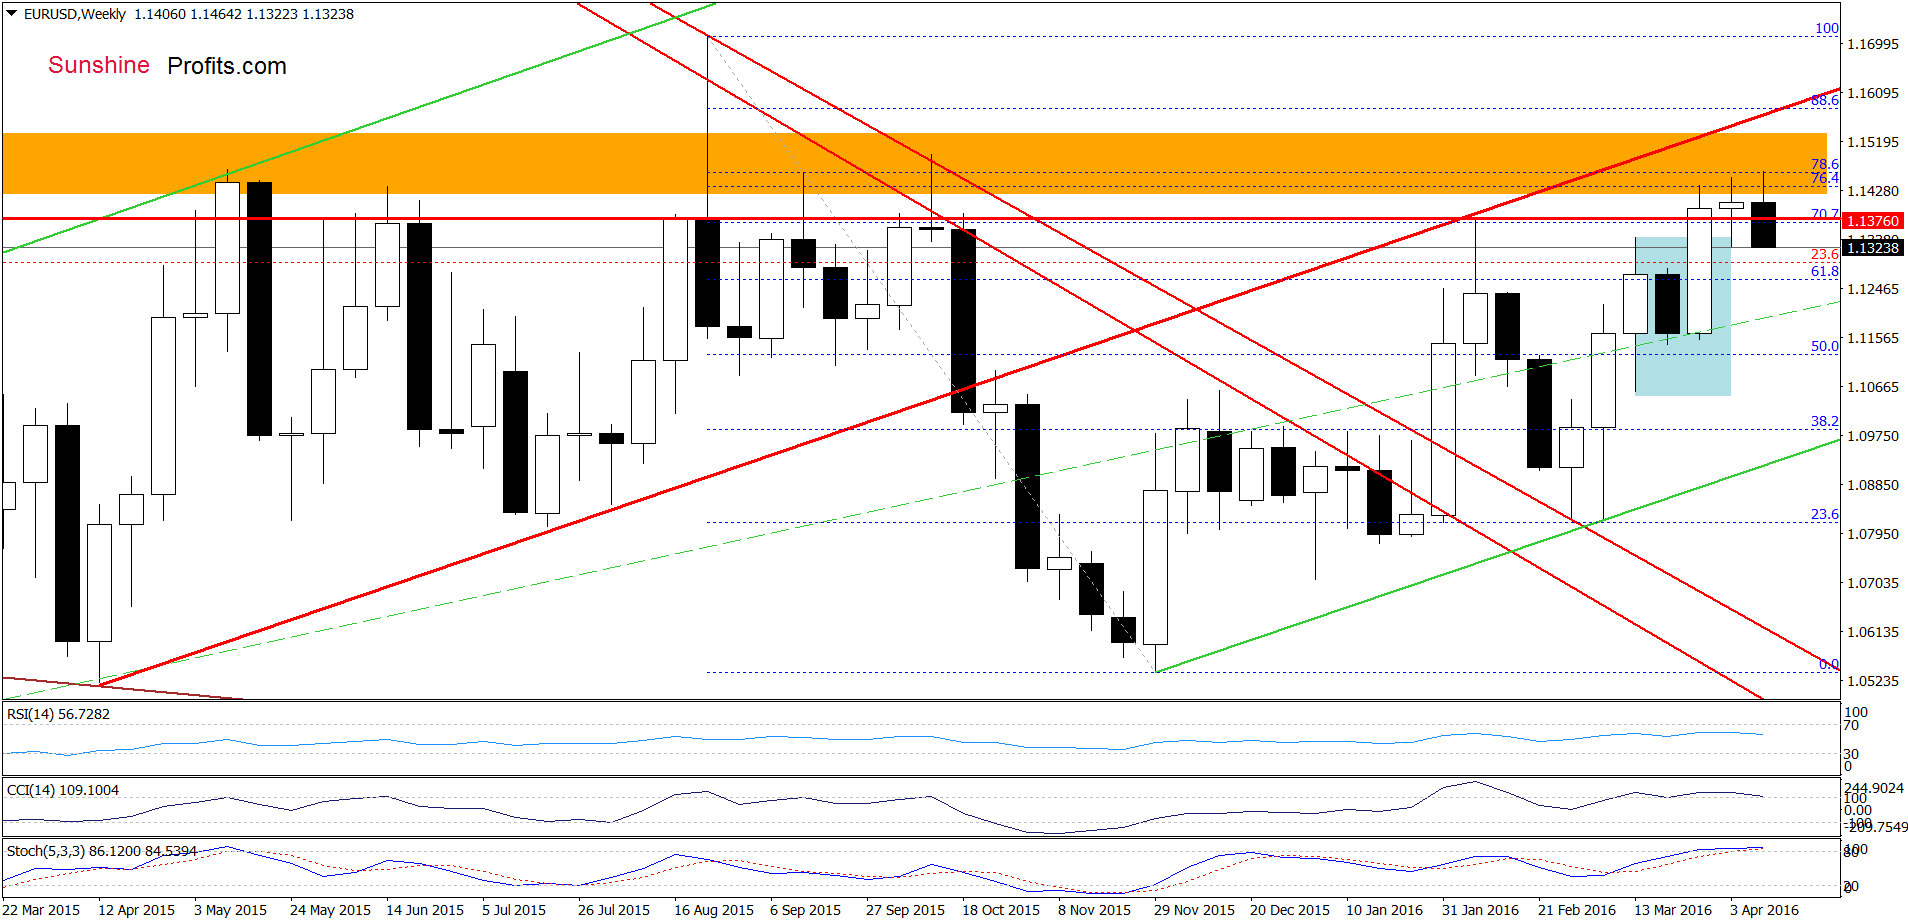
(…) although EUR/USD moved little higher, the pair remains under the key orange resistance zone. Therefore, in our opinion, as long as there won’t be a breakout above it and the red rising resistance line (based on the Apr and Jul 2015 lows), further improvement is not likely to be seen.
From today’s point of view we see that the above-mentioned key resistance zone stopped currency bulls once again, triggering a pullback. With this drop the exchange rate slipped under the Feb high, invalidating earlier breakout, which is a negative signal that suggests further deterioration. Additionally, the CCI and Stochastic Oscillator are very close to generating sell signals, which increases the probability of further declines.
How did this decline affect the very short-term picture? Let’s check.
Quoting our previous alert:
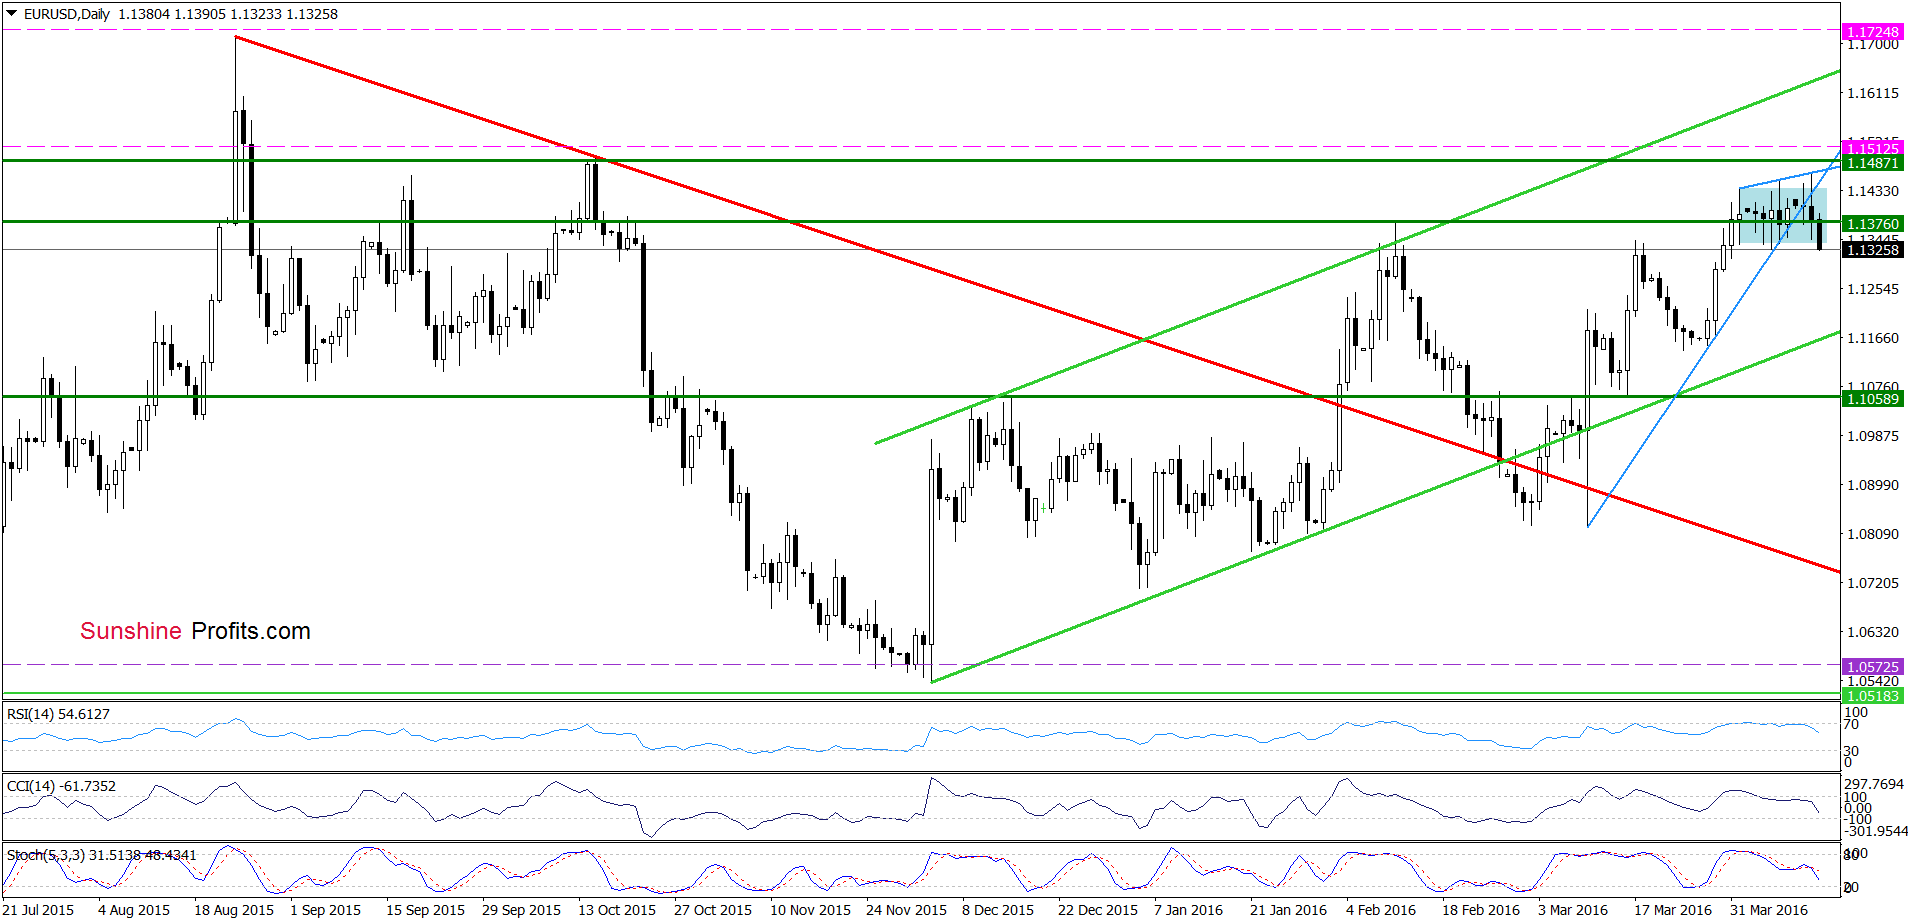
(…) although EUR/USD moved higher earlier today and climbed above the upper line of the blue consolidation, this improvement was temporary as the blue resistance line (based on the previous highs) in combination with the proximity to the Oct high encouraged currency bears to act. As a result, the pair pulled back under the blue raising support line, which suggests further deterioration. Nevertheless, such price action would be more likely if the exchange rate closes today’s session below it.
As you see on the daily chart the situation developed in line with the above scenario and EUR/USD closed yesterday’s session below the blue raising support line, which is also lower border of the blue rising wedge. This negative signal triggered further deterioration earlier today, which resulted in a drop under the lower border of the blue consolidation. This is a bearish sign, which in combination with sell signals generated by the indicators suggests further deterioration in the coming days. How low could the pair go? In our opinion, the first downside target would be around 1.1219, where the 38.2% Fibonacci retracement (based on Mar-Apr upward move) is. If it is broken, we’ll see a test of the support zone created by the late-March lows and the 50% retracement in the coming days.
Very short-term outlook: bearish
Short-term outlook: bearish
MT outlook: mixed with bearish bias
LT outlook: mixed
Trading position (short-term; our opinion): Short positions (with a stop-loss order at 1.1512 and the initial downside target at 1.0572) are justified from the risk/reward perspective. We will keep you informed should anything change, or should we see a confirmation/invalidation of the above.
USD/CAD
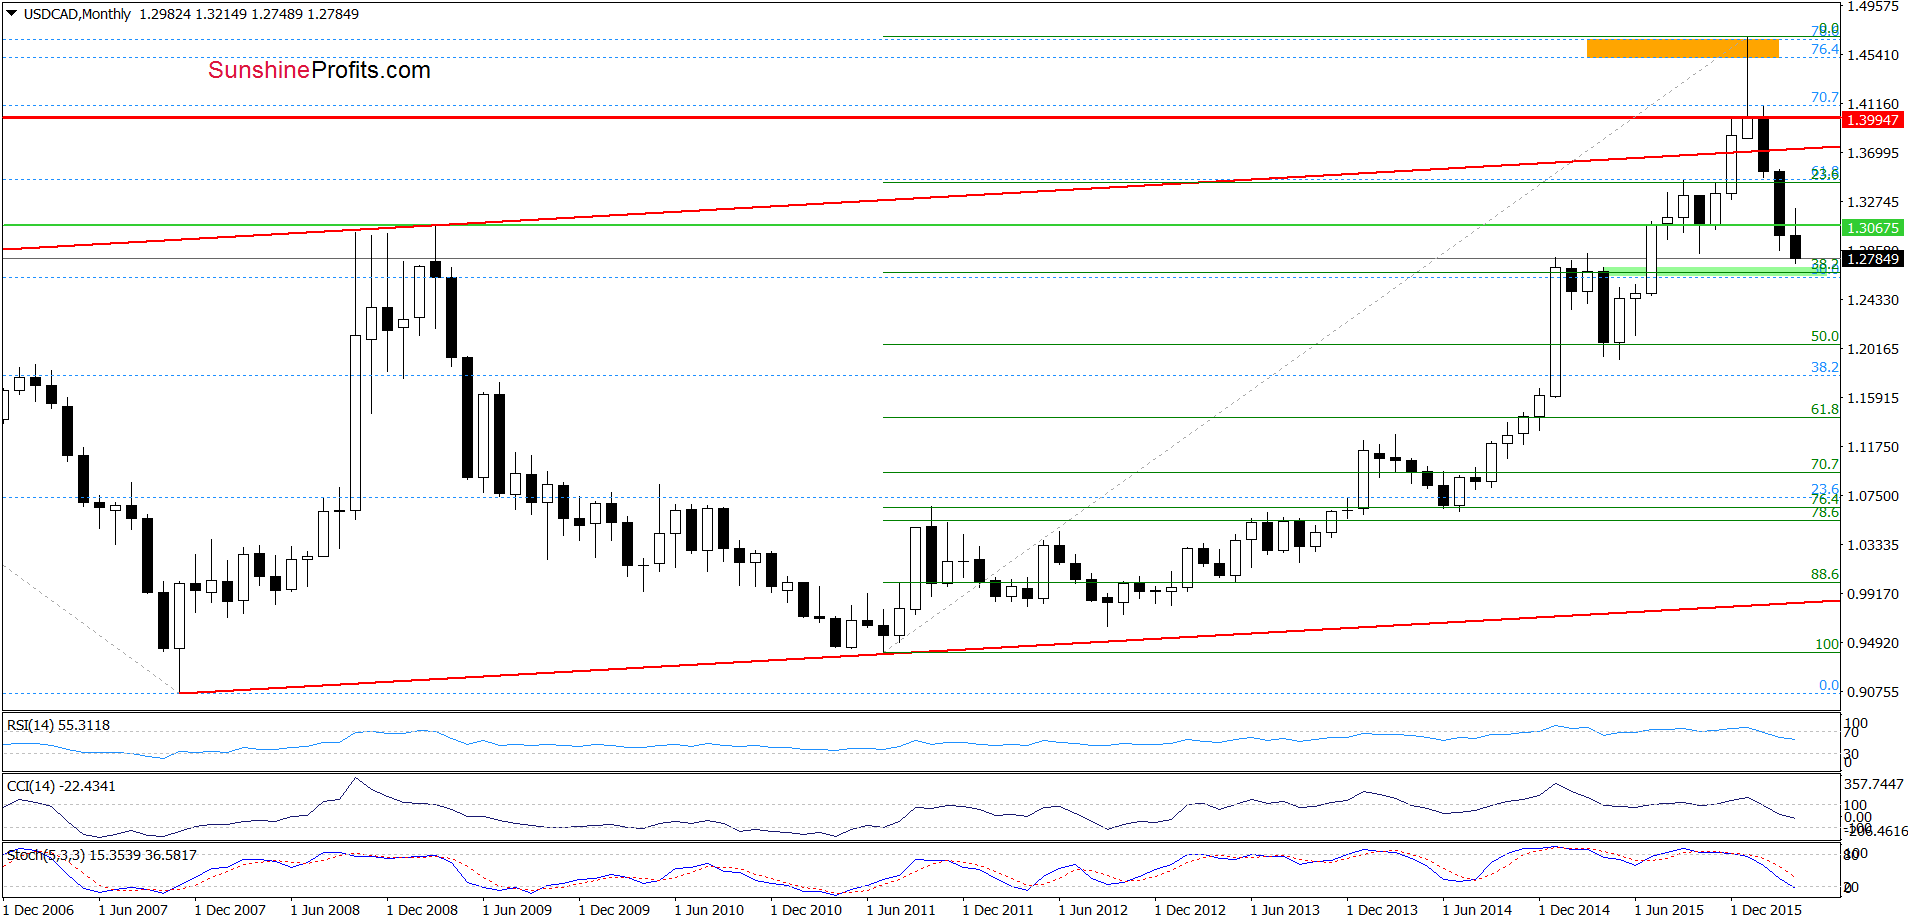
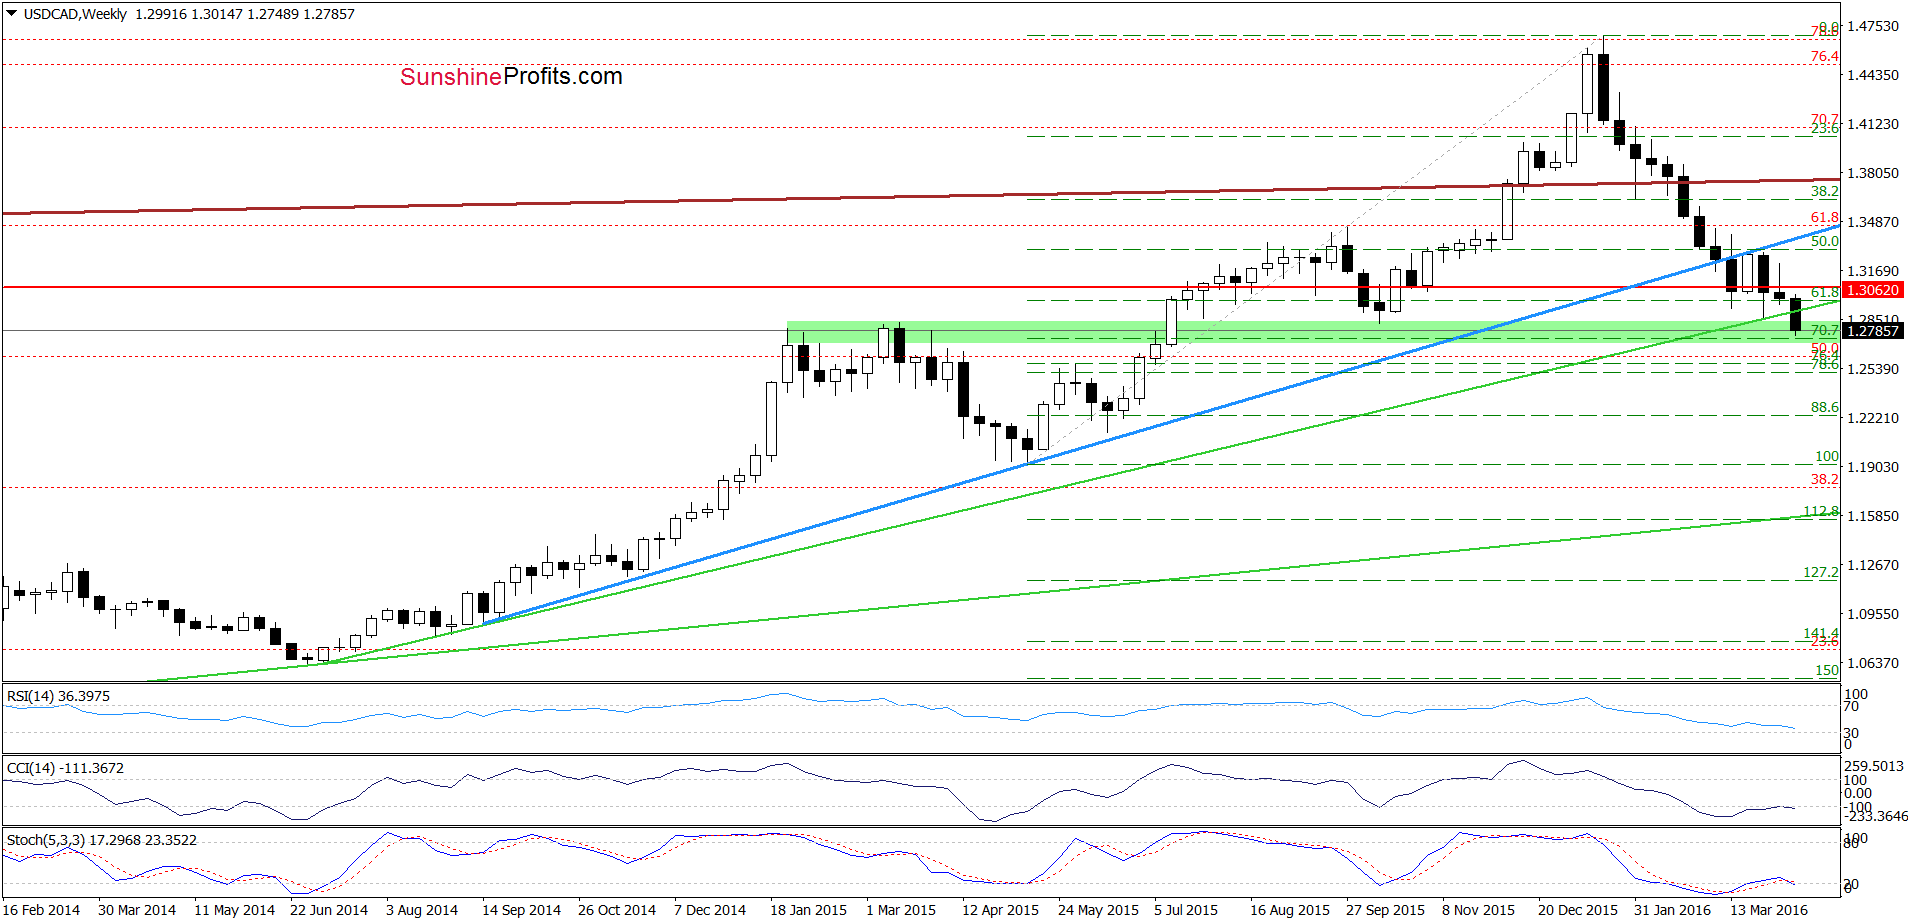
Looking at the long- and medium-term picture of USD/CAD we see that the pair declined under the long-term green support line, which resulted in a drop to the green support zone created by the Jan and March 2015 highs and reinforced by the 70.7% Fibonacci retracement (based on May-Jan rally). Taking this fact into account, we think that reversal is just around the corner – even if the exchange rate moves lower once again and test the strength of the 38.2% Fibonacci retracement based on the entire Jul 2011-Jan 2016 upward move (around 1.2666) in the coming week.
Very short-term outlook: mixed
Short-term outlook: mixed
MT outlook: mixed
LT outlook: mixed
Trading position (short-term; our opinion): No positions are justified from the risk/reward perspective at the moment. We will keep you informed should anything change, or should we see a confirmation/invalidation of the above.
USD/CHF
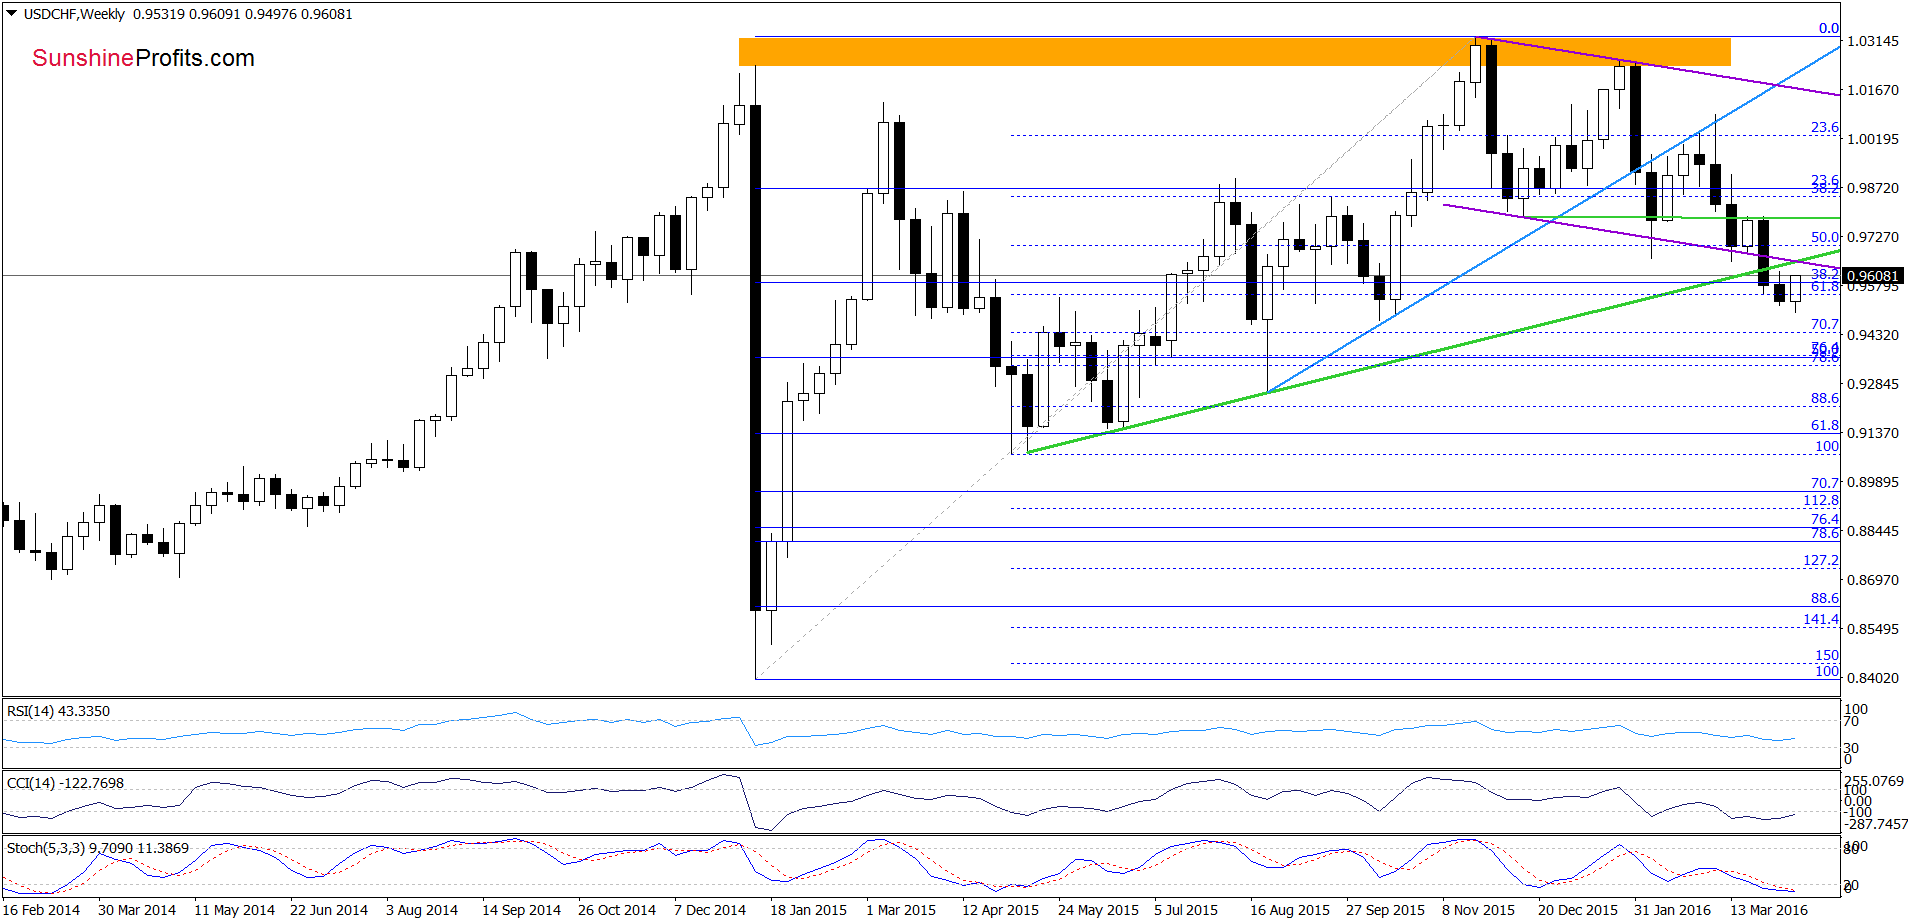
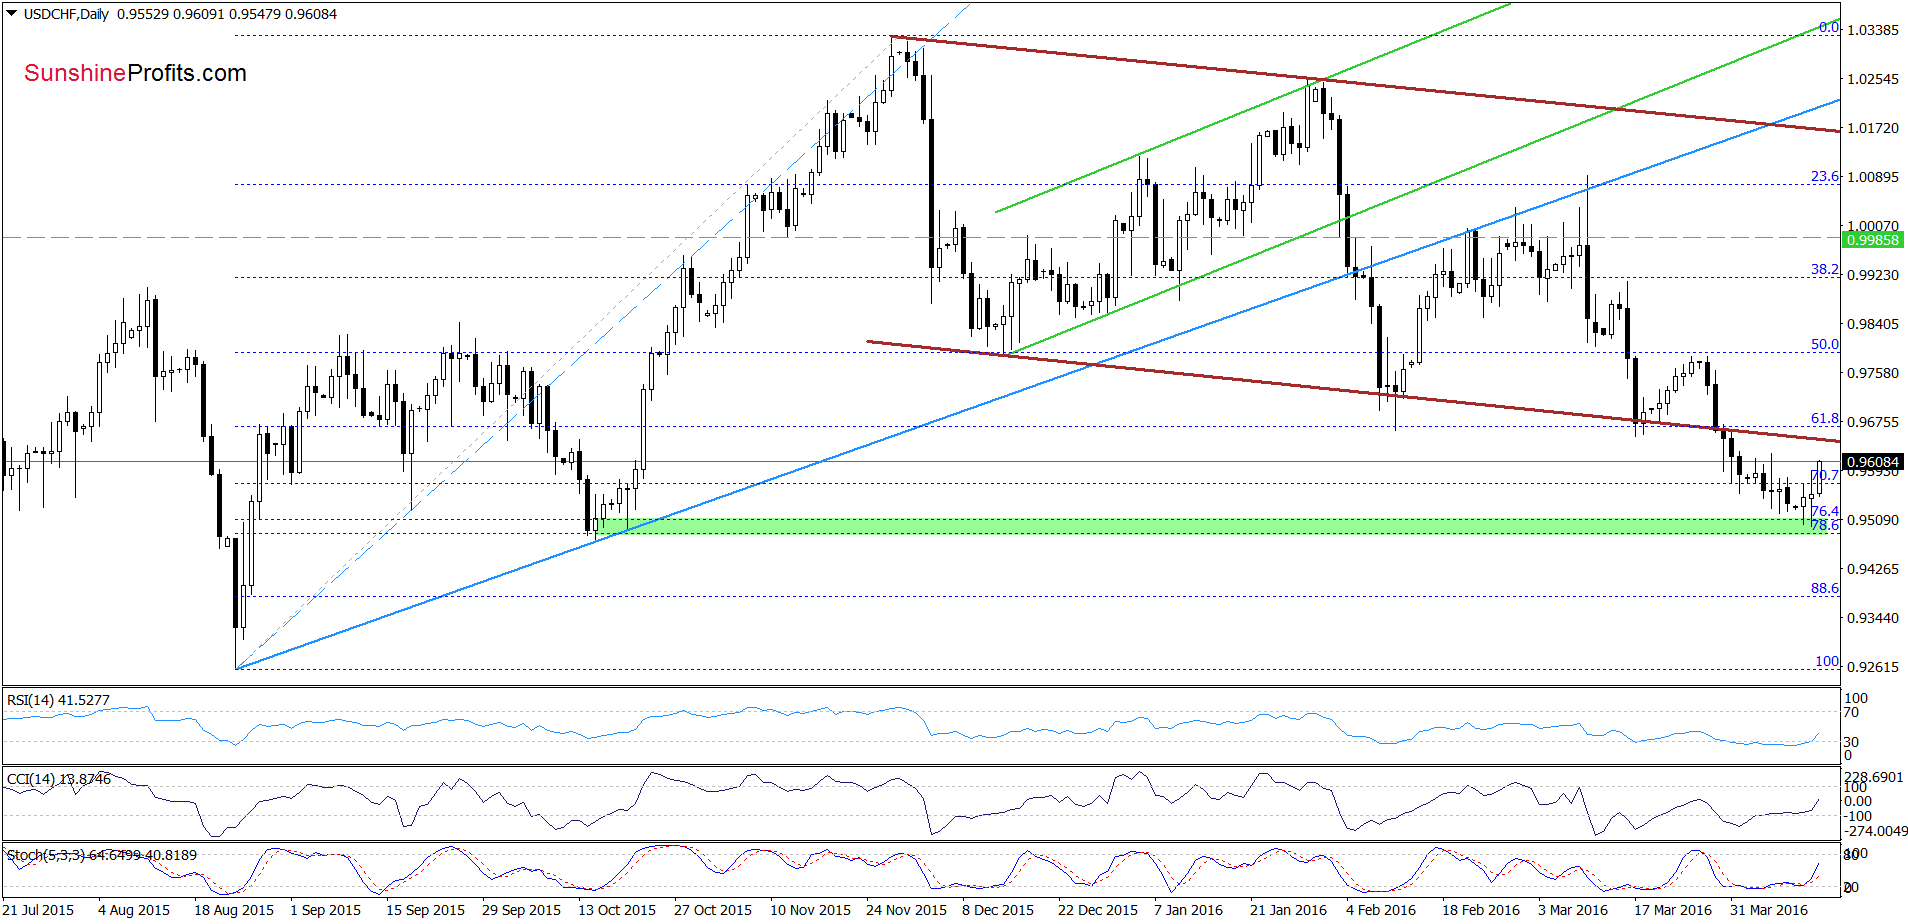
Looking at the above charts, we see that although USD/CHF moved little lower yesterday, the green support zone marked on the daily chart (created by the 76.4% and 78.6% Fibonacci retracement levels based on entire Aug-Nov upward move) encouraged currency bulls to act, which resulted in a rebound. Earlier today, the exchange rate extended gains, which in combination with buy signals generated by the daily indicators suggests a test of the lower border of the brown declining trend channel and the green support/resistance line (marked on the weekly chart) in the coming day(s). Nevertheless, as long as there won’t be invalidation of the breakdown under these lines further improvement is questionable.
Very short-term outlook: mixed with bullish bias
Short-term outlook: mixed with bullish bias
MT outlook: mixed
LT outlook: mixed
Trading position (short-term; our opinion): No positions are justified from the risk/reward perspective. We will keep you informed should anything change, or should we see a confirmation/invalidation of the above.
Thank you.
Nadia Simmons
Forex & Oil Trading Strategist
Przemyslaw Radomski, CFA
Founder, Editor-in-chief
Gold & Silver Trading Alerts
Forex Trading Alerts
Oil Investment Updates
Oil Trading Alerts
