

Forex Trading Alert originally sent to subscribers on April 5, 2016, 4:25 AM.
Earlier today, official data showed that German factory orders dropped by 1.2% in Feb, which weighed negatively on investors’ sentiment and pushed the euro lower against the greenback. As a result, EUR/USD slipped under the Feb high. What does it mean for the exchange rate?
In our opinion the following forex trading positions are justified - summary:
- EUR/USD: short (stop-loss order at 1.1512; initial downside target at 1.0572)
- GBP/USD: none
- USD/JPY: none
- USD/CAD: none
- USD/CHF: none
- AUD/USD: none
EUR/USD
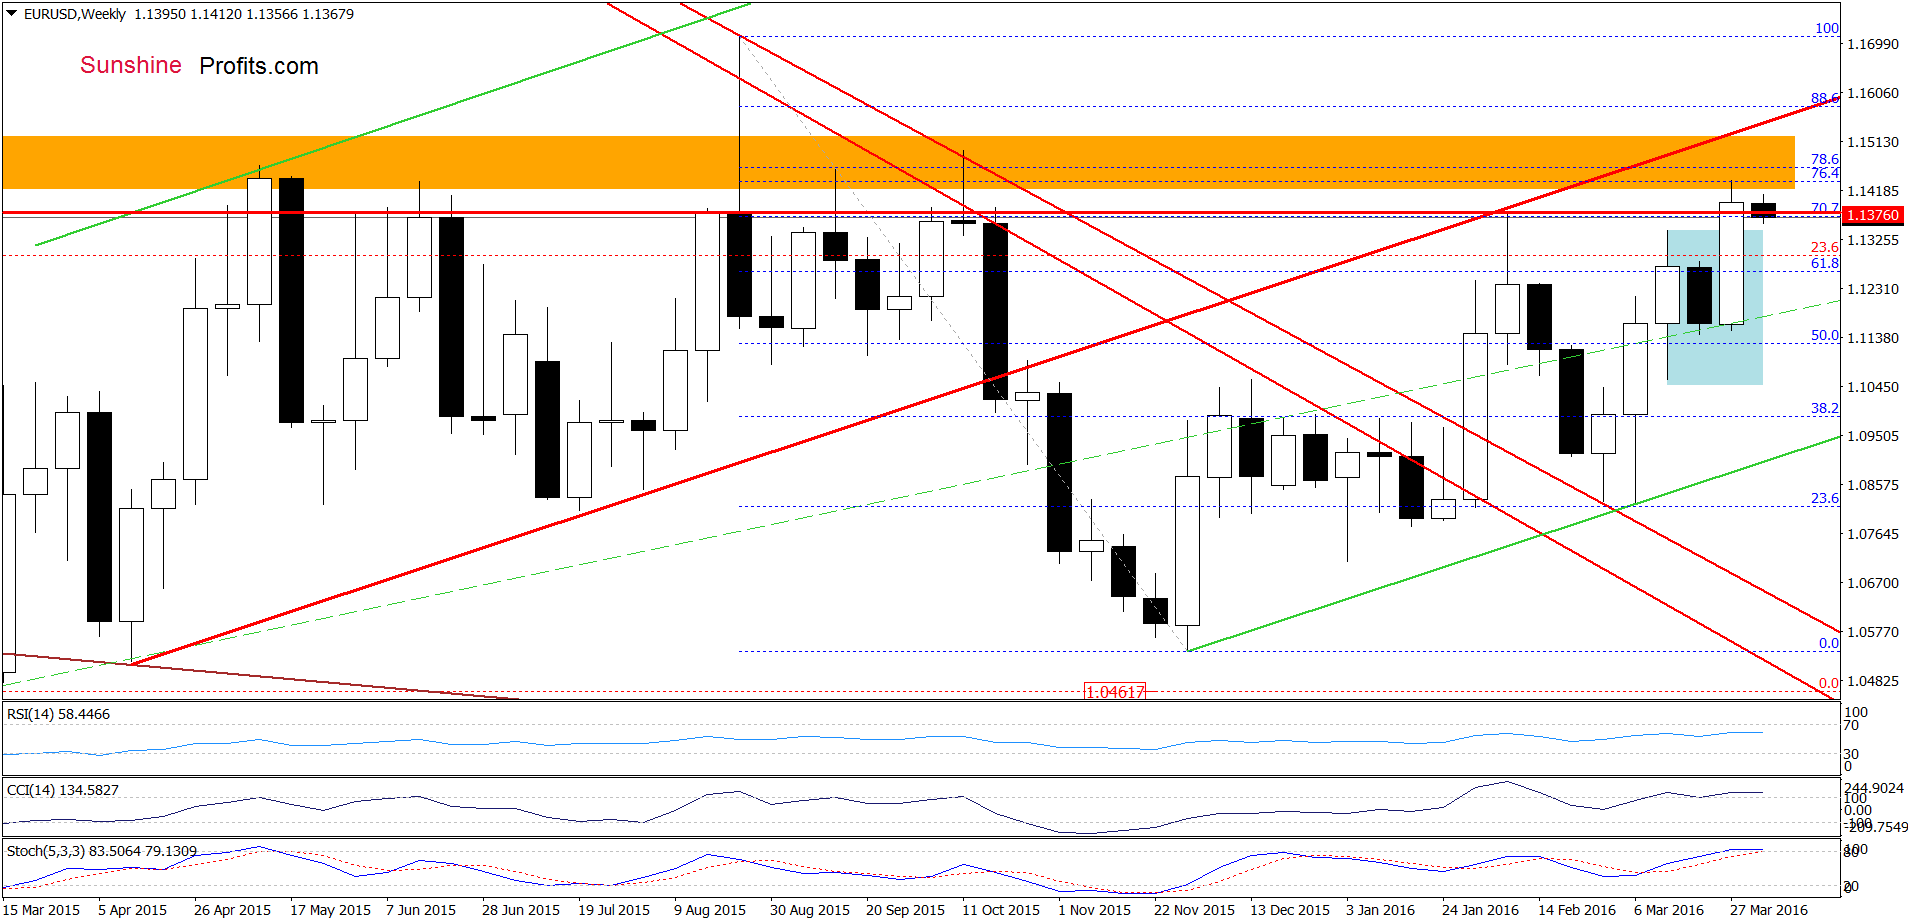
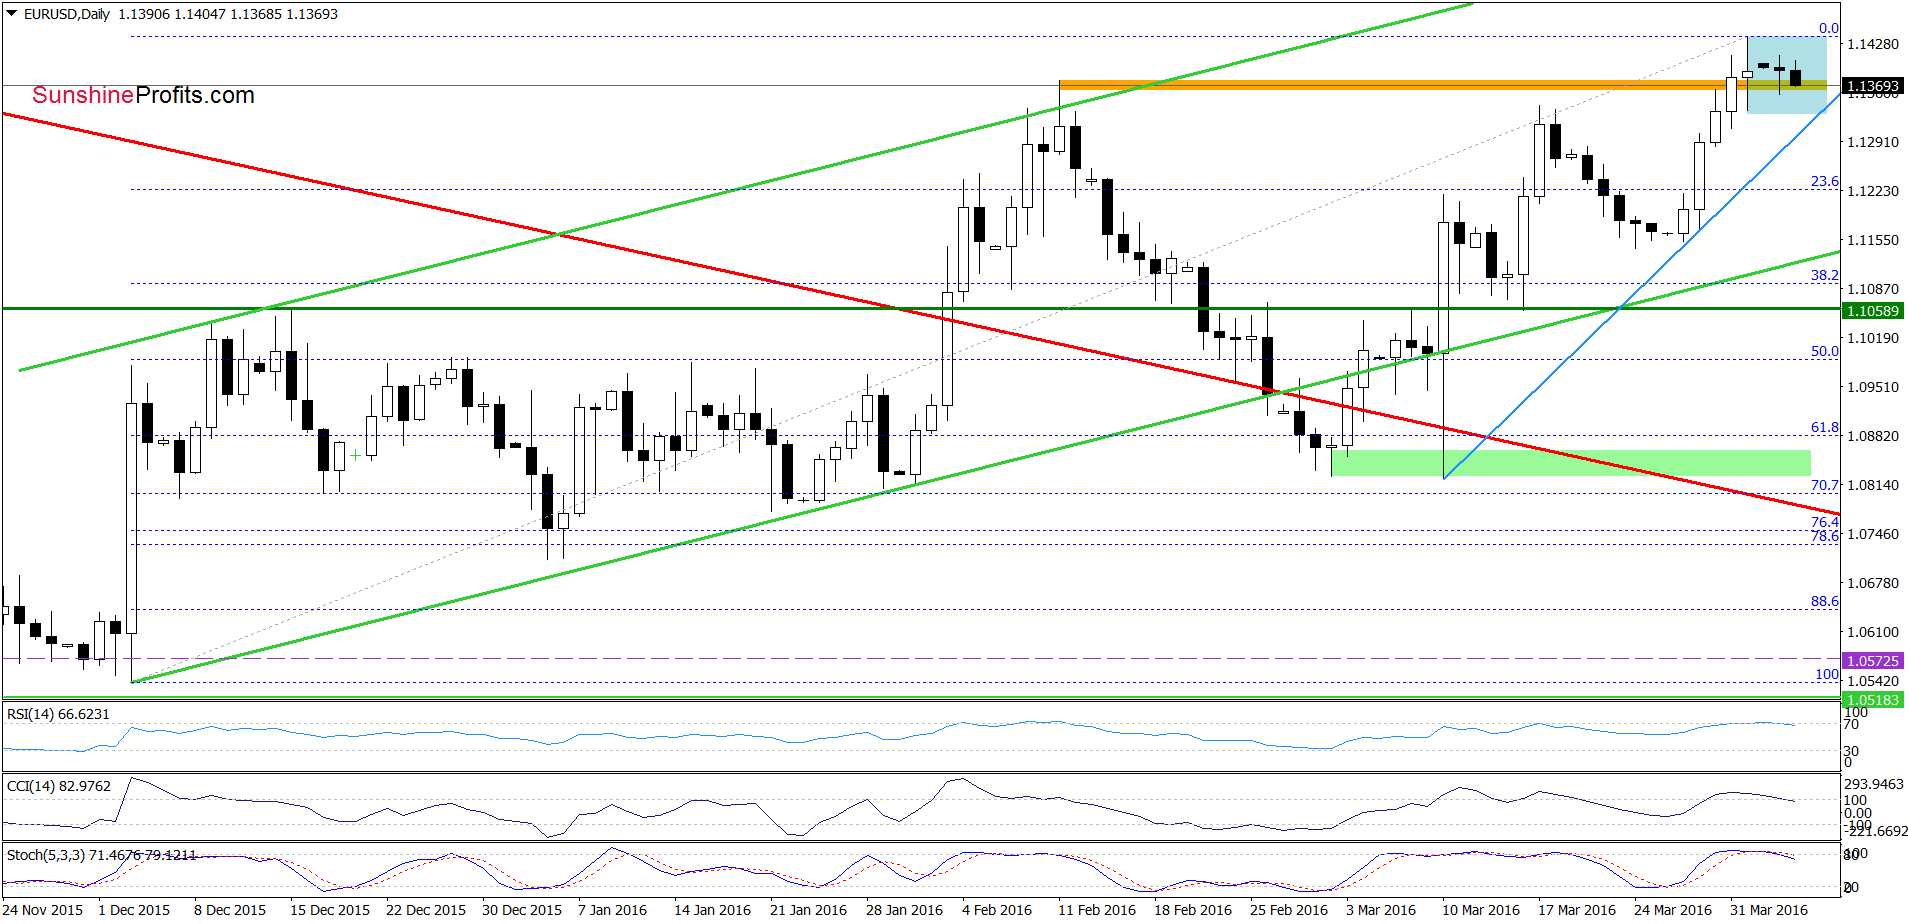
Looking at the above charts, we see that although EUR/USD moved little higher yesterday, currency bulls didn’t manage to push the pair higher, which resulted in another drop under the previously-broken Feb high earlier today. Therefore, what we wrote in our previous commentary is up-to-date:
(…) Although this is a negative signal (an invalidation of the breakout), we think that it would be more reliable if we see a daily closure below the orange area. Finishing today’s commentary on this currency pair, it is worth noting that all indicators are overbought and very close to generating sell signals ,which suggests that further deterioration is just around the corner.
Very short-term outlook: bearish
Short-term outlook: bearish
MT outlook: mixed with bearish bias
LT outlook: mixed
Trading position (short-term; our opinion): Short positions (with a stop-loss order at 1.1512 and the initial downside target at 1.0572) are justified from the risk/reward perspective. We will keep you informed should anything change, or should we see a confirmation/invalidation of the above.
USD/JPY
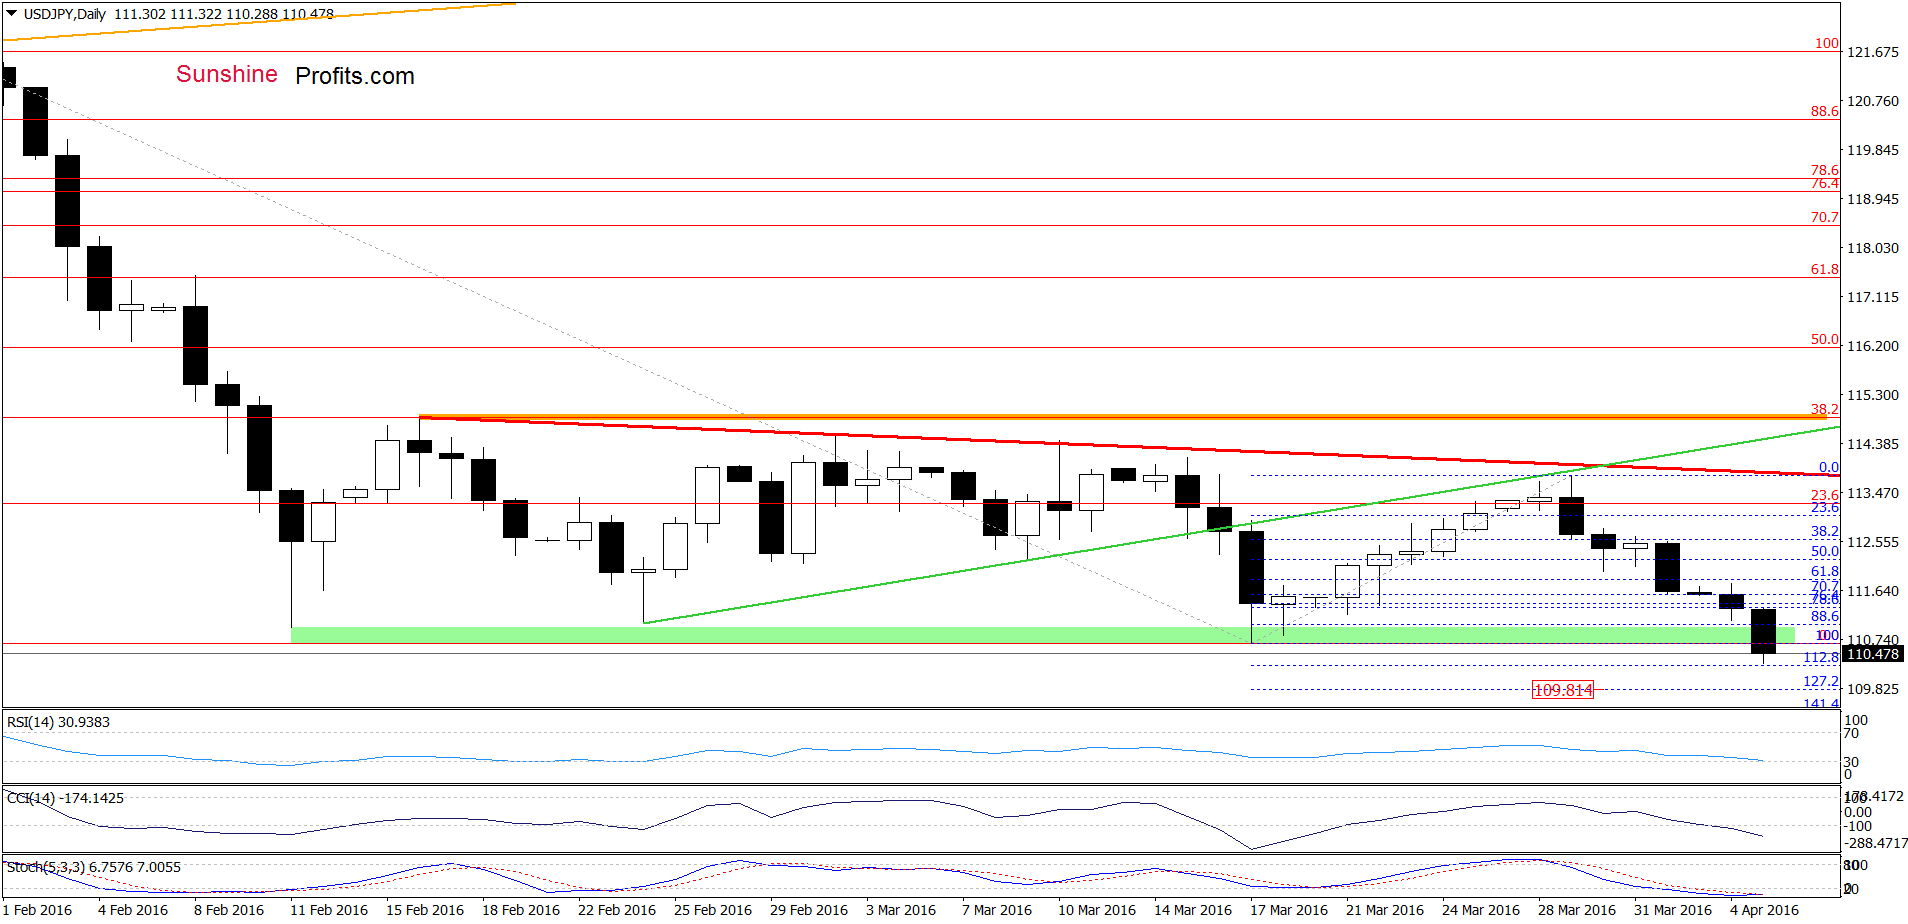
On Thursday, we wrote the following:
(…) if the pair extends losses, we may see a drop even to around 111.34-111.41, where the support area created by the 76.4% and 78.6% Fibonacci retracement levels is.
Yesterday, we added:
From today’s point of view, we see that the situation developed in line with the above scenario and USD/JPY reached our downside target earlier today. Although the pair could rebound from here, it seems to us that the exchange rate will re-test the strength of the green support zone in the coming week.
Looking at the above charts, we see that currency bears pushed USD/JPY lower as we had expected. With today’s downswing, the pair not reached our next downside target, but also declined below it. This is a negative signal which suggests further deterioration and a drop to around 109.81, where the 127.2% Fibonacci extension is.
Are there any factors that could encourage currency bulls to act? Let’s examine the weekly chart and find out.
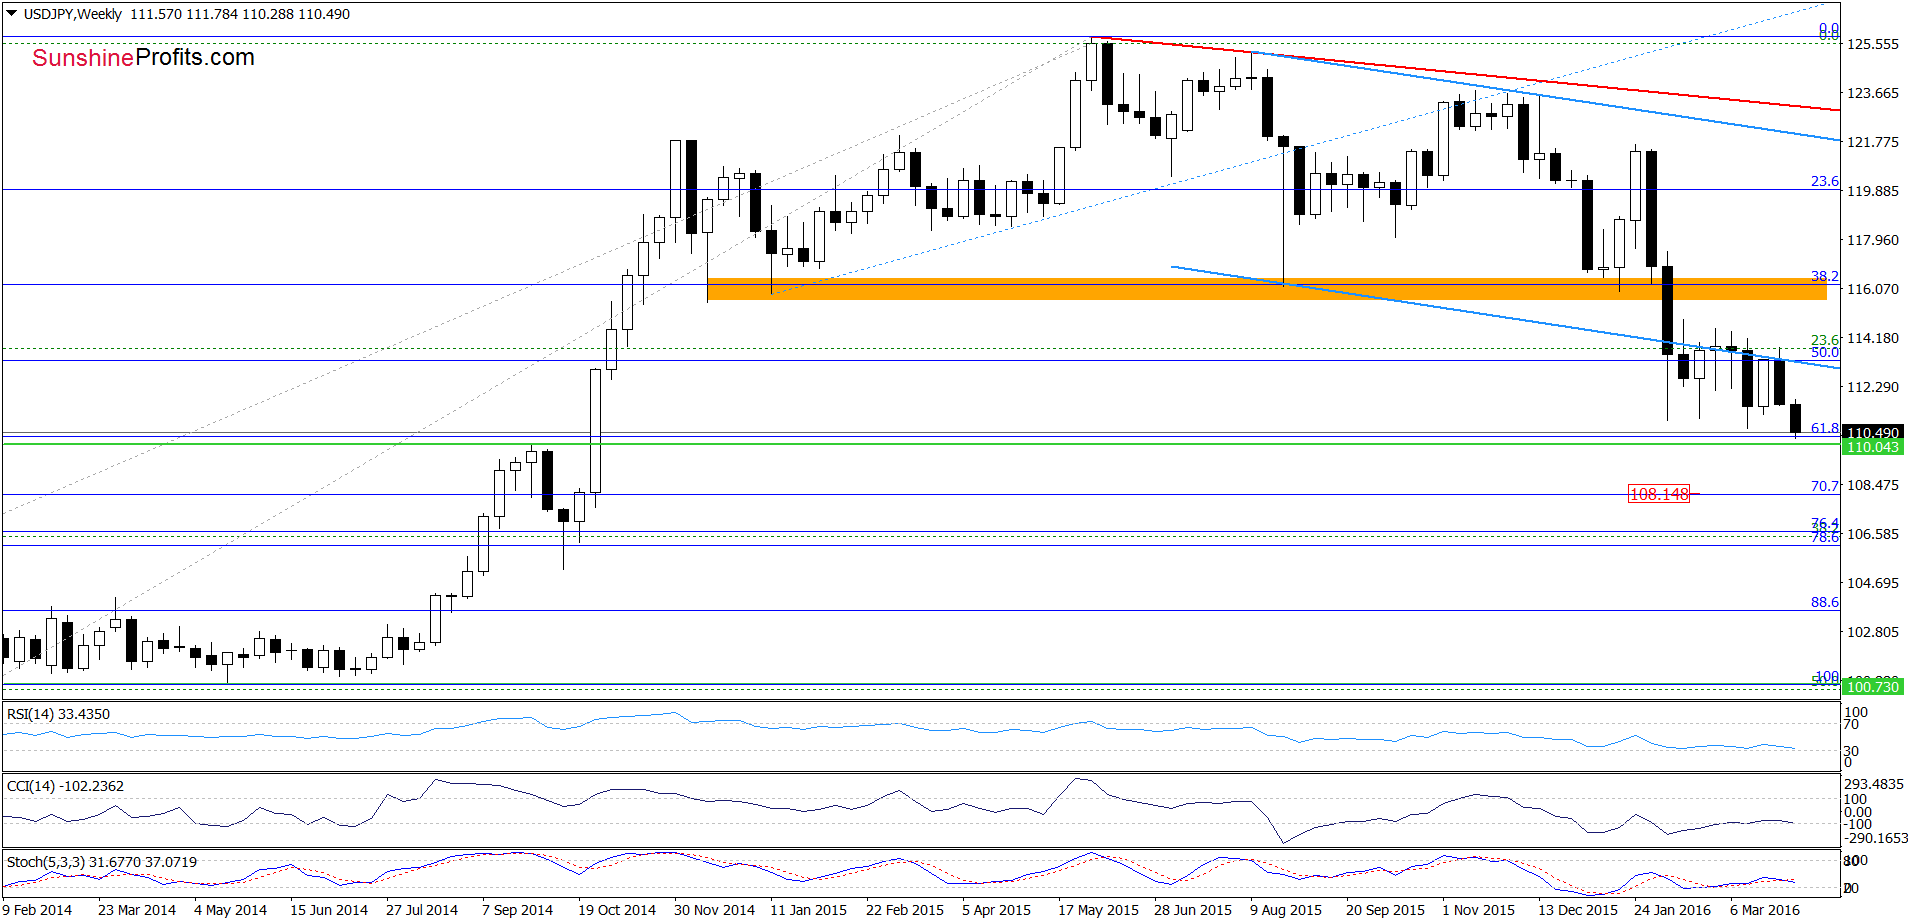
From this perspective, we see that USD/JPY dropped to the 61.8% Fibonacci retracement, which could trigger a rebound (especially when we factor in the proximity to the green support line based on the Sept high of 110.07). However, if this support area is broken, the exchange rate could extend declines even to around 108.14, where the 70.7% Fibonacci retracement is.
Very short-term outlook: mixed with bearish bias
Short-term outlook: mixed
MT outlook: mixed
LT outlook: mixed
Trading position (short-term; our opinion): No positions are justified from the risk/reward perspective at the moment. We will keep you informed should anything change, or should we see a confirmation/invalidation of the above.
USD/CAD
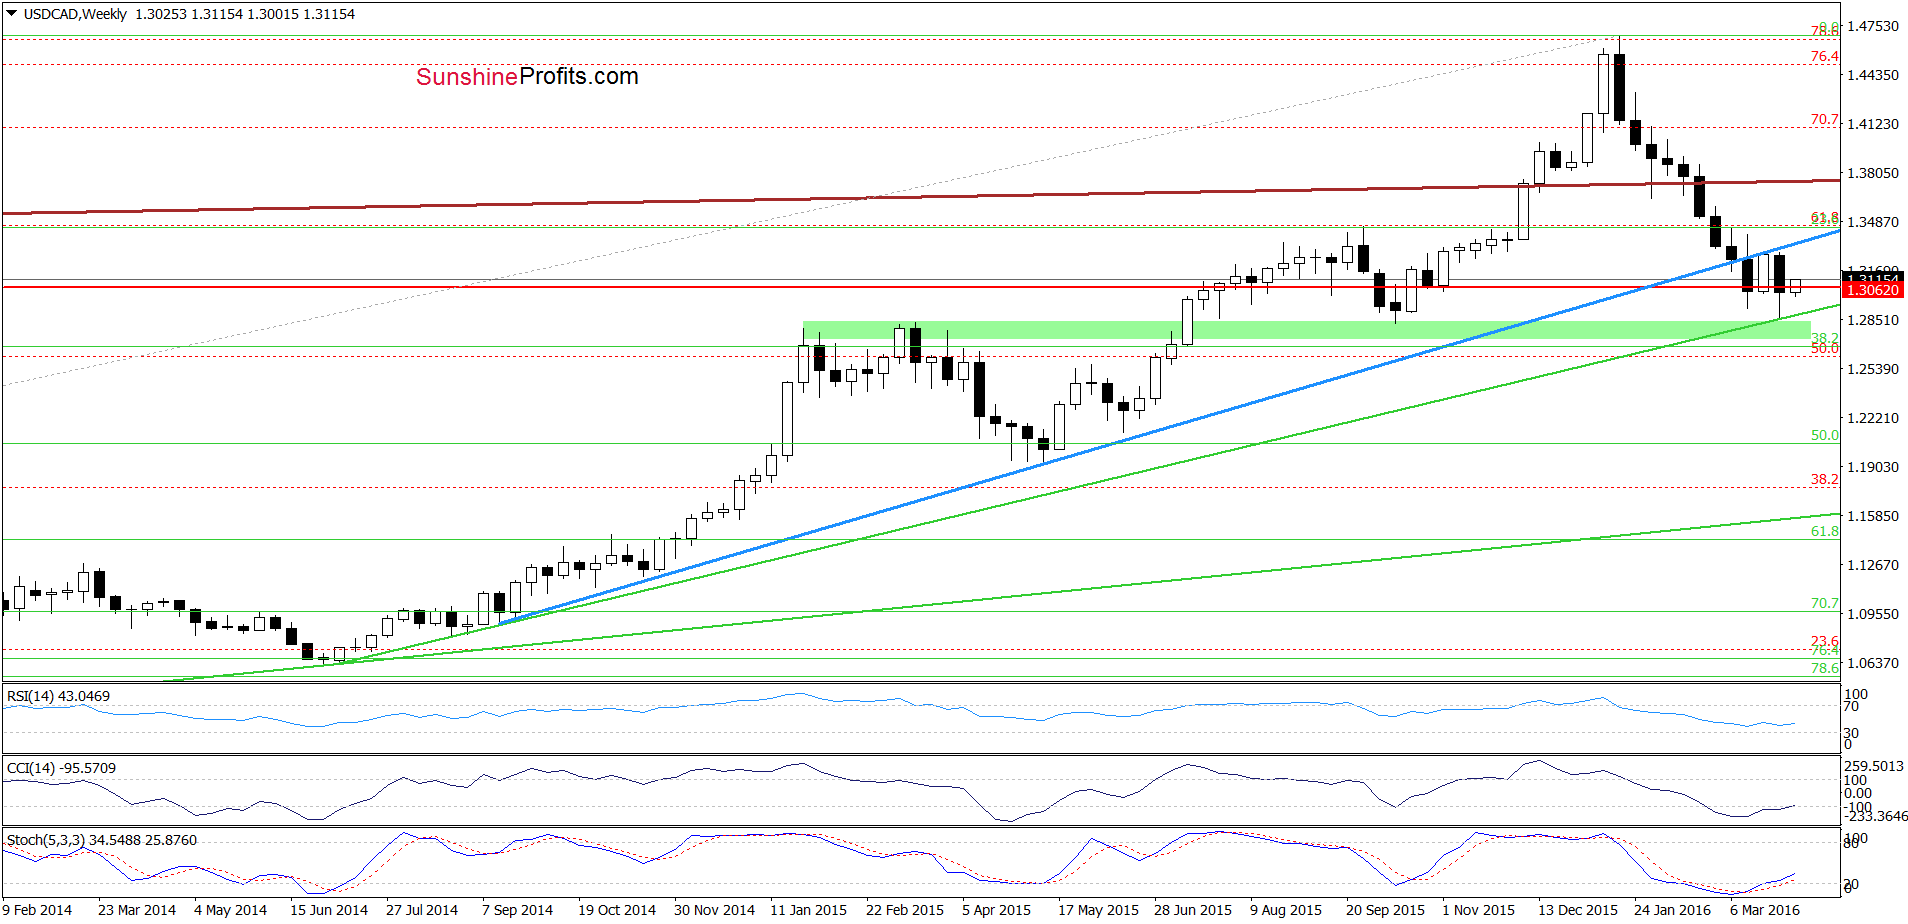
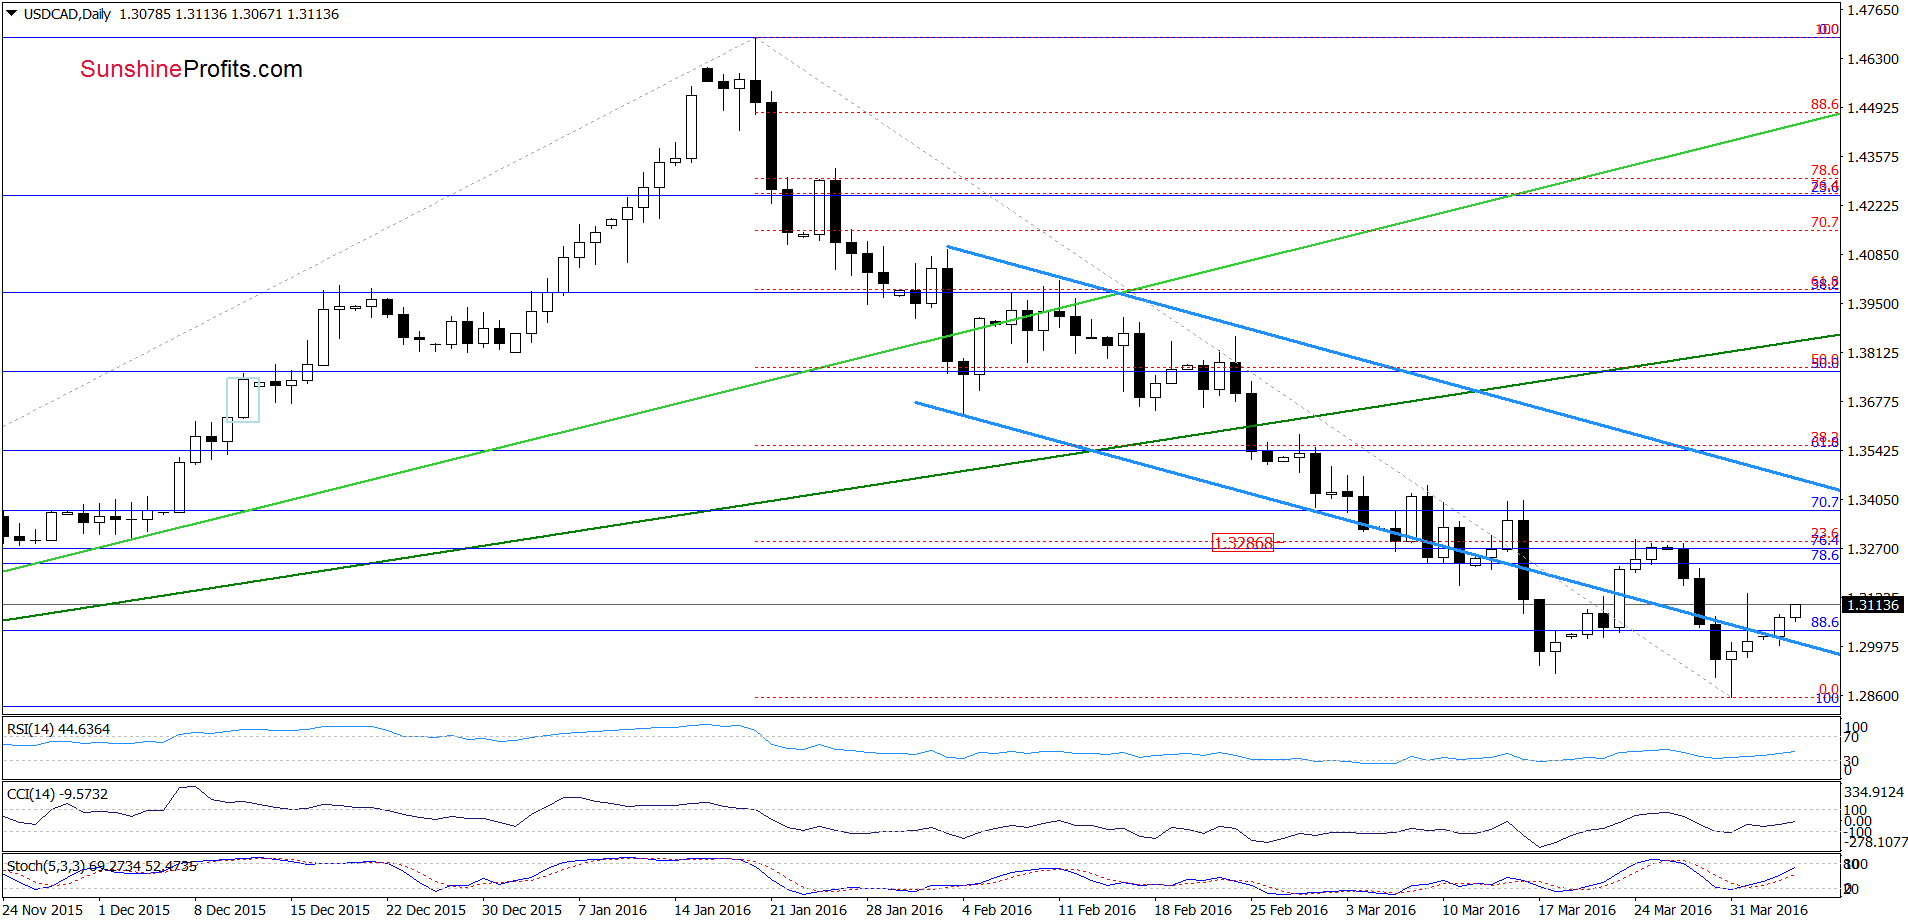
From today’s point of view we see that USD/CAD extended gains, which means that what we wrote yesterday is up-to-date:
(…) currency bears pushed the pair lower in the previous week, which resulted in a drop to the medium-term green support line (as we had expected). As you see, this support triggered a rebound, which took USD/CAD above the lower border of the blue declining trend channel. Additionally, all indicators generated buy signals, which suggest further improvement. Nevertheless, in our opinion, such price action would be more reliable if we see a daily closure above this line. If this is the case and currency bulls manage to push the pair higher from here, the initial upside target would be around 1.3281, where the 23.6% Fibonacci retracement (based on the entire downward move) and late-March highs are.
Very short-term outlook: mixed with bullish bias
Short-term outlook: mixed
MT outlook: mixed
LT outlook: mixed
Trading position (short-term; our opinion): No positions are justified from the risk/reward perspective at the moment. We will keep you informed should anything change, or should we see a confirmation/invalidation of the above.
Thank you.
Nadia Simmons
Forex & Oil Trading Strategist
Przemyslaw Radomski, CFA
Founder, Editor-in-chief
Gold & Silver Trading Alerts
Forex Trading Alerts
Oil Investment Updates
Oil Trading Alerts
