

Forex Trading Alert originally sent to subscribers on November 5, 2015, 3:45 AM.
Yesterday’s ADP report showed that U.S. non-farm private employment rose by 182,000 last month, beating expectations for an increase of 180,000. Additionally, the U.S. Commerce Department said that the trade deficit declined to $40.81 billion in September also beating analysts’ forecasts. On top of that the Institute of Supply Management showed that its non-manufacturing PMI rose to 59.1 last month well above forecasts of 56.5. Thanks to these bullish numbers, the U.S. dollar extended gains against the yen, which resulted in a climb to the Aug high. Will we see higher values of the exchange rate in the coming days?
In our opinion the following forex trading positions are justified - summary:
- EUR/USD: short (stop-loss order at 1.1476; initial downside target around 1.0462)
- GBP/USD: none
- USD/JPY: none
- USD/CAD: none
- USD/CHF: none
- AUD/USD: none
EUR/USD
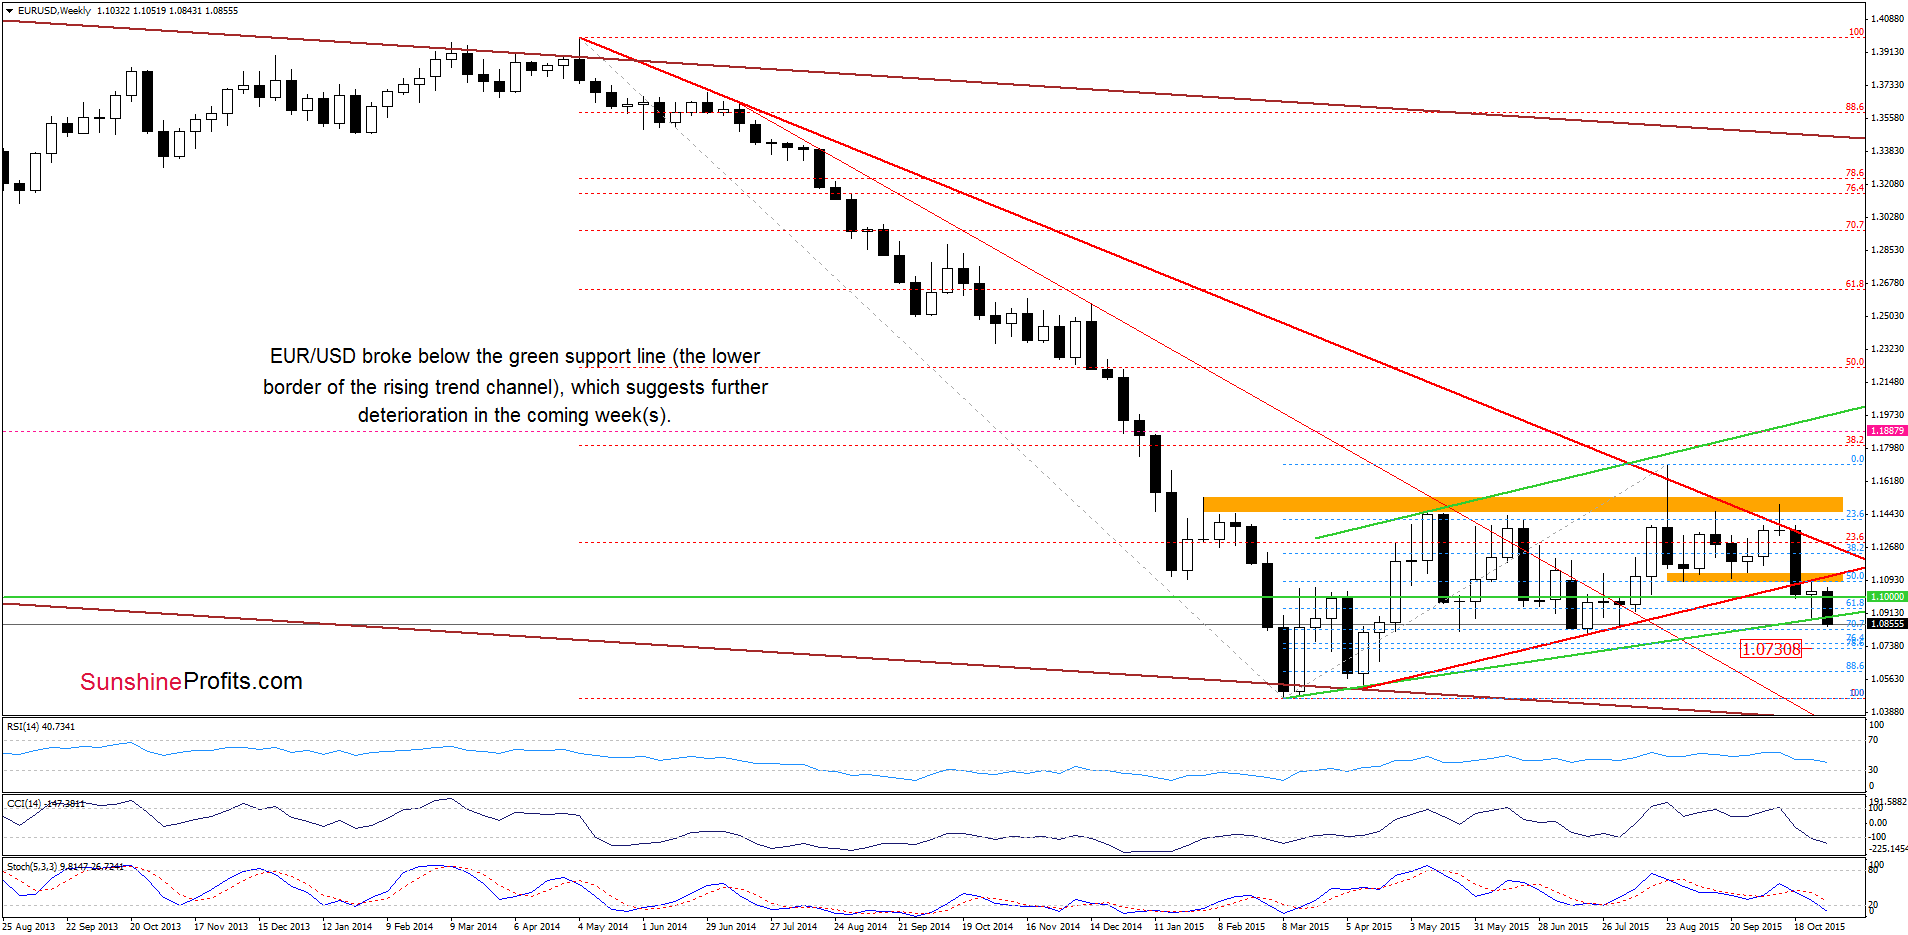
The situation in the medium term has deteriorated as EUR/USD dropped under the green support line (the lower border of the rising trend channel), which suggests further deterioration in the coming week(s).
How low could the pair go? Let’s examine the daily chart and find out.
Yesterday, we wrote the following:
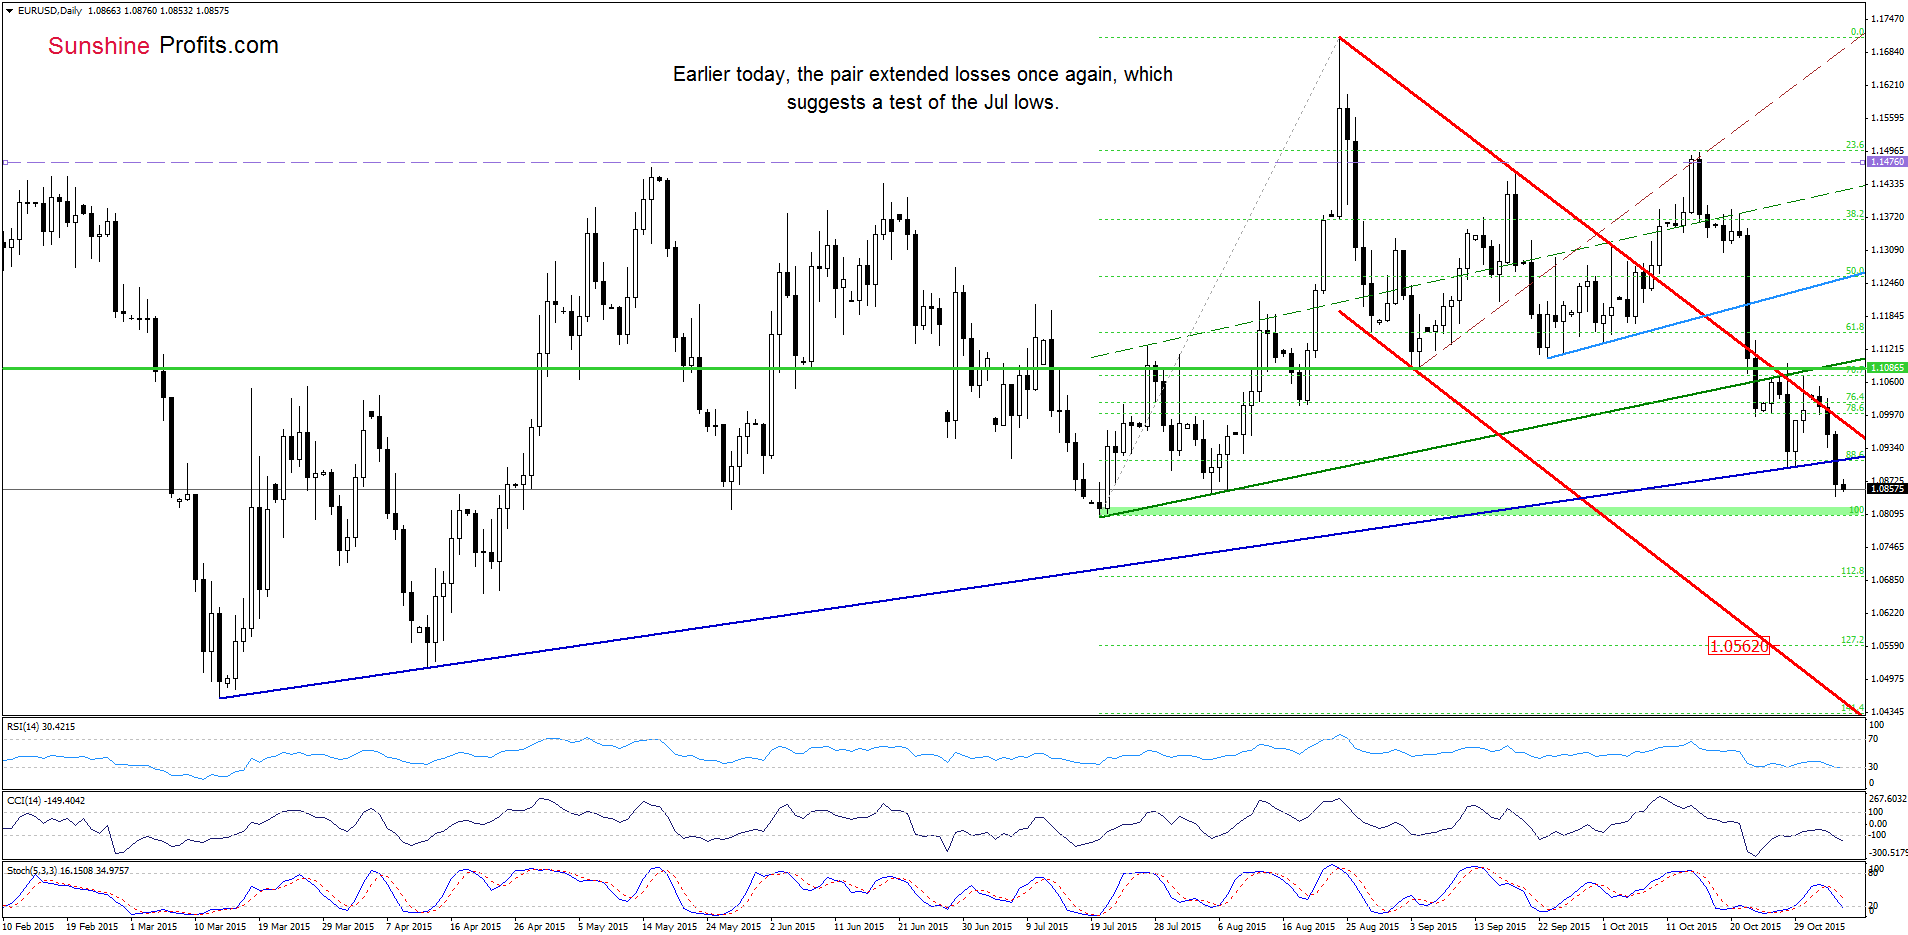
(…) a sell signal generated by the daily indicator in combination with the fact the pair verified earlier breakdown below the medium-term support/resistance line (marked with red on the weekly chart) suggests that currency bears will try to push the pair lower.
As you see on the daily chart, EUR/USD extended losses once again (as we had expected) and dropped under the navy blue support line, which means that the first downside target from yesterday’s alert would be in play in the coming day:
(…) If (…) EUR/USD declines below the above-mentioned key support line, it would be a strong negative signal, which will trigger a drop to the green support zone based on Jul lows (around 1.0808-1.0821) in the coming days.
Finishing today’s commentary on this currency pair please note that if the above-mentioned support area doesn’t stop currency bears, the next downside target would be around 1.0730-1.0757, where the support zone created by the 76.4% and 78.6% Fibonacci retracement levels (based on the March-Aug rally) is.
Very short-term outlook: bearish
Short-term outlook: bearish
MT outlook: mixed with bearish bias
LT outlook: mixed
Trading position (short-term; our opinion): Short positions (which are profitable) with a stop-loss order at 1.1476 are justified from the risk/reward perspective. We will keep you informed should anything change, or should we see a confirmation/invalidation of the above.
USD/JPY
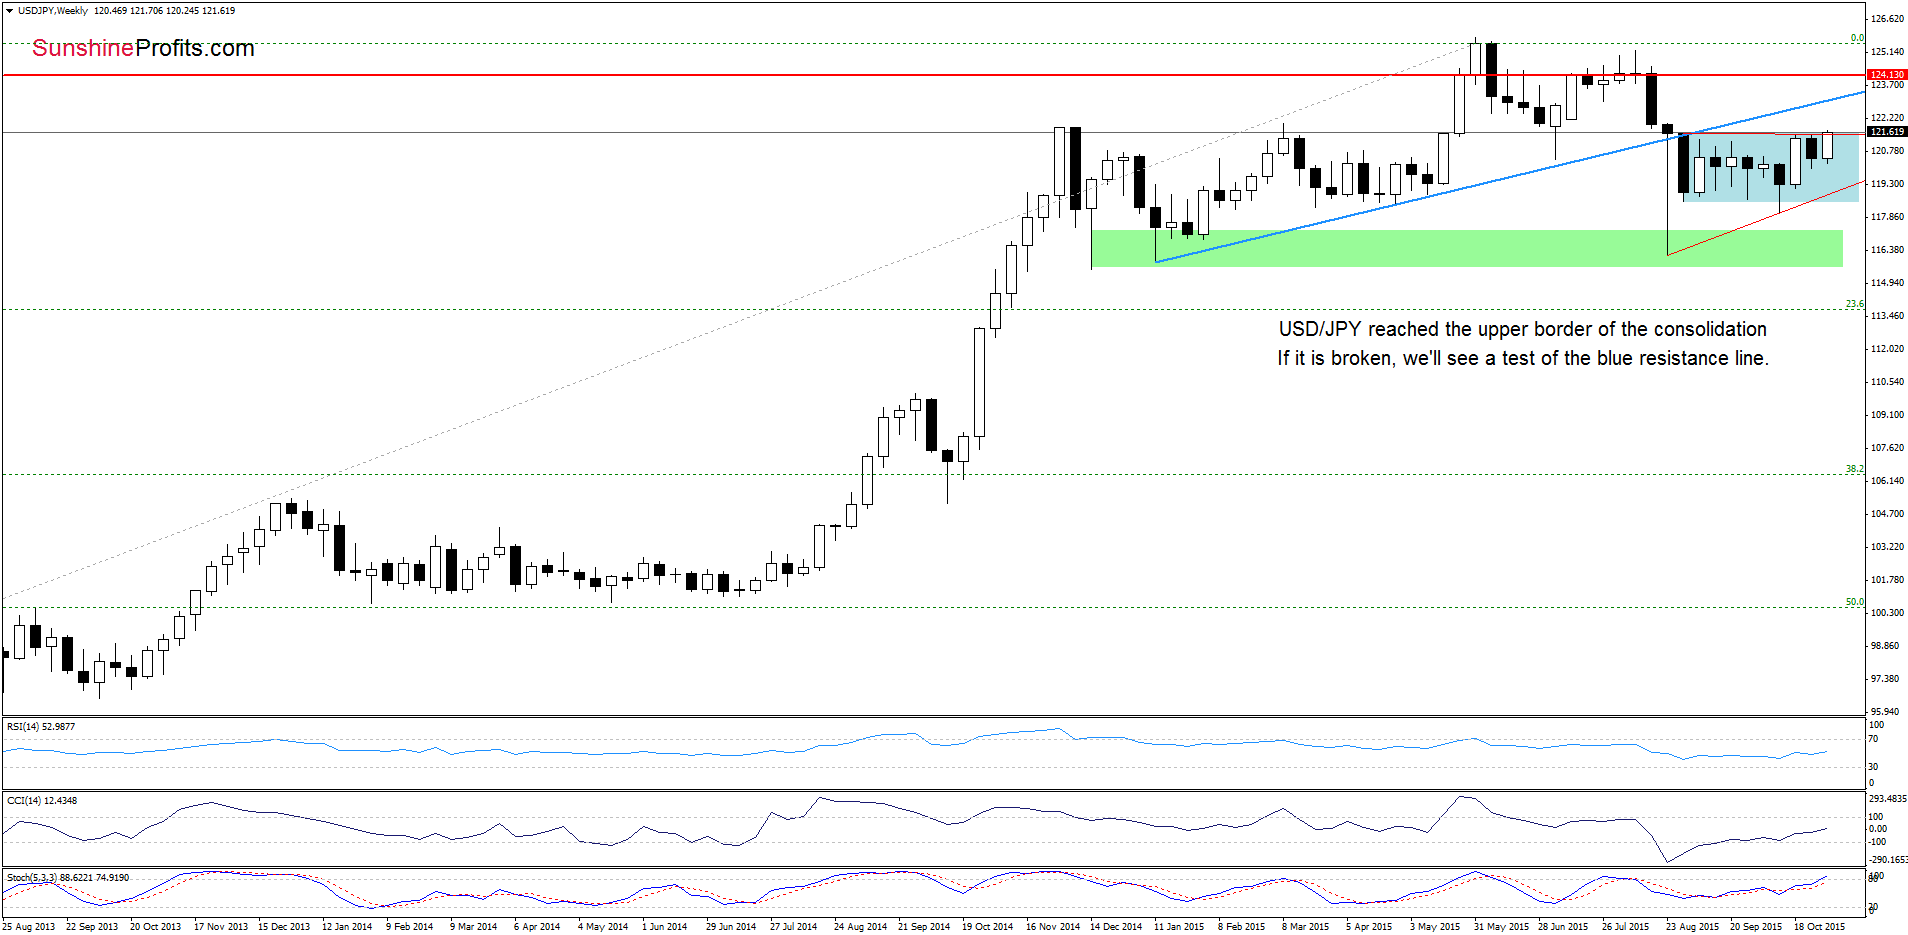
On the weekly chart, we see that USD/JPY reached the upper border of the consolidation. If currency bulls manage to push the pair above it, we may see a test of the blue resistance line in the coming weeks.
But will we see such price action? Let’s take a look at the daily chart and find out what can we infer from it.
Quoting our Tuesday’s alert:
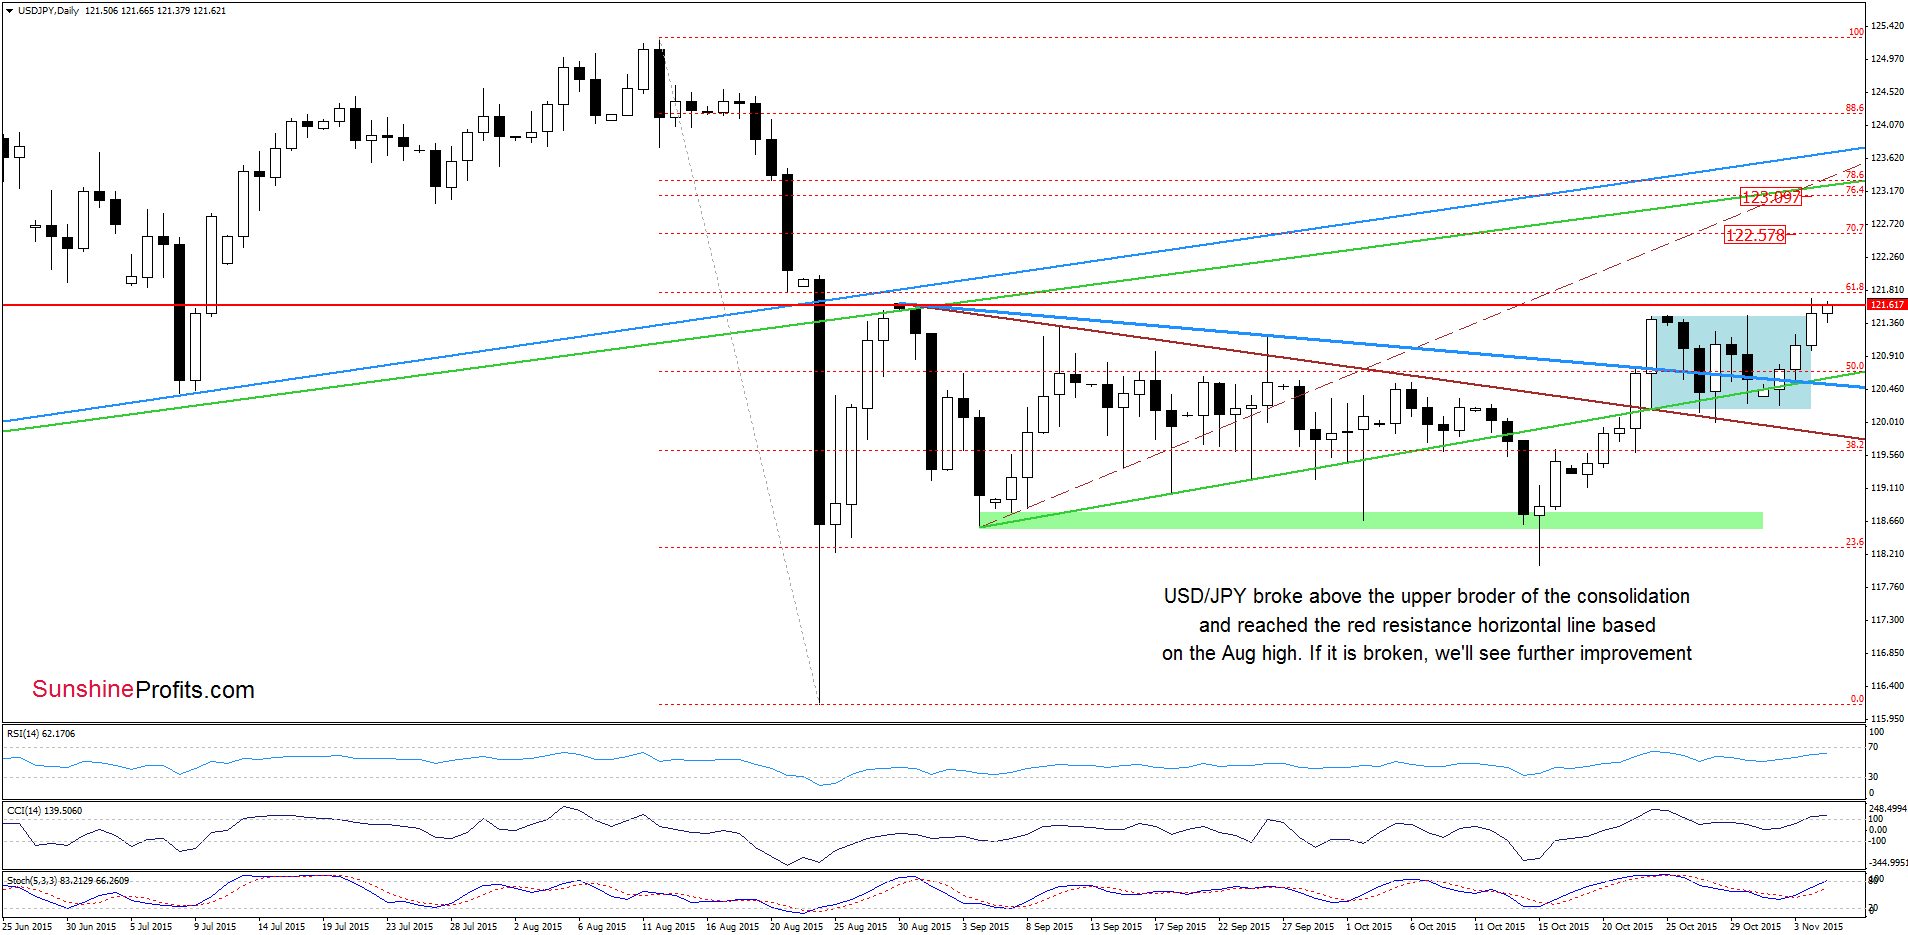
(…) the exchange rate is trading in the consolidation (marked with blue) between the green support line and the horizontal resistance line based on the Aug high. Therefore, we think that as long as there is no daily closure above/below the upper/lower border of the formation, another sizable move is not likely to be seen. However, (…) the exchange rate invalidated the breakdown below the blue support line, which is a positive signal that suggests a re-test of the upper border of the consolidation and the Aug high in the coming days.
From today’s point of view we see that the situation developed in line with the above scenario and USD/JPY not only reached our upside target, but currency bulls pushed the pair above it. With this upswing, the exchange rate climbed to slightly above the Aug high, which is another positive signal. On top of that, the current position of the indicators supports further improvement. Taking all the above into account, we think that currency bulls will try to break above the 61.8% Fibonacci retracement in the coming day. If they succeed, the next upside target would be the 70.7% retracement (around 122.57) or even the resistance area created by the 76.4%, 78.6% Fibonacci retracement levels and the long-term green resistance line.
Very short-term outlook: mixed with bullish bias
Short-term outlook: mixed
MT outlook: mixed
LT outlook: mixed
Trading position (short-term; our opinion): No positions are justified from the risk/reward perspective at the moment. We will keep you informed should anything change, or should we see a confirmation/invalidation of the above.
USD/CAD
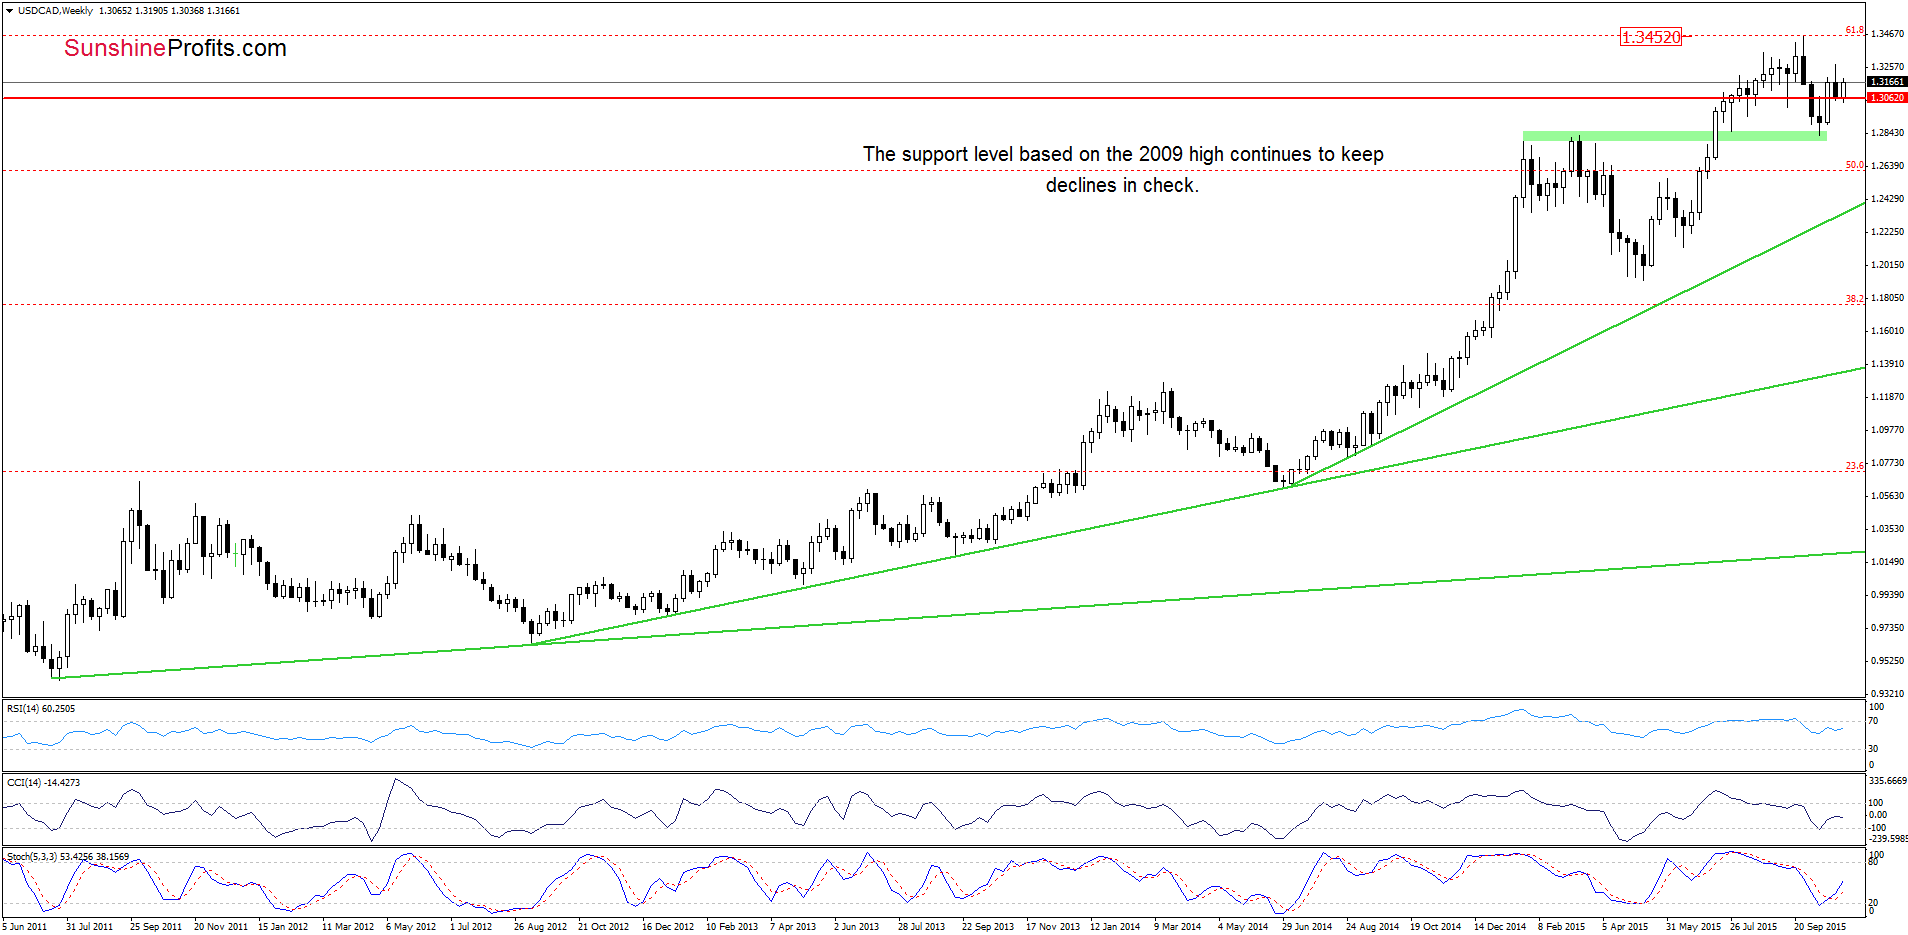
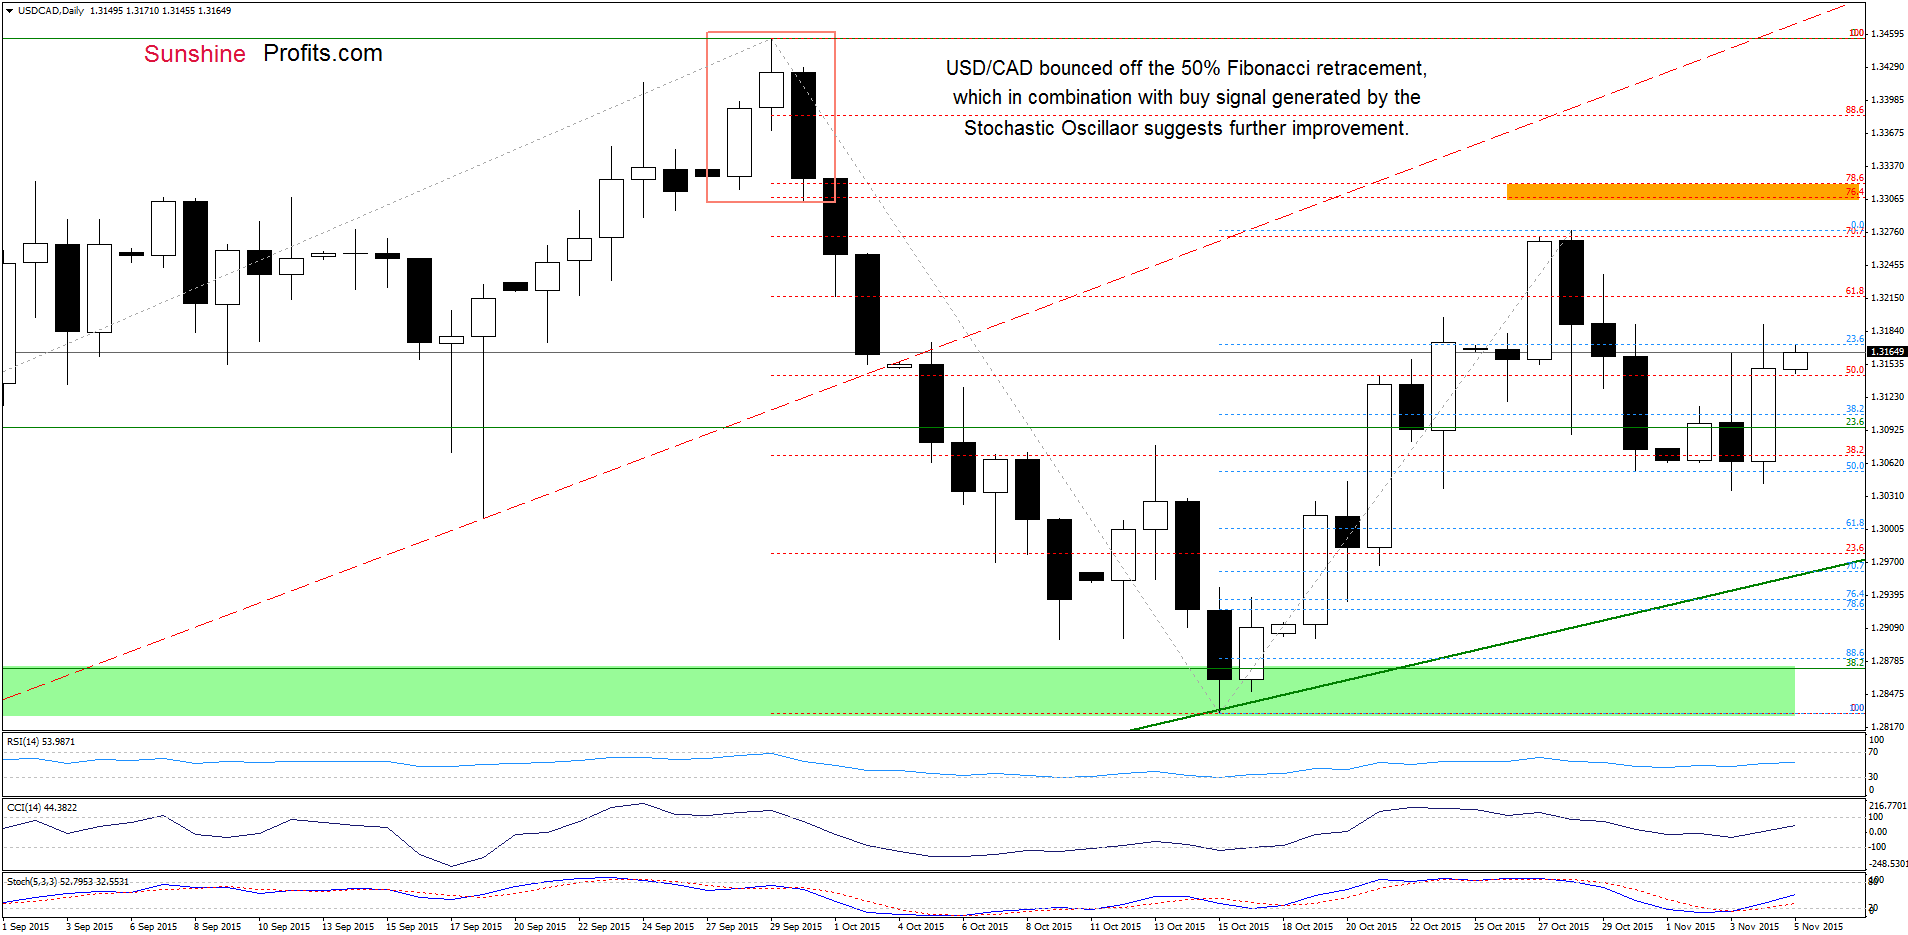
Looking at the above charts, we see that USD/CAD bounced off the support area (created by the 50% Fibonacci retracement based on the recent rally and the 2009 high), which resulted in a sharp rebound yesterday. Earlier today, the pair gave up some gains, but the current position of the indicators suggests that currency bulls will try to push the pair higher in the coming days. If we see such price action, the initial upside target would be the barrier of 1.3300 (reinforced by the 70.7% retracement), which stopped the last week’s rally.
Very short-term outlook: mixed with bullish bias
Short-term outlook: mixed
MT outlook: mixed
LT outlook: mixed
Trading position (short-term; our opinion): No positions are justified from the risk/reward perspective at the moment. We will keep you informed should anything change, or should we see a confirmation/invalidation of the above.
Thank you.
Nadia Simmons
Forex & Oil Trading Strategist
Przemyslaw Radomski, CFA
Founder, Editor-in-chief
Gold & Silver Trading Alerts
Forex Trading Alerts
Oil Investment Updates
Oil Trading Alerts
