

Forex Trading Alert originally sent to subscribers on June 11, 2015, 9:24 AM.
Earlier today, the U.S. Department of Labor reported that the number of initial jobless claims in the week ending June 6 increased by 2,000, beating analysts’ expectations. Additionally, the U.S. Commerce Department showed that retail sales increased by 1.2% in May (beating expectations for a gain of 1.1%), while core retail sales (without automobile sales) rose by 1.0% in the previous month (also beating forecasts for a 0.7% increase). Thanks to these solid numbers, the USD/CHF broke above two important resistance lines, but will this improvement trigger further rally?
In our opinion the following forex trading positions are justified - summary:
- EUR/USD: Short positions (stop-loss order at 1.1667)
- GBP/USD: Short positions (stop-loss order at 1.5913)
- USD/JPY: none
- USD/CAD: Long positions (stop-loss order at 1.1706)
- USD/CHF: none
- AUD/USD: Short positions (stop-loss order at 0.8194)
EUR/USD
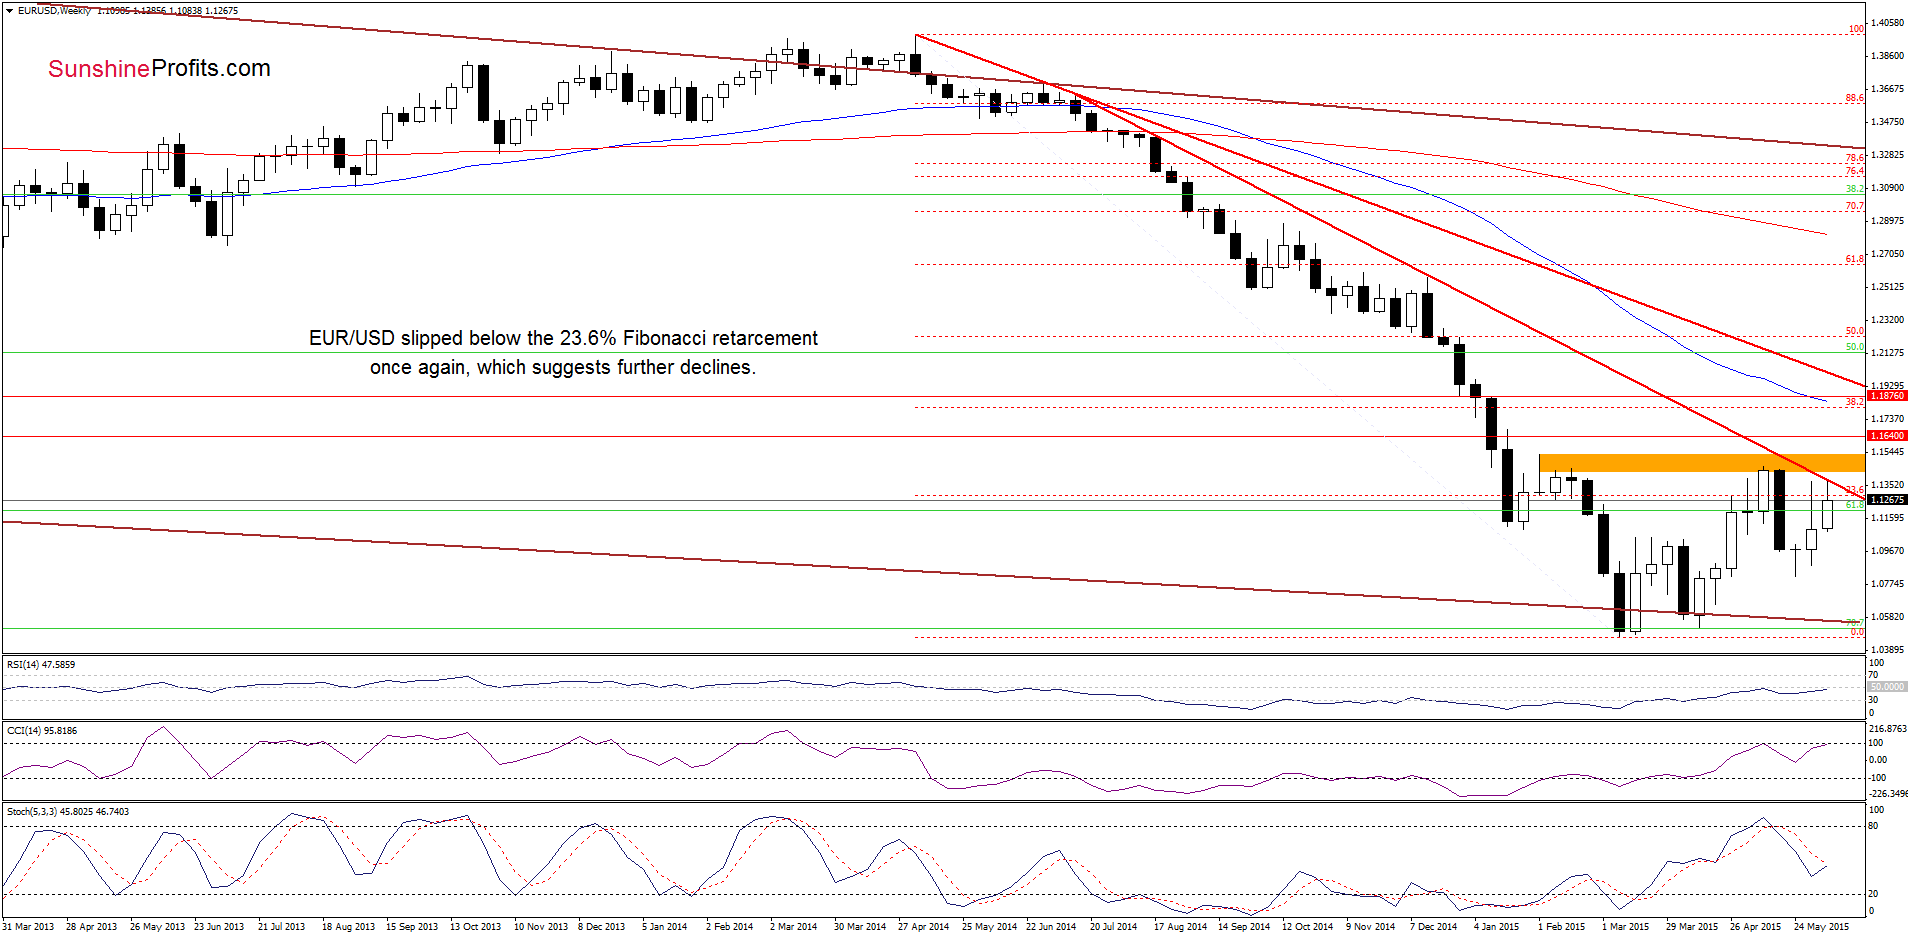
The situation in the medium term has deteriorated slightly after EUR/USD reached the long-term red declining line. As you see on the above chart, this resistance line stopped further improvement and triggered a pullback, which took the exchange rate below the 23.6% Fibonacci retracement. This is a negative signal, which suggests further declines.
How did this downswing affect the very short-term picture? Let’s examine the daily chart and find out.
Yesterday, we wrote the following:
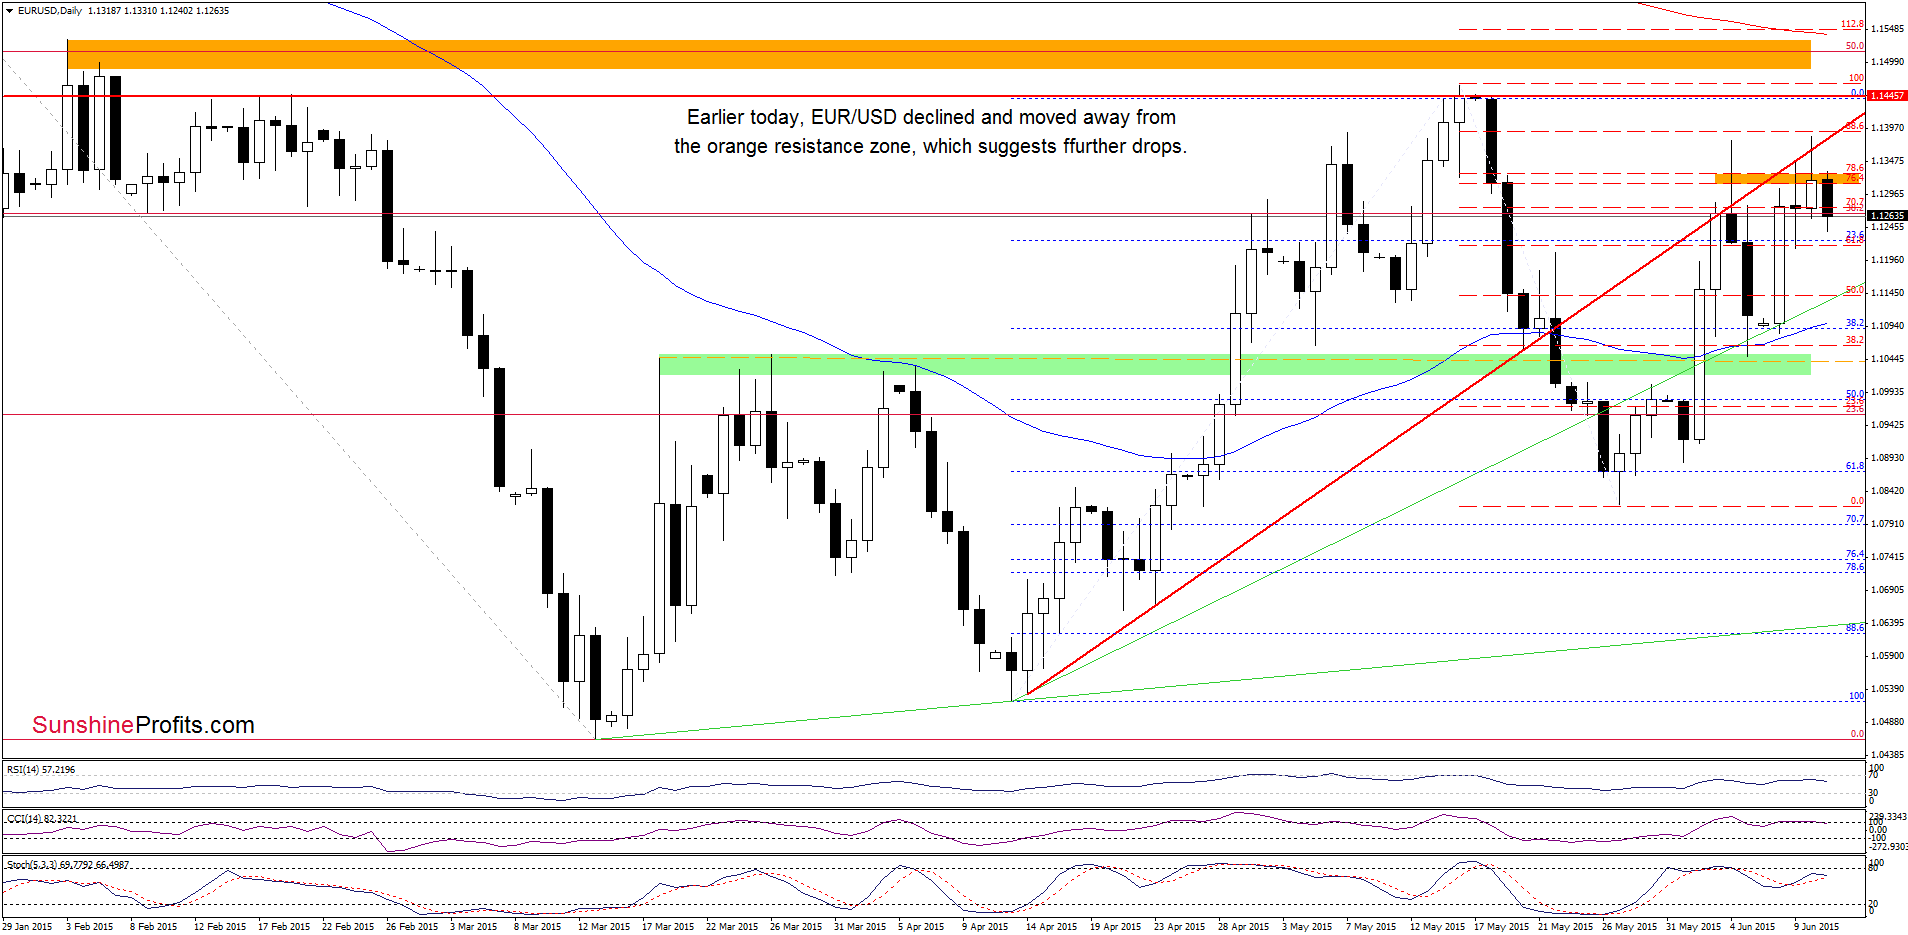
(…) the exchange rate climbed above the orange resistance area once again, but then reversed and declined – similarly to what we saw yesterday and also on June 4. Taking this fact into account, and combining with the current position of the CCI (and negative divergences between the indicator, the Stochastic Oscillator and the exchange rate) it seems that the pair will move lower in the coming days. Nevertheless, this scenario will be more likely if we see another daily close under the resistance area.
Looking at the daily chart, we see that the situation developed in line with the above scenario and EUR/USD reversed and declined sharply earlier today. With this downswing, the exchange rate moved away from the orange resistance zone, which in combination with the medium-term picture and the current position of the indicators (the CCI generated a sell signal, while the Stochastic Oscillator is very close to doing the same) suggests further declines. If this is the case, and the pair drops from here, the initial downside target would be around 1.1131, where the green rising support is.
Very short-term outlook: bearish
Short-term outlook: mixed with bearish bias
MT outlook: mixed
LT outlook: mixed
Trading position (short-term; our opinion): Short positions (which are profitable) with a stop-loss order at 1.1667 are justified from the risk/reward perspective at the moment. We will keep you informed should anything change, or should we see a confirmation/invalidation of the above.
USD/JPY
The situation in the medium term hasn’t changed much as USD/JPY remains around the June 2007 high. Today, we’ll focus on the very short-term changes.
Quoting our last commentary on this currency pair:
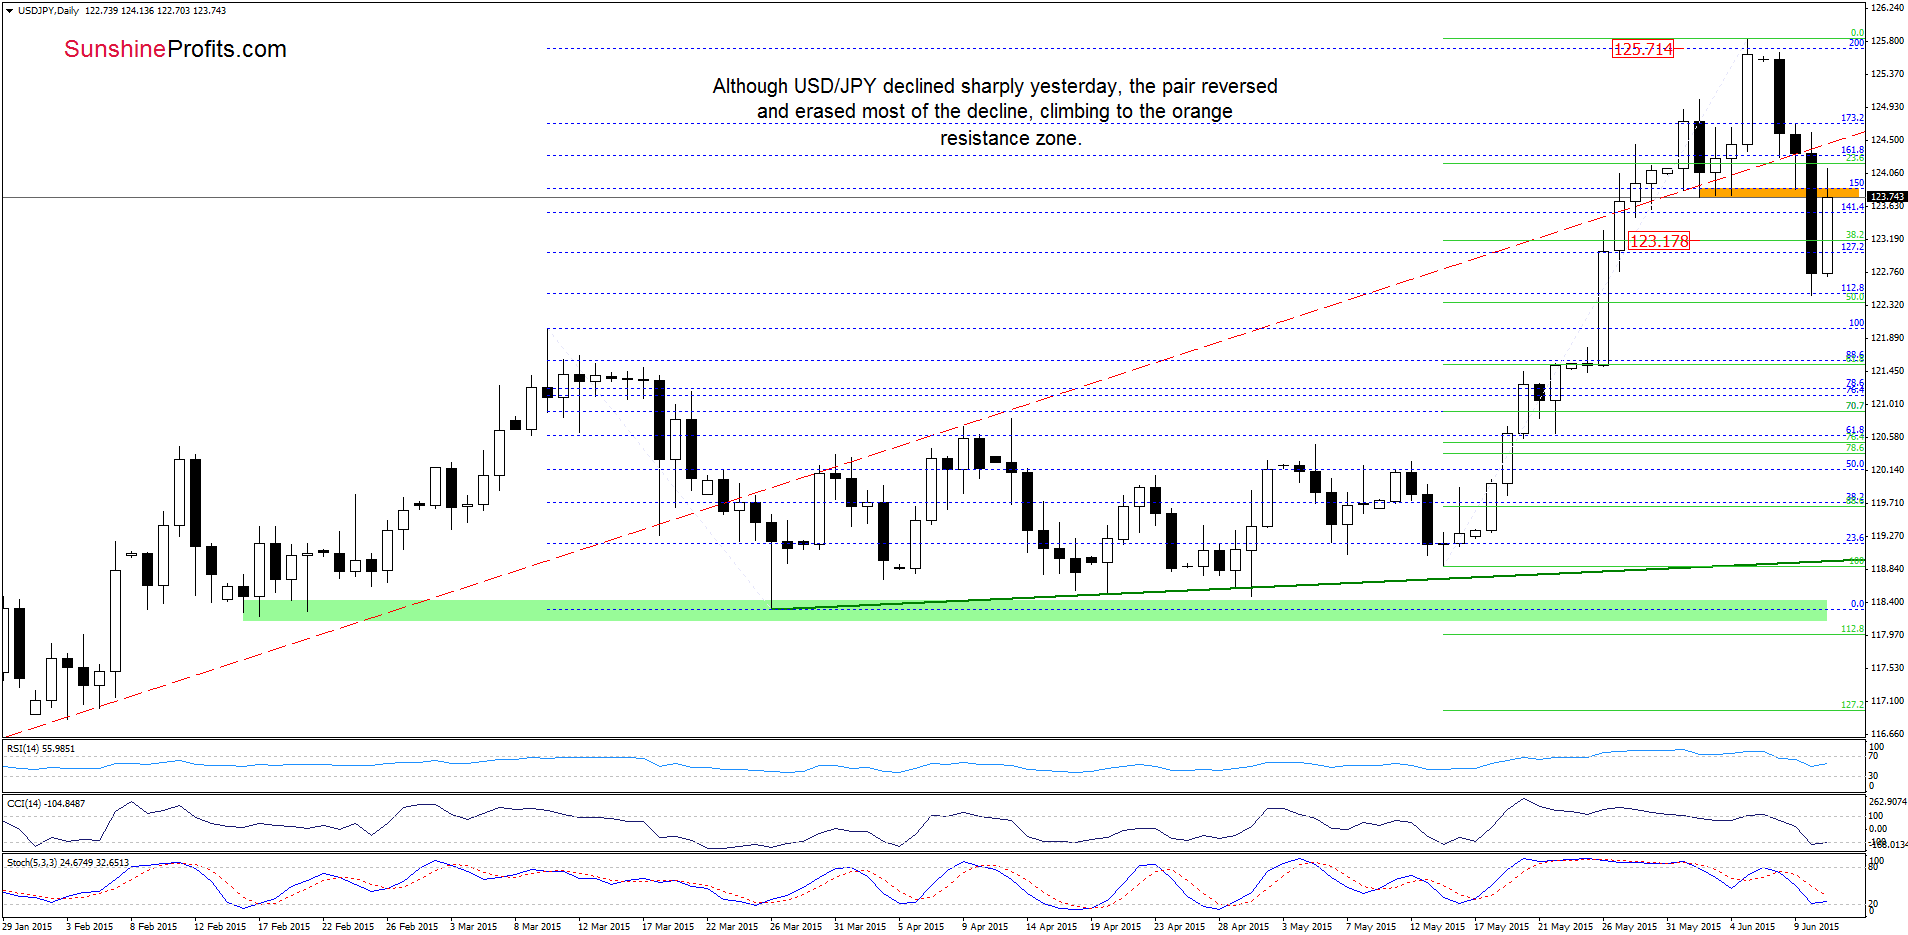
(…) the 200% Fibonacci extension stopped further rally, triggering a pullback, which took the pair to the red dashed support line. Earlier today, currency bulls pushed the exchange rate lower, which means that we’ll see a test of the recent lows (and the Jun 2007 high marked on the monthly chart). (…) taking into account sell signals generated by the daily indicators, it seems that we’ll see lower values of the exchange rate in the coming days. If this is the case, and the pair drops under the green support zone, we’ll see a decline to around 123.18, where the 38.2% Fibonacci retracement (based on the recent upward move) is.
From today’s point of view we see that currency bears not only took USD/JPY to our downside target, but also managed to push the pair below it, approaching the next retracement. Despite this deterioration, the exchange rate reversed and rebounded sharply earlier today, which resulted in a comeback to the orange resistance zone. Although we saw an intraday breakout above this area, we think that further improvement will be more reliable if we see a daily close above this zone. Please note that if currency bulls fail in this area, we’ll see another pullback to (at least) the 38.2% Fibonacci retracement (based on the recent upward move).
Very short-term outlook: mixed with bearish bias
Short-term outlook: mixed
MT outlook: mixed
LT outlook: bullish
Trading position (short-term; our opinion): No positions are justified from the risk/reward perspective at the moment. We will keep you informed should anything change, or should we see a confirmation/invalidation of the above.
USD/CHF
In our last commentary on this currency pair, we wrote:
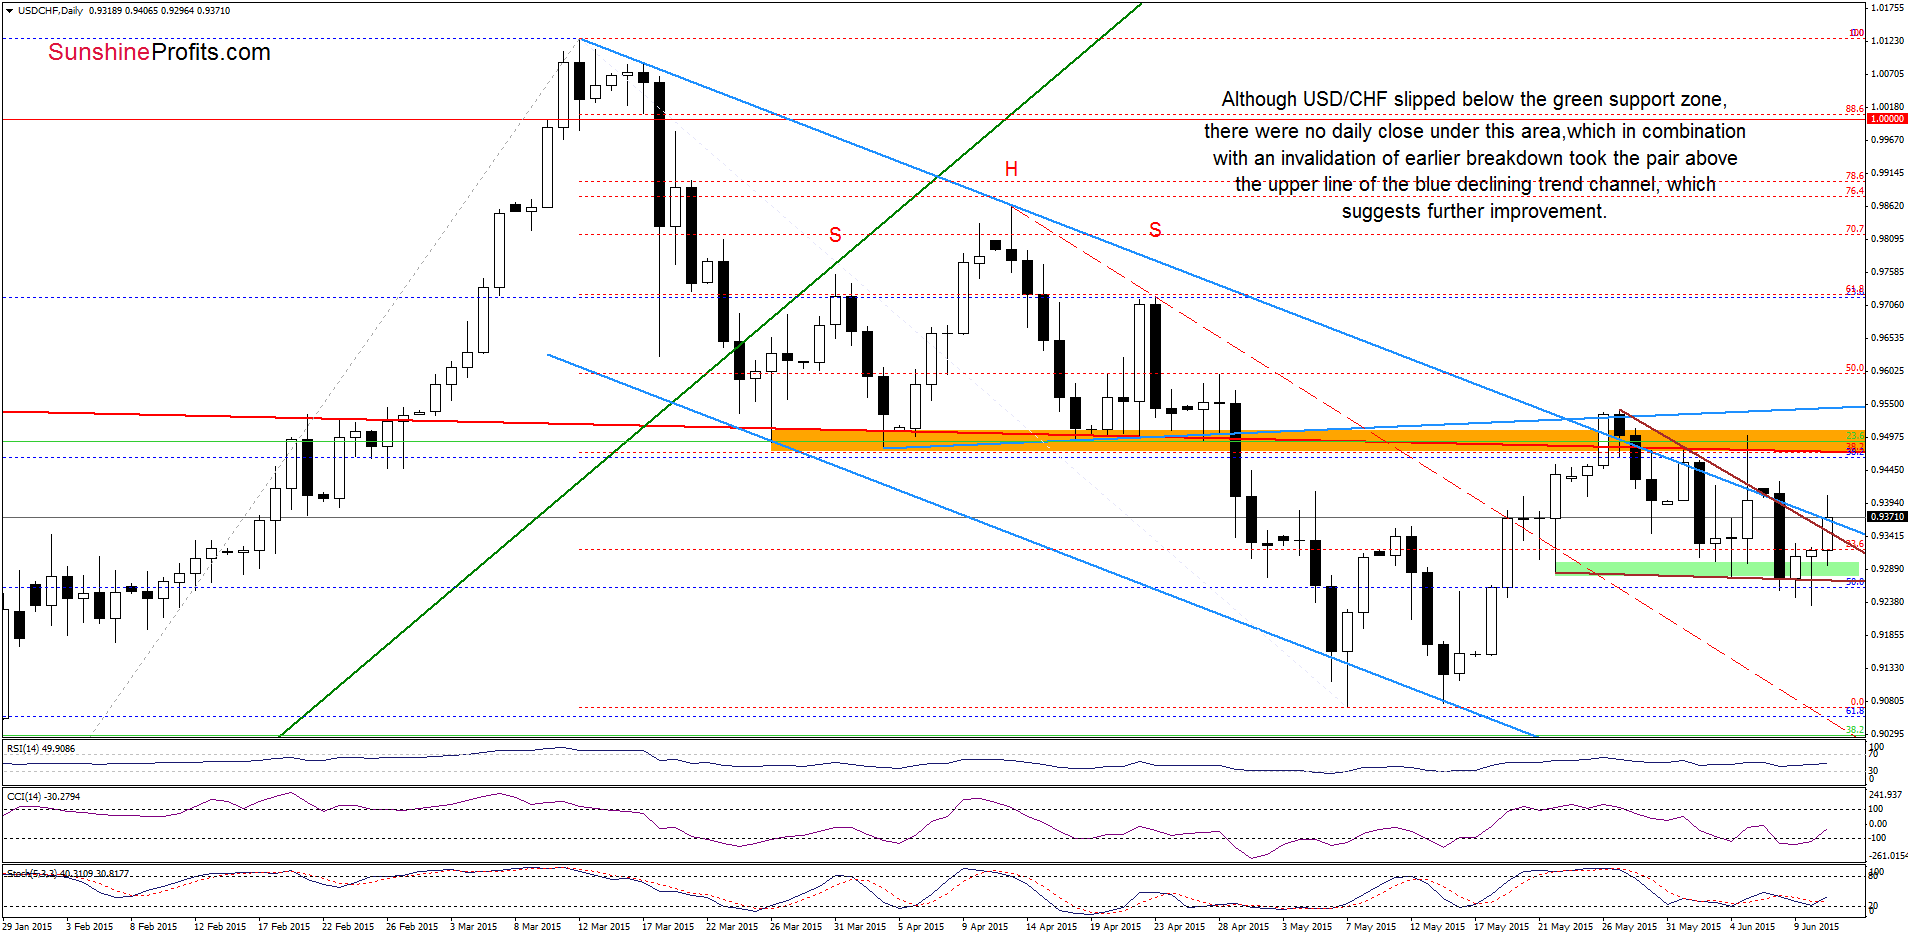
(…) the orange resistance zone (created by the Mar and Apr lows and the long-term red line) (…) stopped further improvement and triggered a sharp decline to the green support zone (…) if the green area withstands the selling pressure, the pair will test the brown and blue resistance lines once again.
Yesterday, USD/CHF slipped under the green support zone and the lower border of the triangle once again, but despite this move there were no daily close below this area. As a result, the exchange rate rebounded, invalidating earlier breakdown. This positive event encouraged currency bulls to act and triggered further improvement earlier today. As you see on the daily chart, USD/CHF broke above the upper line of the declining trend channel and the upper border of the triangle, which is a positive signal that suggests further improvement. Nevertheless, we think that this event will be more bullish (and more reliable) if we see a daily close above these lines. Until this time, another pullback from here should not surprise us.
Will we see further rally in the coming days? Let’s check the weekly chart and find out.
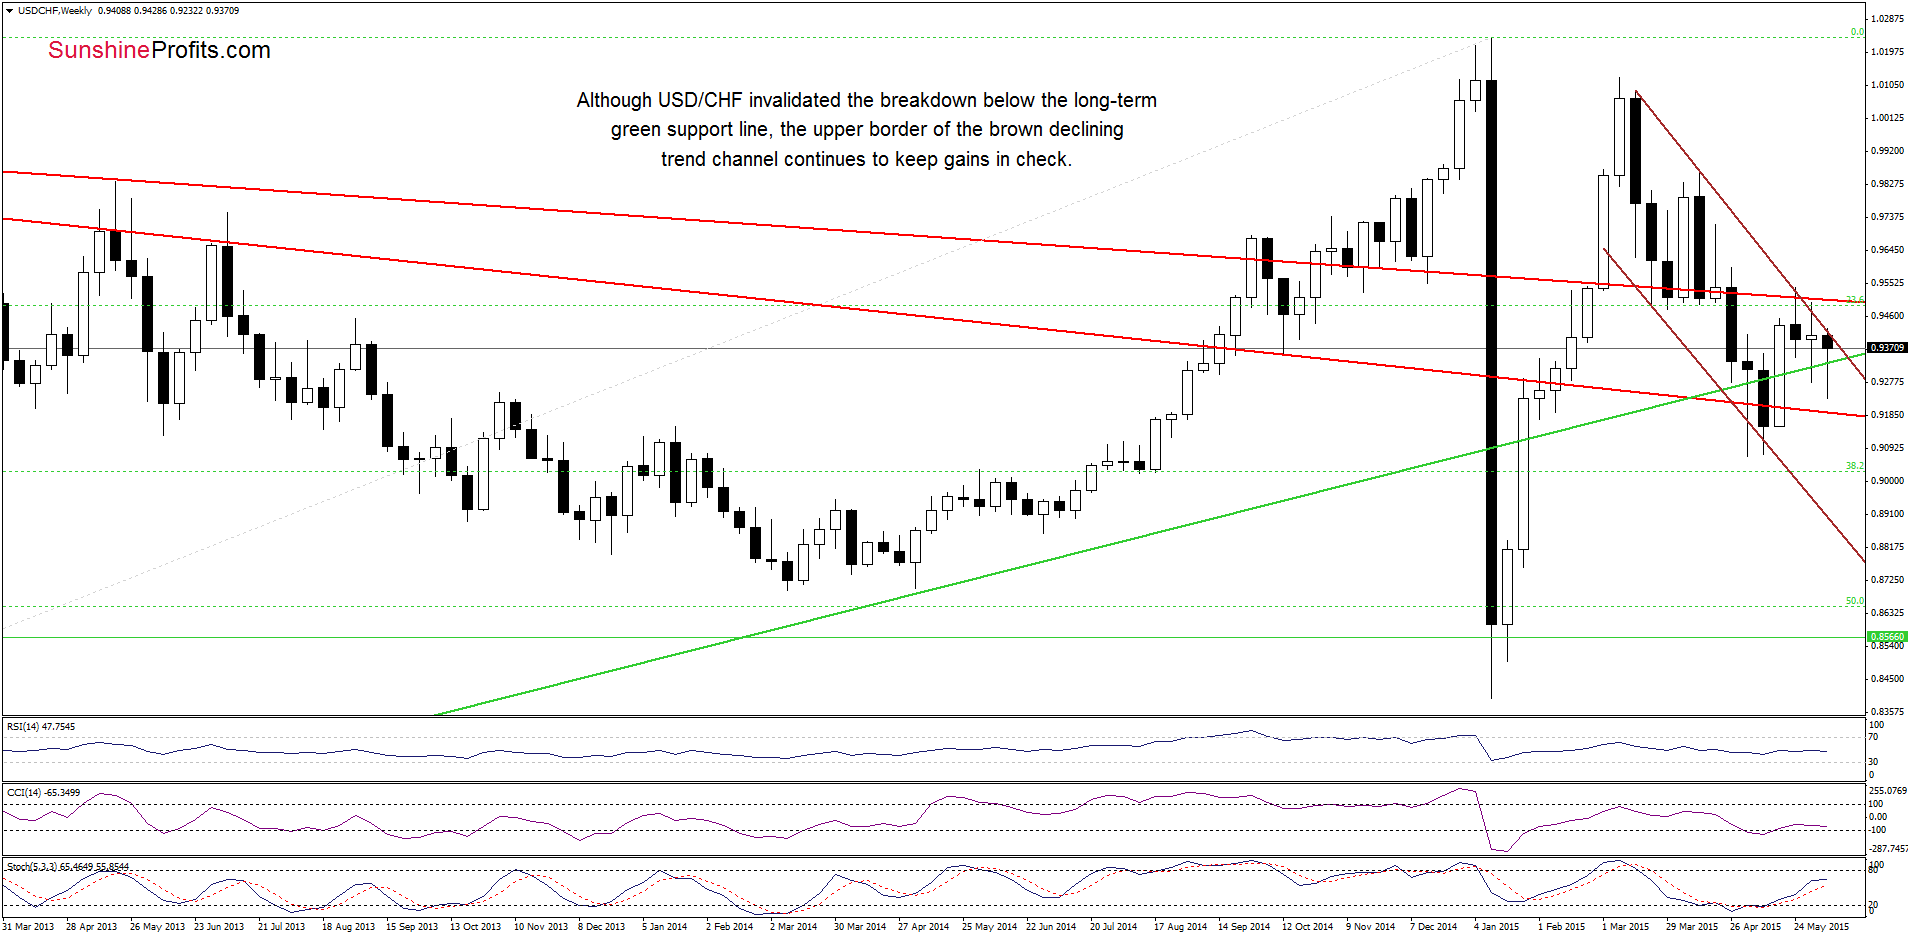
Looking at the weekly chart, we see that USD/CHF invalidated earlier breakdown below the long-term green support line, but despite this positive signal, the pair remains under the upper border of the brown declining trend channel. Therefore, in our opinion, as long as there is no breakout above this important resistance line further rally is not likely to be seen.
Very short-term outlook: mixed
Short-term outlook: mixed
MT outlook: mixed
LT outlook: bearish
Trading position (short-term; our opinion): No positions are justified from the risk/reward perspective at the moment. We will keep you informed should anything change, or should we see a confirmation/invalidation of the above.
Thank you.
Nadia Simmons
Forex & Oil Trading Strategist
Przemyslaw Radomski, CFA
Founder, Editor-in-chief
Gold & Silver Trading Alerts
Forex Trading Alerts
Oil Investment Updates
Oil Trading Alerts
