
Forex Trading Alert originally sent to subscribers on March 27, 2014, 1:22 PM.
The U.S. currency moved higher after data showed that U.S. jobless claims declined by 10,000 (while analysts had expected an increase of 4,000) and fell to the lowest level since late November last week. Additionally, official data showed that U.S. economic fourth quarter growth was revised up to 2.6% from a preliminary estimate of 2.4%. What impact did it have on major currency pairs? What is their current outlook? If you want to know our take on this question, we invite you to read our today's Forex Trading Alert.
In our opinion the following forex trading positions are justified - summary:
EUR/USD
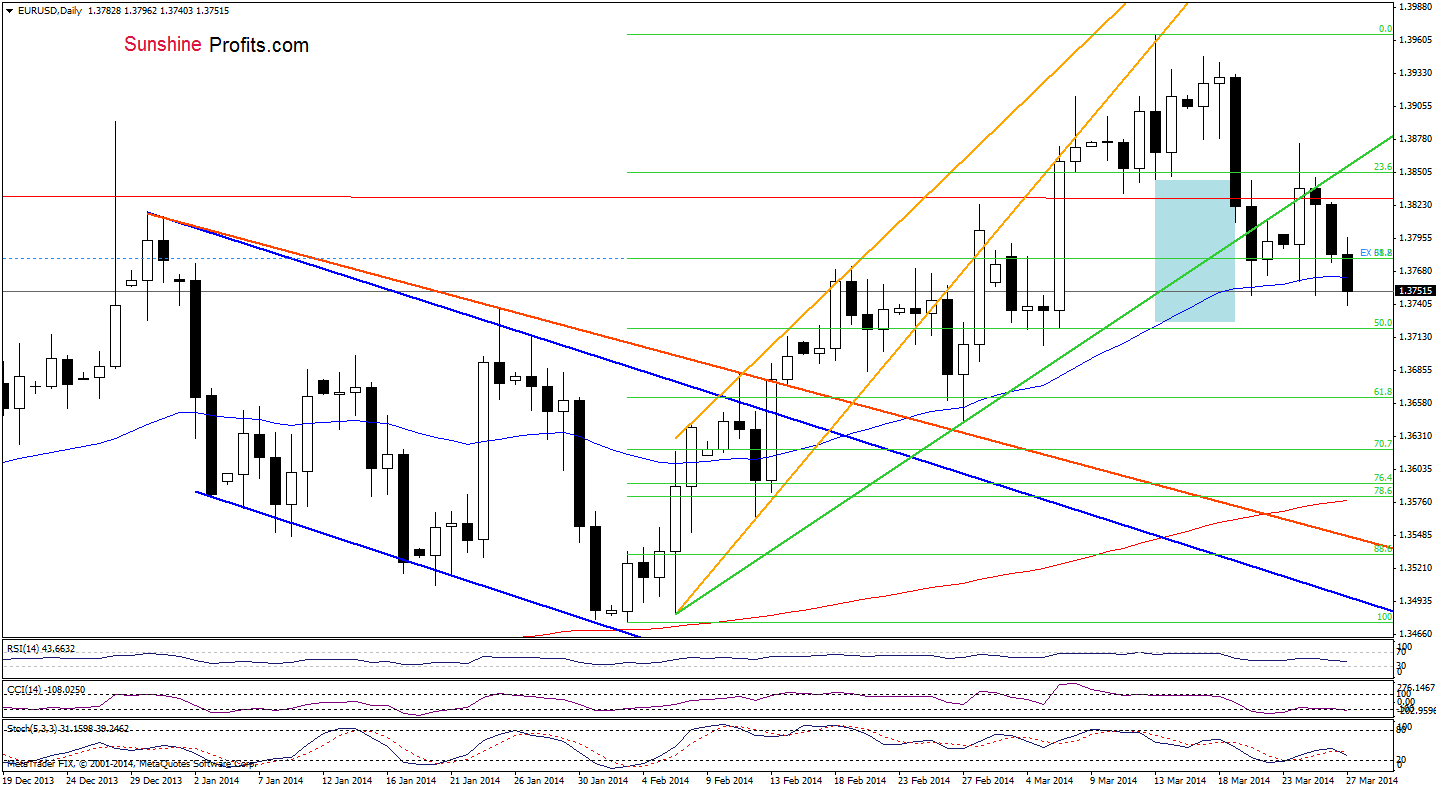
Earlier today, EUR/USD extended losses and broke below the 50-day moving average and hitting a fresh weekly low. If the pair declines below today’s low, we will likely see a drop to the 50% Fibonacci retracement. However, looking at the current position of the indicators, we can see positive divergences between the CCI, Stochastic Oscillator and the exchange rate, which suggests that the space for further declines may be limited.
Very short-term outlook: bearish bias
Short-term outlook: bearish
MT outlook: mixed
LT outlook: bearish
Trading position: In our opinion no positions are justified from the risk/reward perspective as the space for further declines seems to be limited. We will keep you informed should anything change, or should we see a confirmation/invalidation of the above.
GBP/USD
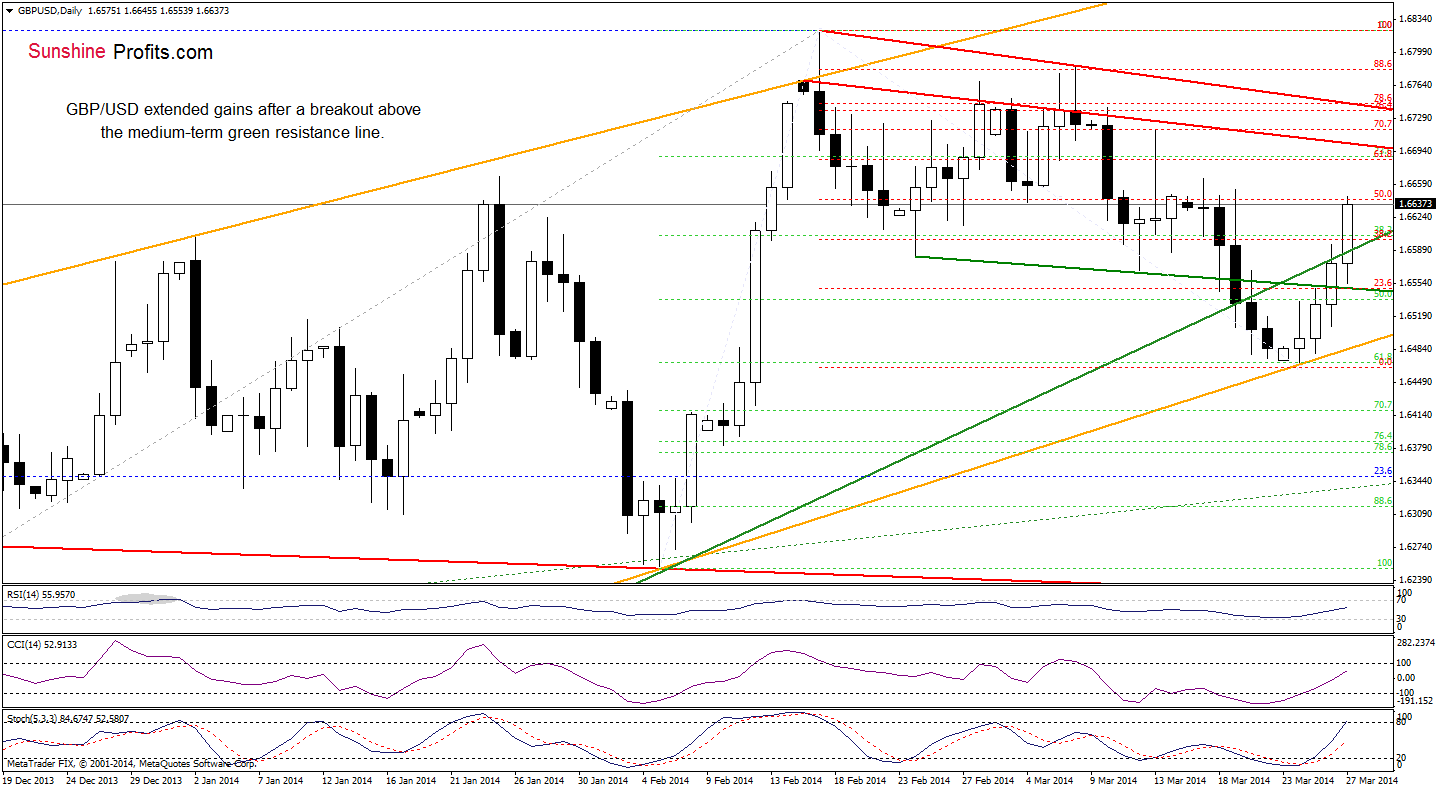
On the daily chart, we see that GBP/USD extended gains after a breakout above the medium-term rising support/resistance line based on the July and February lows. As you see on the above chart, with this upswing, the exchange rate erased 50% of the entire decline and the last three candlesticks formed a bullish candlestick pattern (a three white soldiers). Additionally, the current position of the indicators suggests that further improvement is likely to be seen (buy signals remain in place). Will the 4-hour chart give us any interesting clues about the nearest future? Let’s take a look.
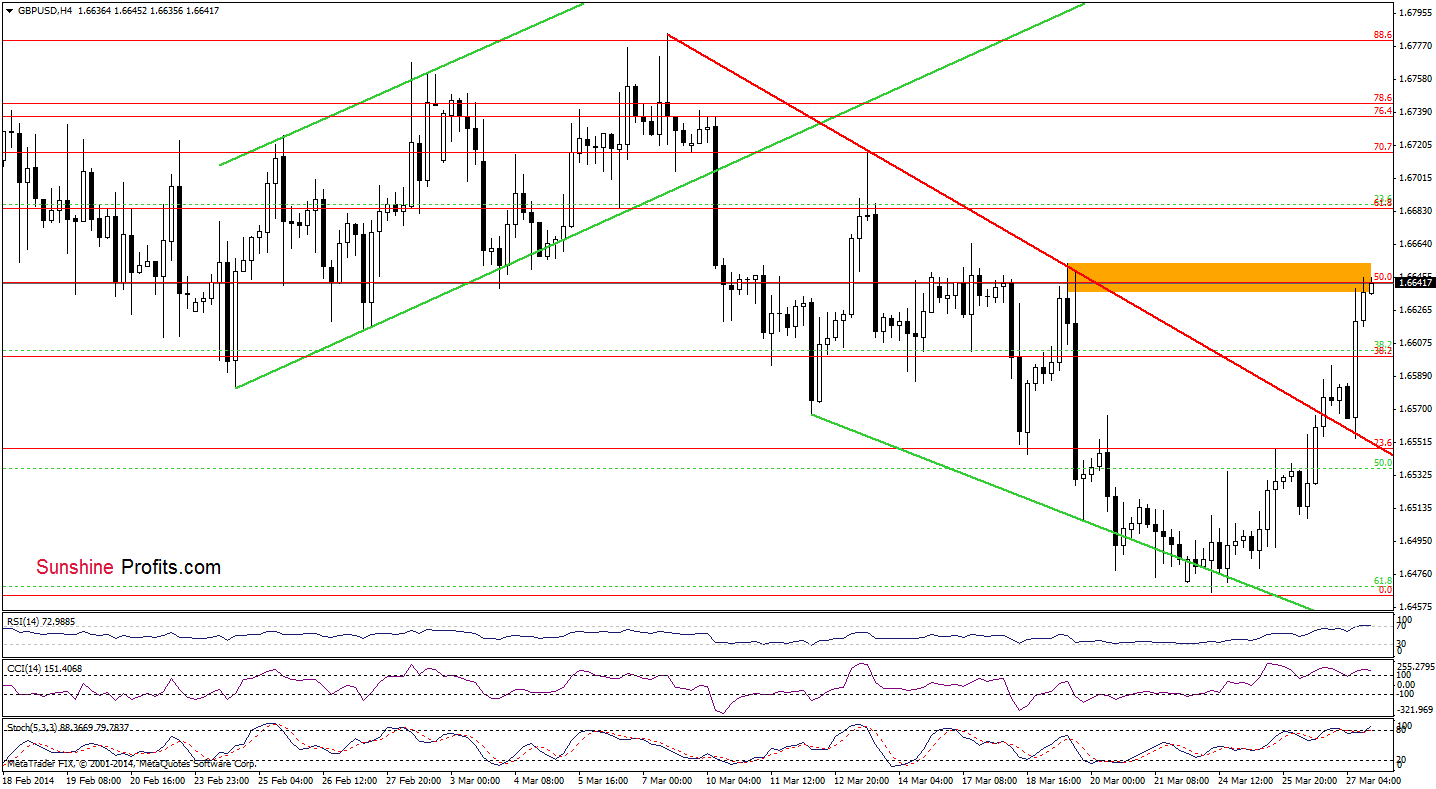
From this perspective, we see that the exchange rate reached a resistance zone created by the March 19 high and the 50% Fibonacci retracement level based on the entire (Feb.17-March 24) decline. If this area is broken, we will likely see further improvement and the first upside target will be the next Fibonacci retracement level (around 1.6684). However, if the buyers fail and the pair declines, we will likely see a drop to the previously-broken 38.2% Fibonacci retracement or even to the red line, which serves as support at the moment. Please note that all indicators are overbought, which suggests that a pullback (and the bearish scenario) is likely to be seen in the following hours.
Very short-term outlook: mixed
Short-term outlook: mixed
MT outlook: mixed
LT outlook: mixed
Trading position (short-term): In our opinion no positions are justified from the risk/reward perspective at the moment. We will keep you informed should anything change, or should we see a confirmation/invalidation of the above.
USD/JPY
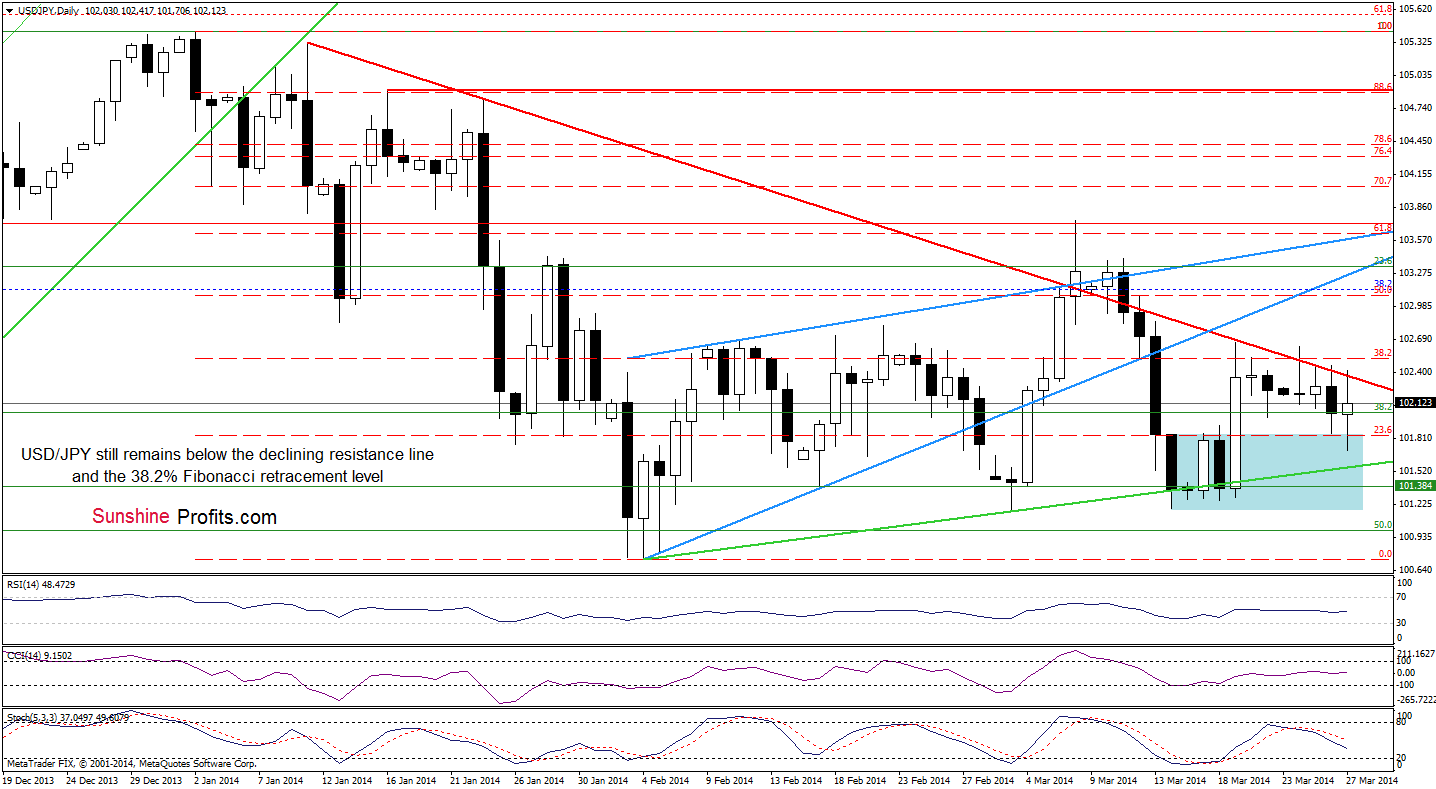
On the above chart, we see that USD/JPY extended losses and declined to the previously-broken upper line of the consolidation earlier today. As you see on the daily chart, this support encouraged buyers to act, which resulted in a corrective upswing that took the pair to the red declining line. Similarly to what we saw in the previous days, this strong resistance stopped further improvement and the exchange rate gave up the gains. From this perspective, it seems that if the buyers do not manage to push USD/JPY above this line, we will likely see another attempt to move lower (the first downside target is today’s low and the second one is the green support line around 101.56). However, if they do not fail and the pair climbs above the resistance, we may see an increase to the March 19 high (around 102.67).
Very short-term outlook: mixed with bearish bias
Short-term outlook: mixed
MT outlook: bullish
LT outlook: bearish
Trading position (short-term): In our opinion no positions are justified from the risk/reward perspective at the moment. We will keep you informed should anything change, or should we see a confirmation/invalidation of the above.
USD/CAD
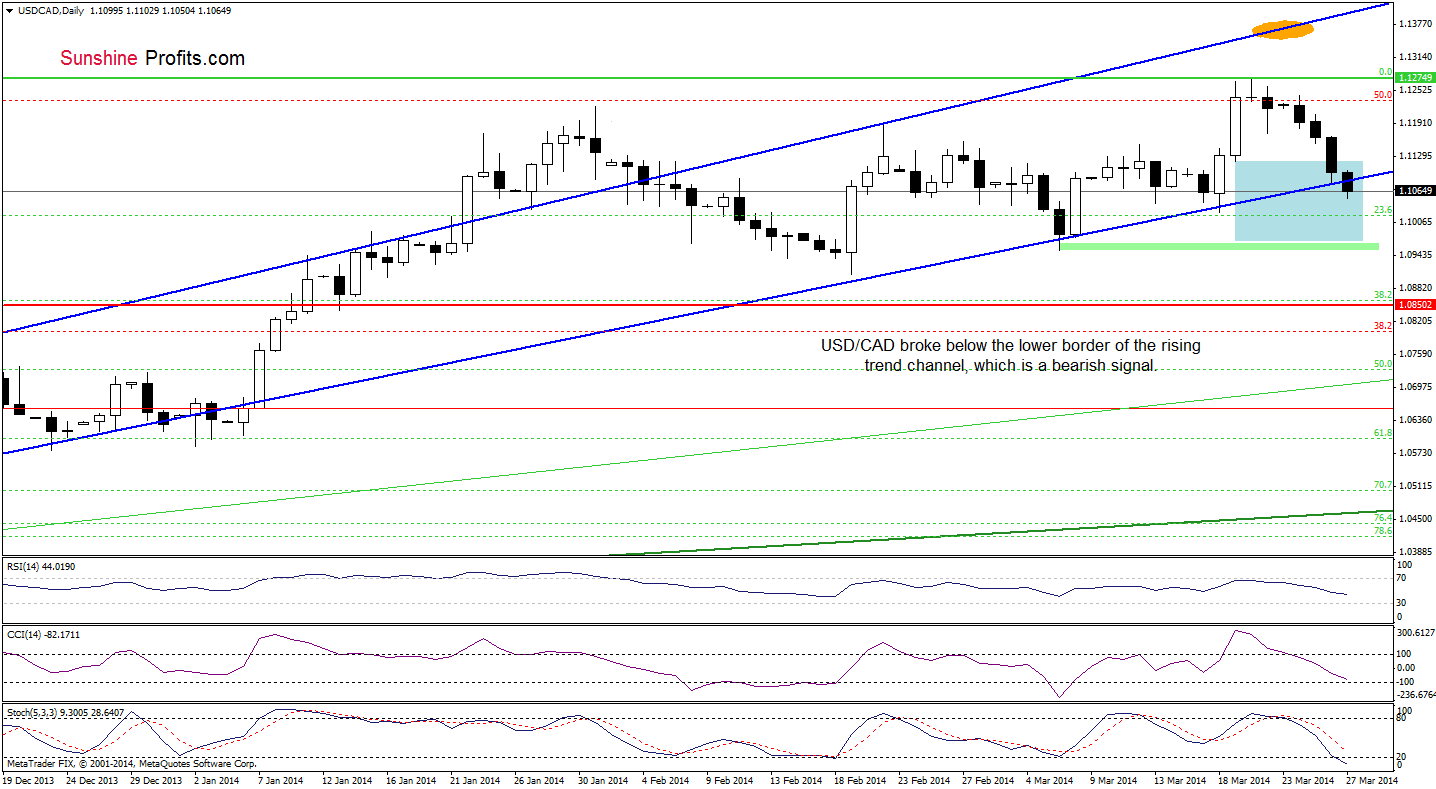
Looking at the daily chart, we see that the sellers pushed USD/CAD below the lower border of the rising trend channel, which suggests further deterioration. Taking this fact into account, what we wrote in our last Forex Trading Alert is up-to-date.
(…) the exchange rate almost touched the lower border of the rising trend channel. (…) if it is broken, we will likely see further deterioration and the first downside target will be the 23.6% Fibonacci retracement (around 1.1146), which corresponds to the March 18 low.
Please note that if this support is broken, the next downside will be around 1.0985 (where the March 6 low is).
Very short-term outlook: bearish
Short-term outlook: mixed
MT outlook: bullish
LT outlook: bearish
Trading position (short-term): In our opinion, the situation is not bearish enough to go short at the moment. However, if the pair closes the day below the lower border of the trend channel, we will consider opening short positions. We will keep you informed should anything change, or should we see a confirmation/invalidation of the above.
USD/CHF
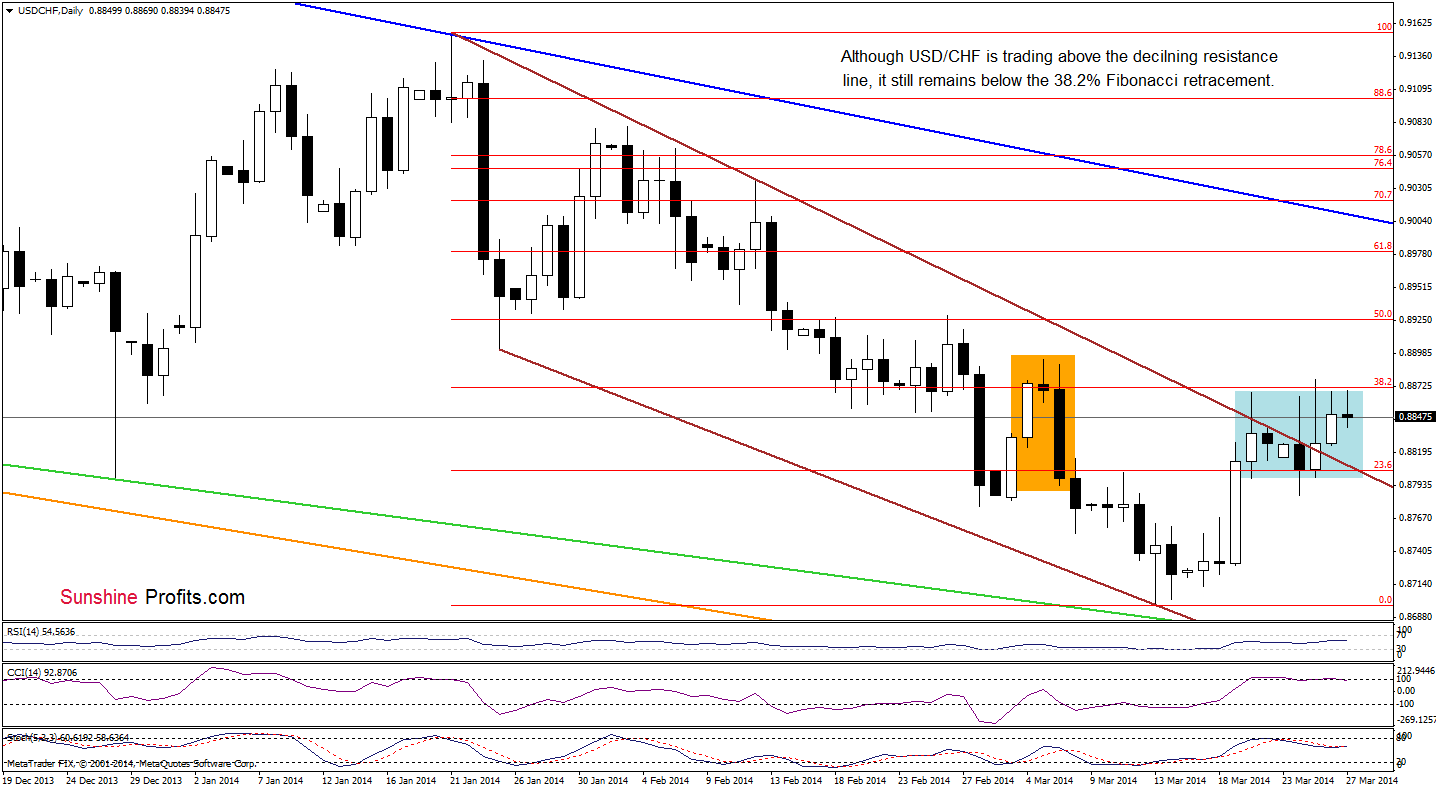
Looking at the above chart, we see that the situation hasn’t changed much as USD/CHF remains in a consolidation between the upper line of the declining wedge/trend channel (marked with brown) and the 38.2% Fibonacci retracement level, which successfully stopped further improvement in the previous days. Taking this fact into account, what we wrote in our last Forex Trading Alert is still up-to date.
(…) if the buyers do not give up and break above the 38.2% Fibonacci retracement, we may see an increase to around 0.8890 (where the top of a bearish candlesticks pattern is) or even to the next Fibonacci retracement. However, if they fail and we see an invalidation of a breakout in the coming day (or days), the exchange rate will likely drop to the Monday’s low.
Very short-term outlook: mixed
Short-term outlook: bearish
MT outlook: bearish
LT outlook: bearish
Trading position (short-term): In our opinion, the situation is not enough bullish to go long at the moment. We will keep you informed should anything change, or should we see a confirmation/invalidation of the above.
AUD/USD
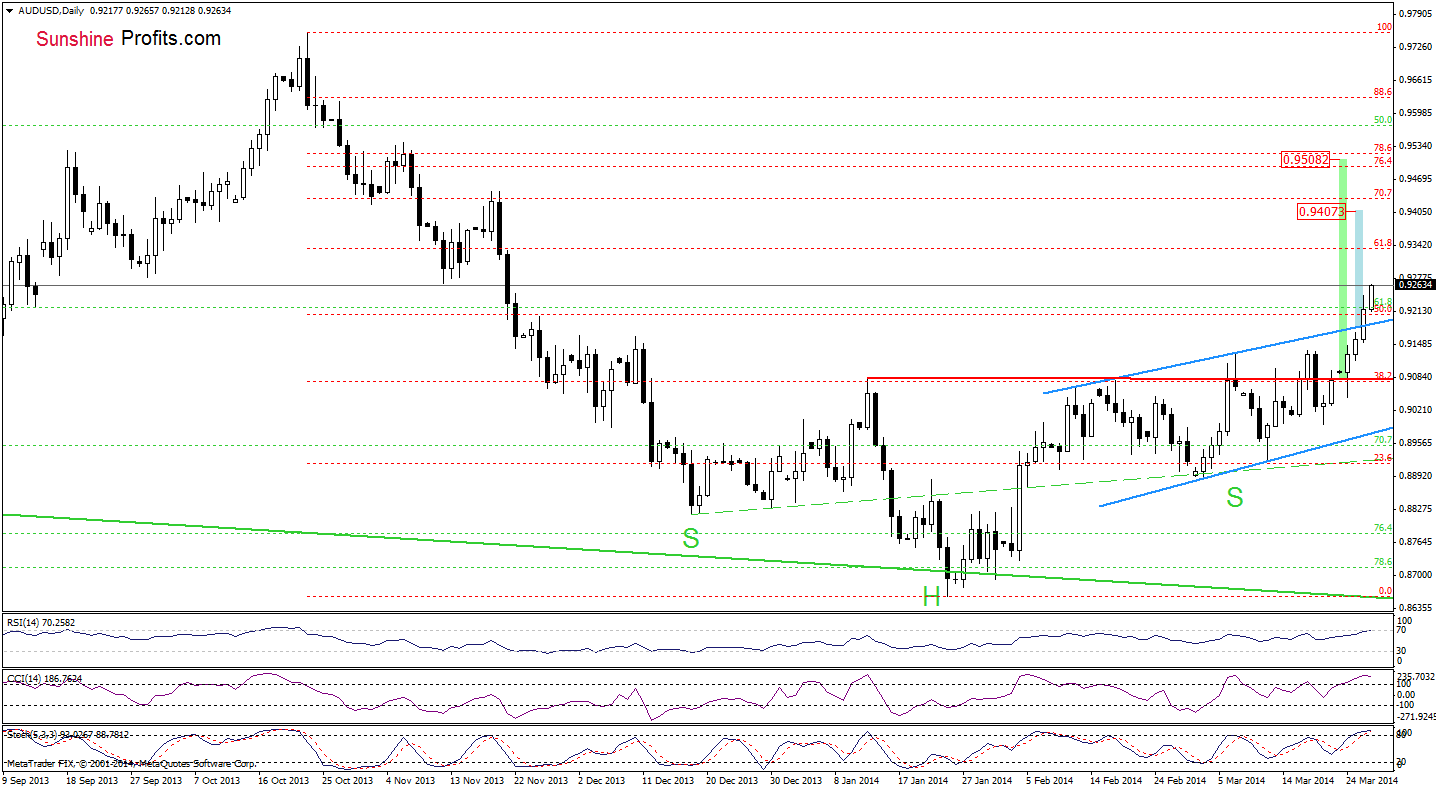
Looking at the above chart, we see that AUD/USD extended gains and hit a fresh 2014 high. With this upward move, the buyers pushed the exchange rate above the 50% Fibonacci retracement, which suggest that we may see an increase to the next Fibonacci retracement. Despite these positive circumstances, we should keep in mind that the indicators are overbought, which suggests that a pause should not surprise us.
Very short-term outlook: bullish
Short-term outlook: bullish
MT outlook: bearish
LT outlook: bearish
Trading position (short-term; our opinion): In our opinion no positions are justified from the risk/reward perspective at the moment. We will keep you informed should anything change, or should we see a confirmation/invalidation of the above.
Thank you.
Nadia Simmons
Forex & Oil Trading Strategist
Forex Trading Alerts
Oil Investment Updates
Oil Trading Alerts
