

After a few days of relative calm in EUR/USD, the bulls are making a move today. How high can their staying power take them? What do the charts say? Is it brighter days ahead, as risk aversion is waning today? We are not surprised either by the strengthening USD/JPY. Let’s take a look at what all these mean for us going forward.
EUR/USD – A Reversal in the Making
Yesterday, we wrote the following:
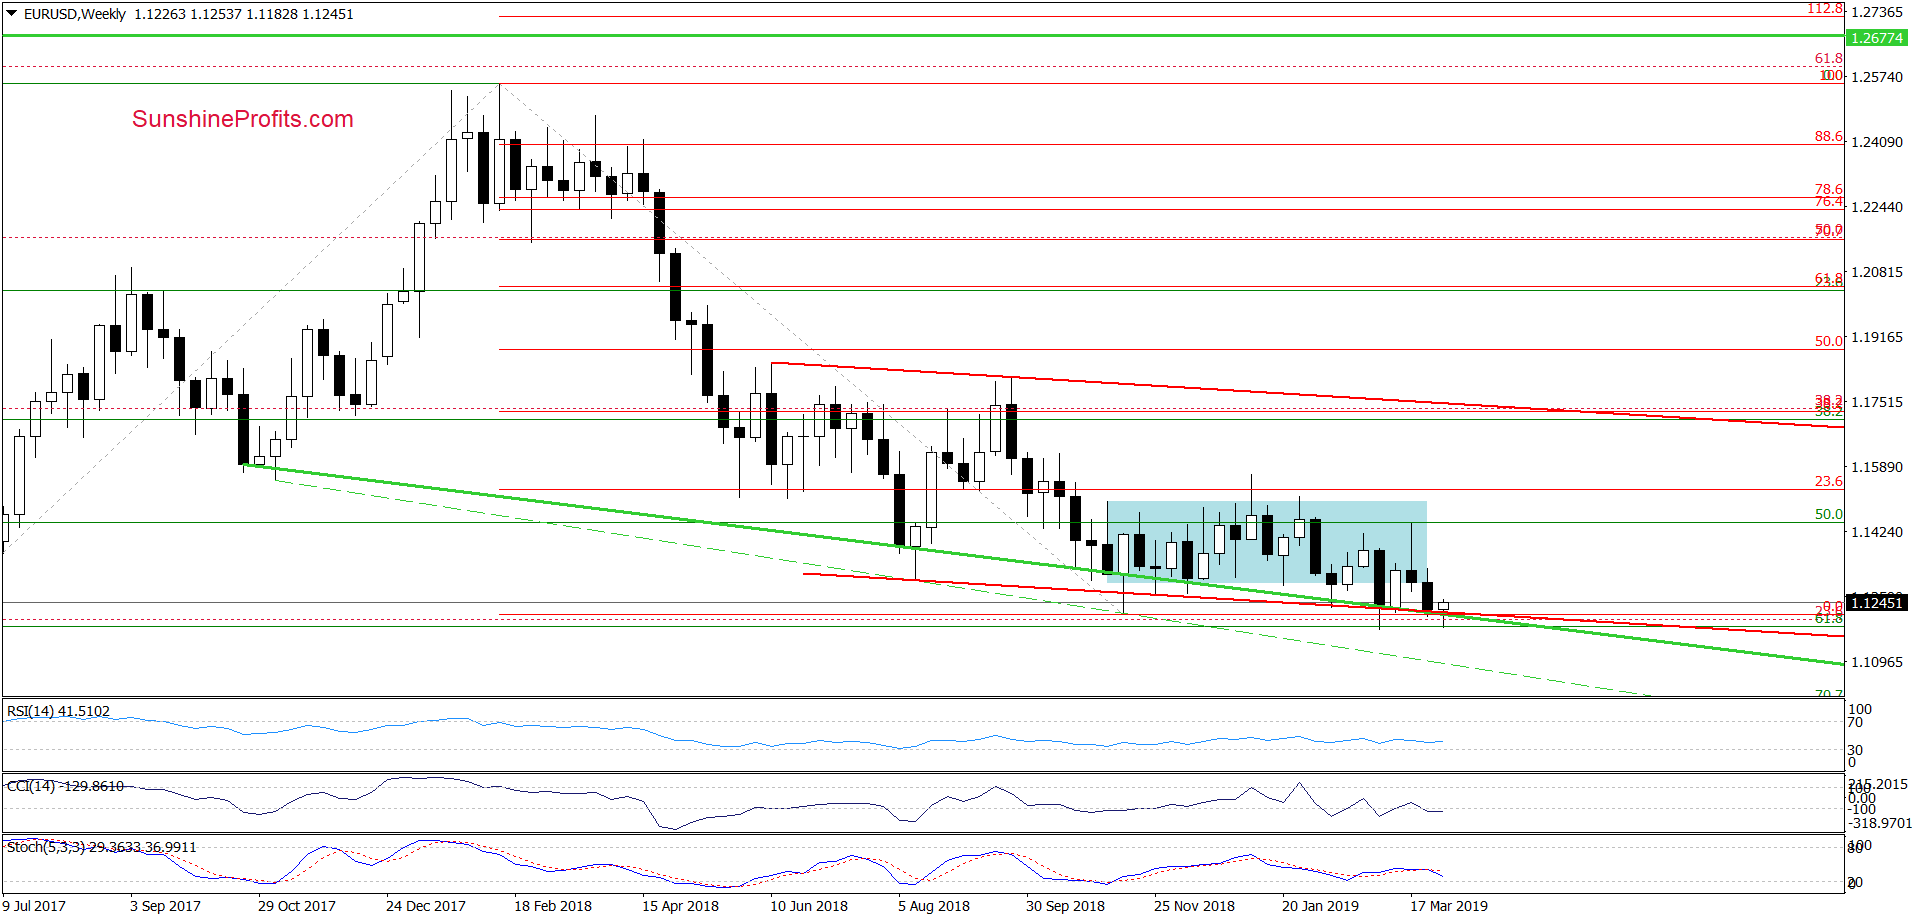
(…) EUR/USD (…) finished the day below the lower border of the red declining trend channel and the long-term green support line (…)
This is a negative development but taking into account just how close March lows are and also the current position of the daily indicators (bullish divergences forming between both the CCI and the Stochastic Oscillator, and the exchange rate itself), we think that reversal is most likely around the corner.
Additionally, we have seen similar price action almost a month ago. It suggests that as long as there is no weekly close below the green support line on the weekly chart, another rebound and an invalidation of the small breakdown below it remains very likely.
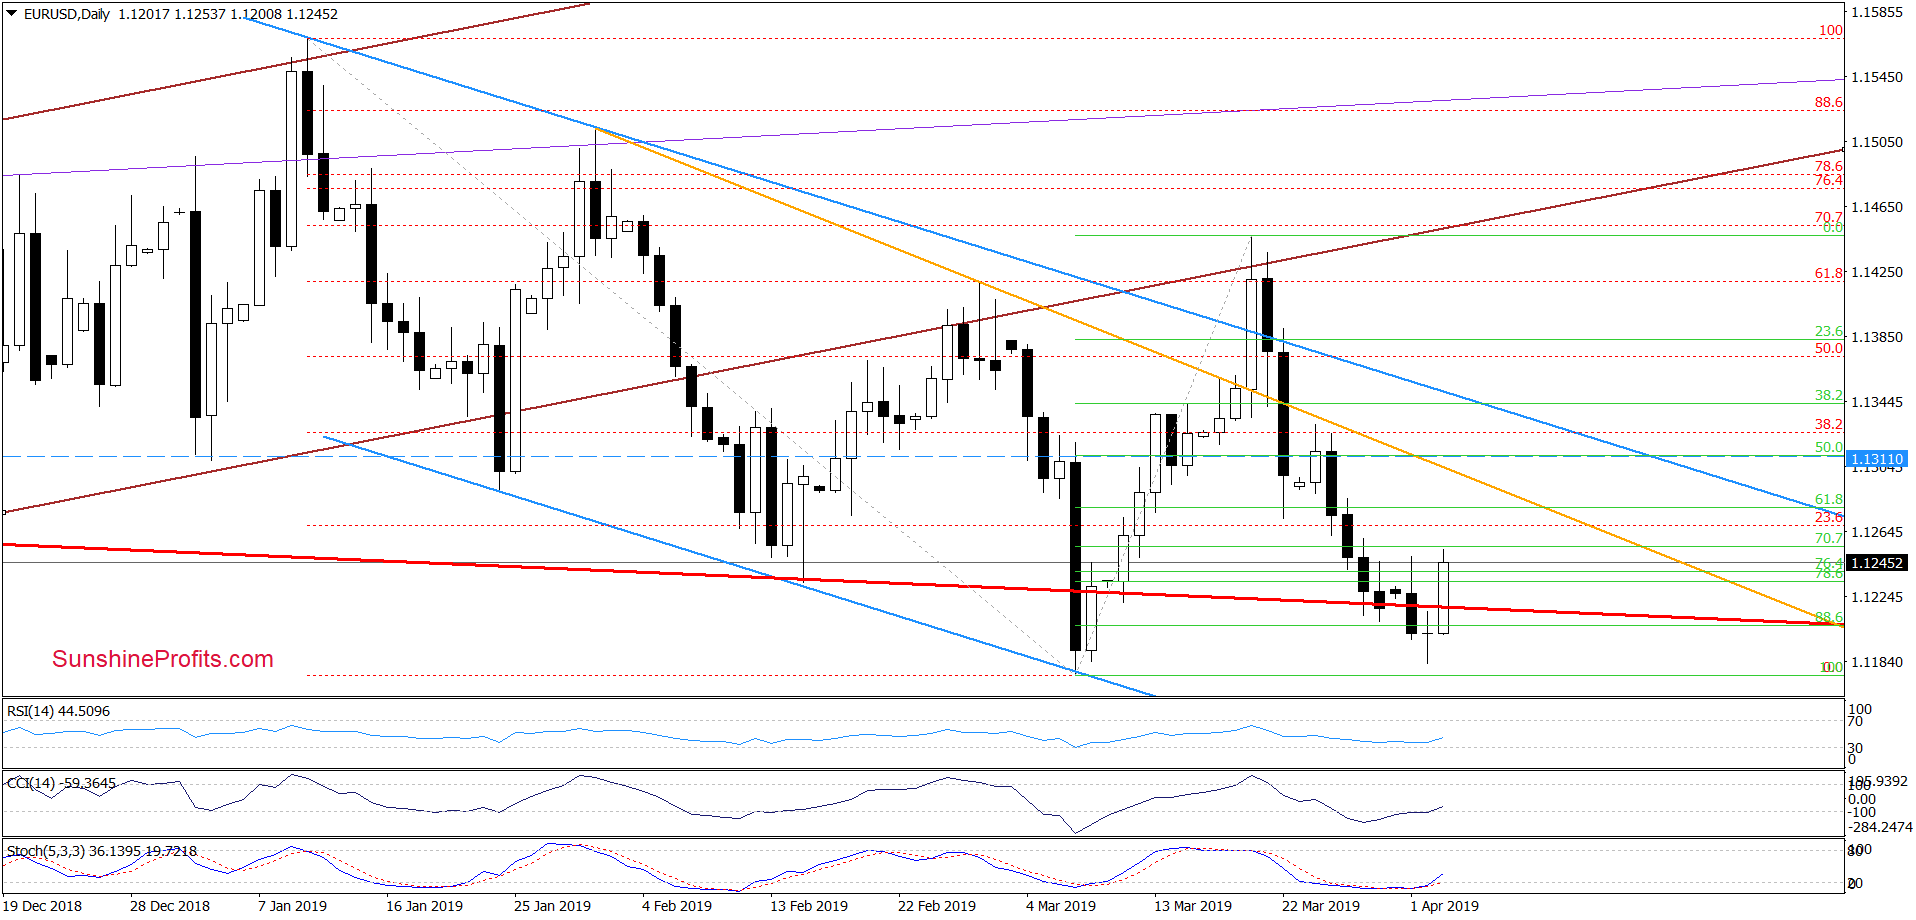
The situation developed in line with our observations. It was a prudent decision to close our profitable short positions on March 28. Earlier today, EUR/USD has moved quite sharply higher. In the process, it invalidated the above-mentioned breakdowns.
This is a bullish development, which suggests further improvement. Especially, when we factor in the buy signal generated by the daily CCI and the daily Stochastic Oscillator.
Should the pair close the day at least at current levels (the pair trades at around 1.1245 as we speak), the bulls will get additional reason to act. That reason will be the morning star candlestick pattern. This is a three-day reversal pattern marked by a large red candle, followed by a small-body bullish or bearish candle, and finally a large white candle.
Connecting the dots, the technical picture favors further growth in the pair. Our upside targets remain on.
USD/JPY – Tentatively Moving Higher
Quoting our Monday’s commentary:
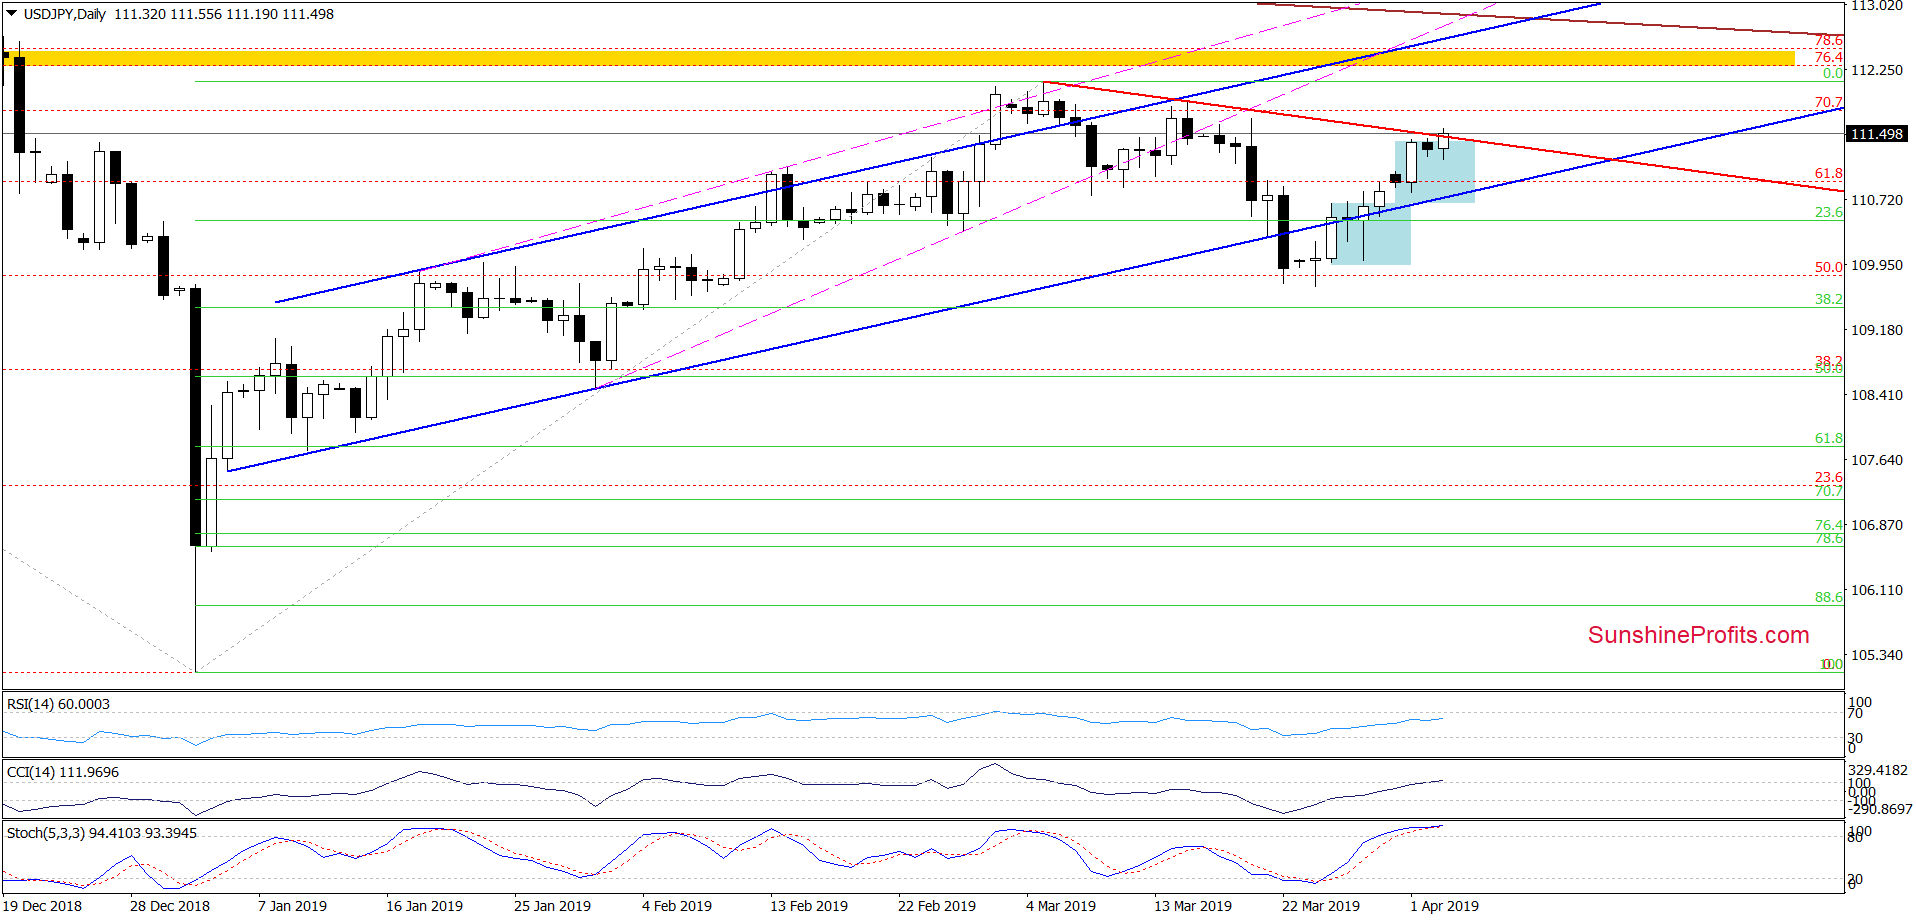
(...) the pair invalidated a small breakdown below the lower border of the blue rising trend channel. Coupled with the lack of sell signals by the daily indicators, it suggests that USD/JPY will likely extend gains from current levels and test the red declining resistance line based on previous highs in the coming week.
USD/JPY indeed moved higher as we had expected. It has also reached the red declining resistance line.
Earlier today, we have noticed a tiny intraday breakout above the red line but the day is still young. As long as there is no daily close above this resistance, higher values of the exchange rate are questionable. Nevertheless, if the bulls manage to close today’s session above 111.44 (the red declining resistance line), the way to the mid-March highs would be open.
Please keep in mind however, that the CCI and the Stochastic Oscillator moved to their overbought levels, which can translate into a reversal in the coming days. Should we see such price action accompanied by signs of bulls’ weakness, we’ll consider opening short positions.
USD/CAD – Breaking Below the Consolidation
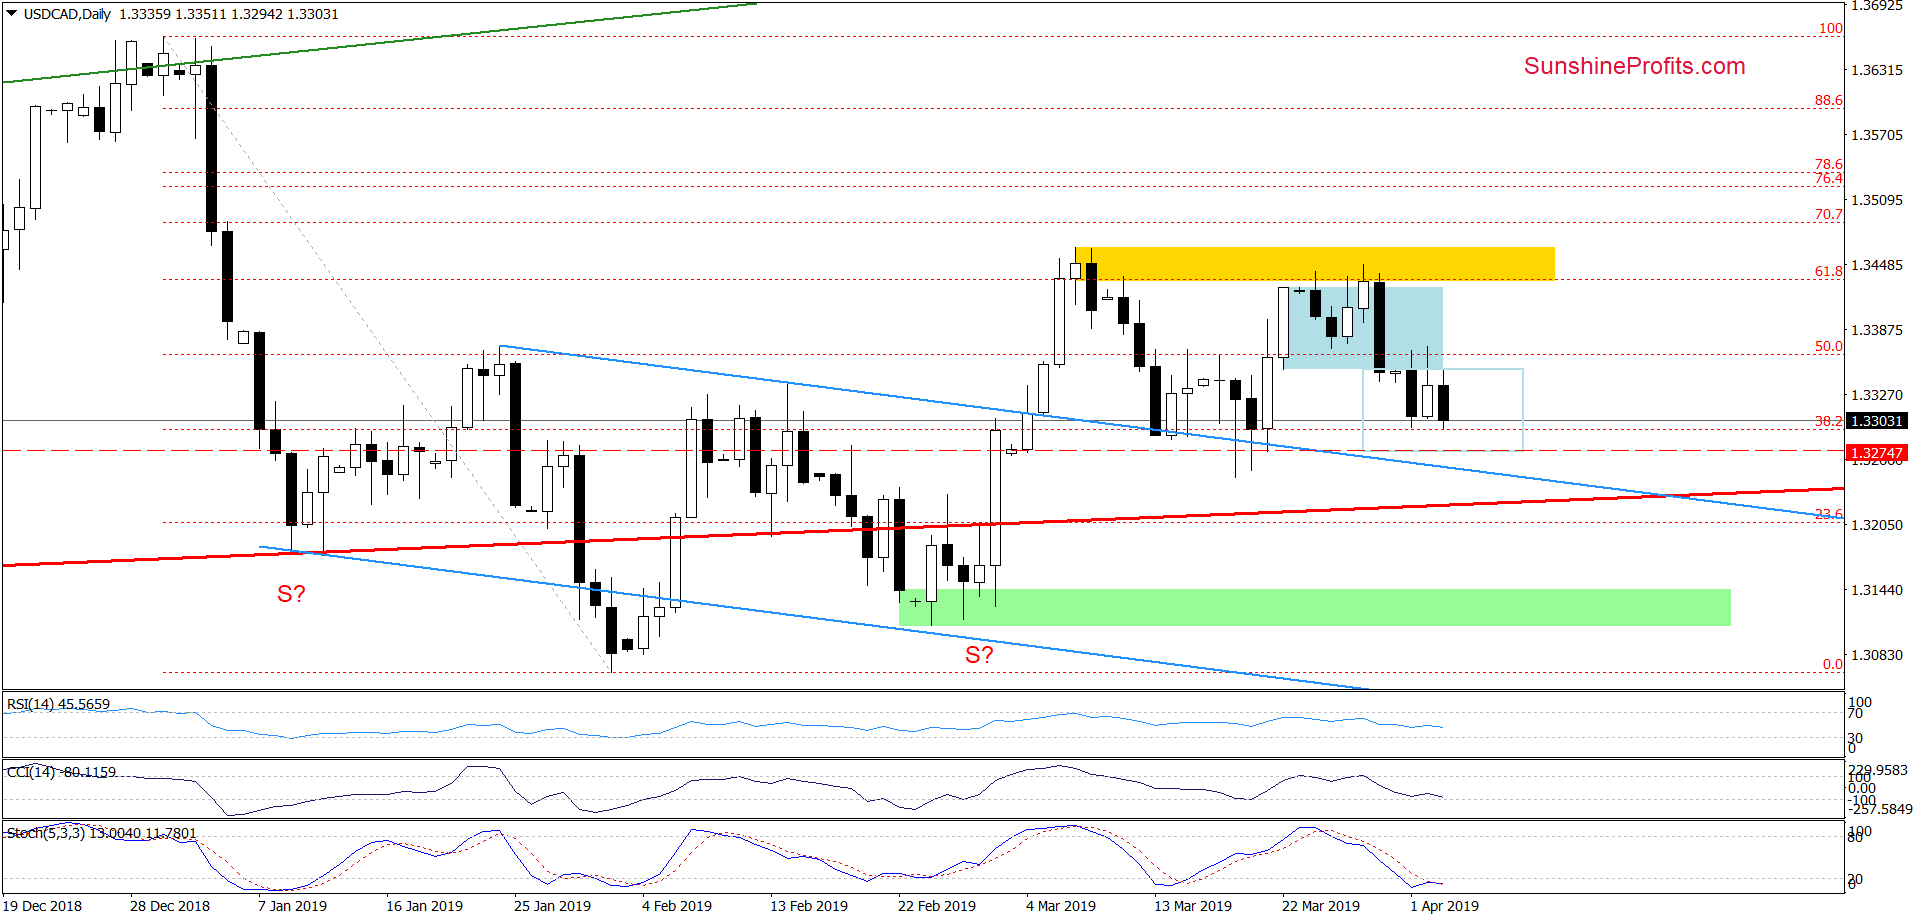
The pair spent most of the second half of March trading inside the blue consolidation and the price action gave bulls a reason to push for higher prices. However, their attempts have mostly come to naught and our decision to close the profitable long positions on March 28 couldn’t have come at a better time.
On Monday, USD/CAD closed the day below the lower border of the blue consolidation. Yesterday’s bullish action erased almost entirely Monday’s decline. It tested the lower border of the formation, but didn’t manage to come back inside.
Therefore it’s our opinion that this upswing was nothing more than a verification of Monday’s breakdown. This is not what a sideways trend looks like and fits in well with the heavy selling we are seeing today.
The pair is slipping below this week’s low, which suggests that we can see a realization of our the bearish scenario we discussed on Monday in a very near future:
(…) the sellers took the exchange rate even lower. Taken together with the sell signals generated by the daily indicators, it increases the probability of further deterioration in the coming days.
If this is indeed the case and USD/CAD declines from current levels, we’ll likely see a drop to around 1.3275. There, the size of the downward move would correspond to the height of the preceding consolidation. However, if this area is broken, the sellers could also retest the strength of the previously-broken upper border of the blue declining trend channel.
If you enjoyed the above analysis and would like to receive free follow-ups, we encourage you to sign up for our daily newsletter – it’s free and if you don’t like it, you can unsubscribe with just 2 clicks. If you sign up today, you’ll also get 7 days of free access to our premium daily Oil Trading Alerts as well as Gold & Silver Trading Alerts. Sign up now!
Thank you.
Nadia Simmons
Forex & Oil Trading Strategist
Sunshine Profits - Effective Investments through Diligence and Care
