
Since my previous essay the short-term situation in light crude has improved. The second half of last week was very good for the oil bulls. U.S. crude oil prices climbed up as robust economic data from the United States and China brightened the outlook for demand in the world's two largest oil consumers. Investors were also encouraged as the U.S. Federal Reserve, at the end of a two-day meeting, showed no signs of reducing the economic stimulus that has broadly underpinned commodities’ prices. These positive circumstances resulted in a two-day rally which took light crude to over $108 per barrel. In this way, the last week’s top almost touched the June’s peak. However, nothing good lasts forever and oil prices dropped on Friday after weak U.S. job numbers disappointed investors.
The beginning of this week brought further deterioration and the price of light crude slipped below $106 per barrel. According to Reuters, oil fell on Tuesday as Iran's new president signaled willingness to negotiate with the West over Tehran's disputed nuclear program.
Having discussed this interesting piece of data, let's take a closer look at the light crude's charts and find out what impact these circumstances had on the price. Have they changed the outlook for light crude? Where are the nearest support zones and resistance levels? What's the current outlook for U.S. crude oil?
As I wrote in my previous essay on crude oil:
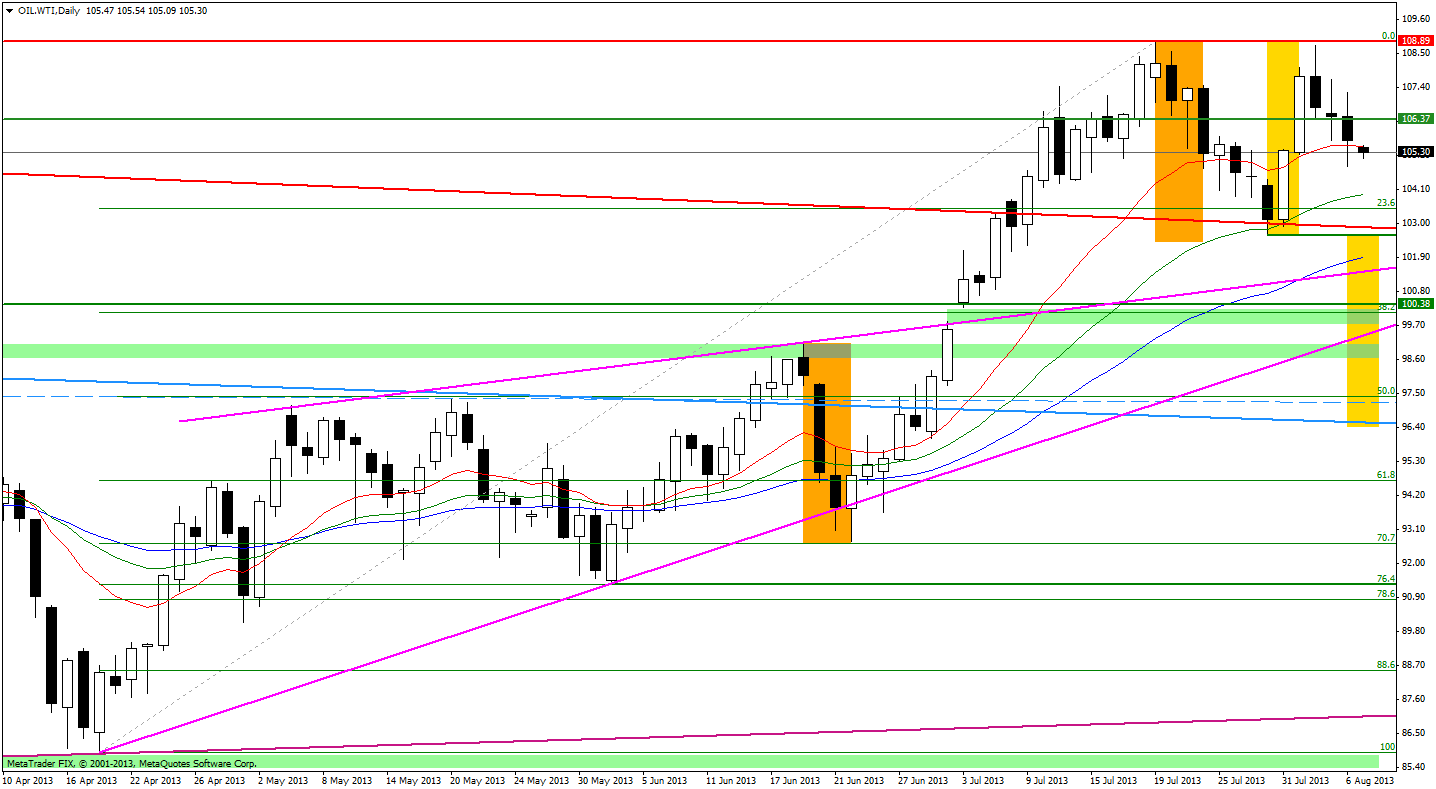
(…) the oil bears showed their claws and triggered a correction which took oil price below (…) $105 per barrel. (…) this area is supported by the July 15 low which, together with the bottom of the last corrective move (the July 11 low), forms a strong support zone. The next support level is based on the upper line of the large triangle based on the May 2011 and March 2012 heights (the red bold line).
As we see on the above chart, after several unsuccessful attempts the sellers managed to push the price below the July 11 low and reached the upper line of the large triangle (the red bold line) on July 30. It’s worth noting that the oil bears broke below it only on an intraday basis.
This strong support level encouraged buyers to act and light crude rebounded sharply in the following days. That increase led light crude's price to over $108 per barrel once again on Friday. In this way, the oil bulls almost touched the July’s four-month high. However, closeness to this strong resistance level encouraged investors to take profits after strong growth.
Taking this into account, in the following days we may see a bearish scenario. In this case the first support is the bottom of the last corrective move (the July 30 low) which, together with the upper line of the large triangle (the red bold line), forms a strong support zone.
At this point, it’s worth mentioning that if oil bears show their claws once again and successfully push the oil price below this strong support zone, we may see a bearish double top pattern. According to theory, the price target for the pattern is around $96.50 per barrel. As you see on the above chart, there is a support in this area - the declining line based on the September 2012 top and the February 2013 peak (the blue bold line).
However, before the sellers shall be able to realize their scenario, they will have to break below several support levels. The first one is the upper line of the rising wedge. The second strong support zone is based on the September 2012 top and the July 3 gap. The next one is the bottom line of the rising wedge and the June 19 top. There is also one more, based on the 50% Fibonacci retracement level around $97.50.
Once we know the current situation from the daily chart, let's zoom in on our picture of the oil market and see the 4-hour chart.
As I wrote in my previous essay:
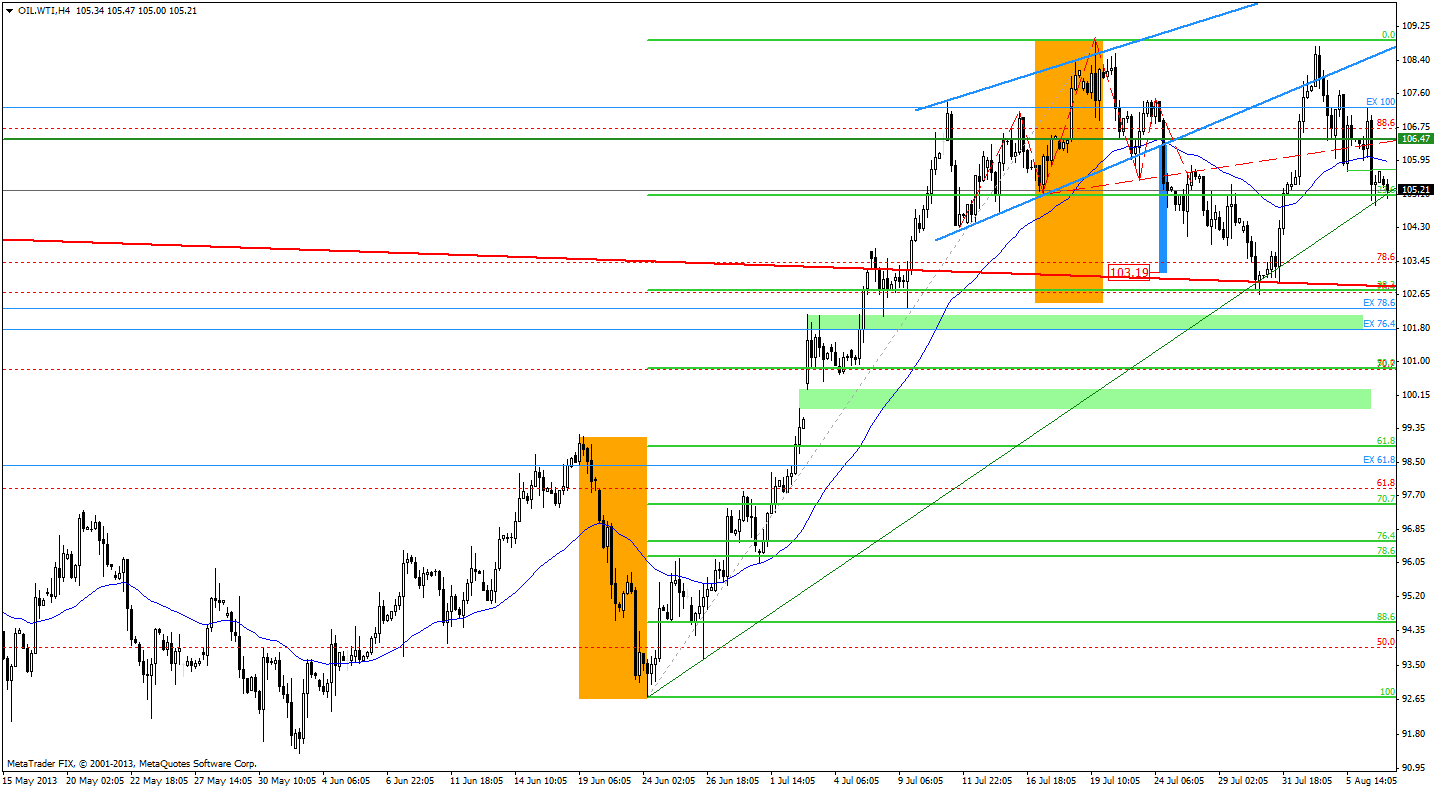
(...) if the price dropped below the bottom line of the rising channel (and the breakdown was confirmed) we could see further declines. The price target for the pattern would be around $103 per barrel (the blue rectangle on the chart).
On the above chart we see that declines at the end of July took light crude's price below $103 per barrel and the price target for the above-mentioned pattern was reached. In this way, the oil bears witnessed their own scenario.
Last time I also wrote that there was one more strong bearish factor – the head and shoulders pattern. According to theory, the price target for the formation was around $101.92. In this case the sellers didn’t manage to push oil prices so low and this strong bearish formation was invalidated in the following days.
At this point, it’s worth to mention that the combination of the 38.2% retracement level, the upper line of the large triangle and the rising uptrend line helped oil bulls to take control and triggered a strong pullback.
As I previously mentioned, the recent increase has led light crude's price to over $108 per barrel. In this way the price of light crude has almost touched the July’s top.
So, what's next?
If the buyers aren’t able to defeat this strong resistance level, we should prepare for further declines which would likely take light crude to the bottom of the last corrective move. However, before we see lower prices, the sellers will have to break below the rising uptrend line which helped oil bulls in the last days of July. Today (at least at the moment when these words are being written), oil bears haven’t broken below it.
Please keep in mind that, if oil bears show their claws once again and push oil price below the bottom of the previous corrective move, we may see a double top pattern.
Summing up, the price of light crude moved higher and almost reached the strong resistance level based on the July 19 top. The proximity to this strong resistance level has encouraged investors to take profits in the recent days. Today (at least at the moment when these words are being written), oil bears haven’t broken below the rising uptrend line (the green thin line on the 4-hour chart) which helped oil bulls in the last days of July. However, if the bears manage to break below this line, we should prepare for further declines which would likely take light crude to the bottom of the last corrective move.
Please remember that you should keep an eye on the today's fresh weekly inventory data from the U.S. Energy Information Administration (EIA) for more trading cues.
Back