
Based on the December 5th, 2013 Oil Trading Alert
In our previous essay we focused on the oil-stocks-to-oil ratio and its implications for oil stocks. However, at the end of November we checked this ratio to find out what impact it could have on future crude oil’s moves. At that time we wrote the following:
(…) the first thing that catches the eye on the above chart is a strong negative correlation between the ratio and the price of light crude.(…) the ratio remains in the gap between the April 2009 low and May 2009 high (…). In all previous cases, such a position of the ratio triggered a correction, which resulted in higher prices of light crude. Additionally, the ratio has approached the 38.2% Fibonacci retracement level (based on the entire 2009-2011 decline), which is a strong resistance level. Taking the above into account, if history repeats itself once again and the ratio declines, we will likely see the bottom of the current correction.
Since that essay was posted, the ratio moved higher and broke above the 38.2% retracement and the September 2009 high. However, at the end of the previous week, both breakouts were invalidated, which was a bearish signal for the ratio and bullish for crude oil. What impact did these circumstances have on light crude? It is said that one picture is worth a thousand words, therefore, let's jump straight into the world of charts and take a look at them in different time horizons. Let’s start with a look at the monthly chart of light crude (charts courtesy by http://stockcharts.com).

In our essay on crude oil from Nov.7, 2013 we wrote:
(…) there are two long-term declining support lines. The blue one is based on the July 2008 and February 2012 highs. When we take this line into account, we see that crude oil broke below it the previous week, which is a bearish sign. However, if we take into account the black long-term support line (based on the July 2008 and May 2011 highs), we see that light crude still remains above it and the situation is not that bearish.
In spite of a drop to a fresh November low, crude oil remained above the black long-term support line based on the July 2008 and May 2011 highs. On top of that, in recent days the situation has improved as light crude climbed above the blue long-term declining support/resistance line. In this way, the breakdown below this line was invalidated, which is a strong bullish sign.
Now, let’s zoom in on our picture of the oil market and see the weekly chart.
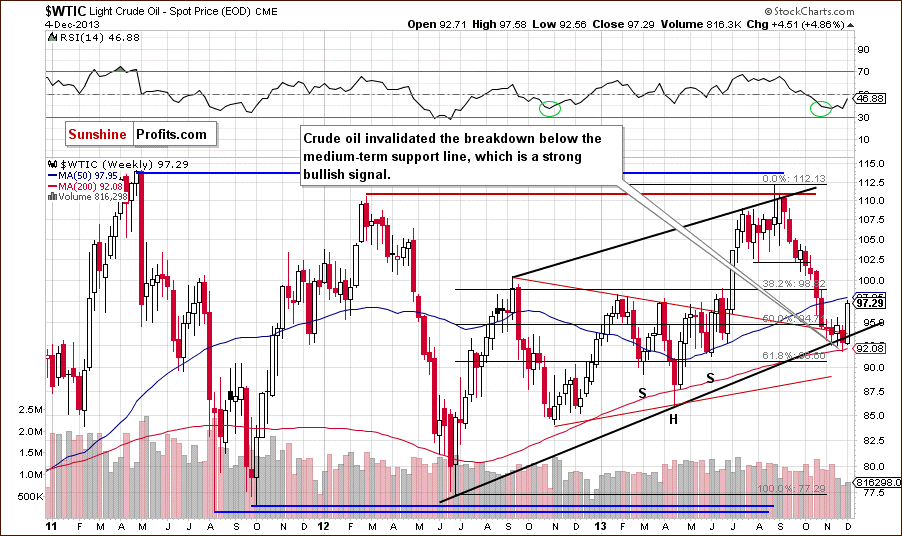
As you can see on the above chart, after three unsuccessful attempts to break below the medium-term support line (marked with the black bold line) oil bears showed their claws and finally pushed the price of light crude below this important support level in the previous week.
Looking at the above chart, we see that after the breakdown below this level crude oil reached its 200-week moving average and pulled back. Despite this fact, it closed last week below the medium-term support line, which was not a positive sign for oil bulls. However, the breakdown was not confirmed. As it turned out, earlier this week, crude oil rebounded sharply and the breakdown was invalidated, which is a strong bullish signal.
Now, let’s check the short-term outlook.
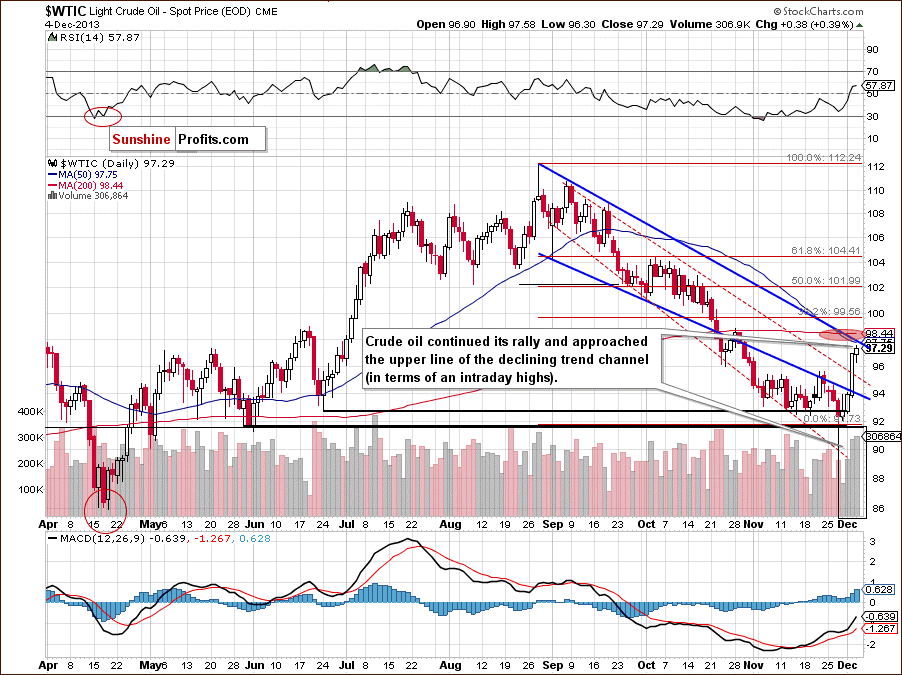
As you can see on the above chart, the situation deteriorated in the previous week. After an invalidation of the breakout above the lower border of the declining trend channel (in terms of intraday lows), crude oil verified the breakdown and declined. Oil bulls didn’t manage to hold the November low and the price hit a fresh monthly low of $91.77. Light crude dropped to the next support level created by the May low (in terms of daily closing prices).
In spite of this drop, last Friday, crude oil rebounded, but the upper shadow of daily candlestick suggested that the proximity to the lower border of the declining trend channel had a negative impact on the price.
As a reminder, at the end of last month, crude oil broke above this resistance level and came back in the range of the declining trend channel in terms of intraday lows. Back then, the proximity to the upper border of the declining trend channel in terms of daily closing prices (marked with the red dashed line) encouraged oil bears to act and light crude invalidated the breakout, which resulted in a new monthly low.
Earlier this week, oil bulls didn’t give up so easily and pushed crude oil above both major short-term resistance levels. Additionally, Tuesday’s breakout materialized on relatively high volume, which confirmed the strength of the buyers. Yesterday, we saw further improvement as crude oil closed the day above $97 for the first time since the end of October.
Summing up, the short-term situation has improved in recent days as crude oil broke above both short-term resistance lines on relatively high volume. Additionally, light crude came back above the previously-broken medium-term support line and the long-term one, which is another bullish signal. Taking these facts into account and combining them with declines in the oil-stocks-to-oil ratio we can assume that the worst is already behind oil bulls and further improvement is likely.
In order to stay updated on the latest developments on the crude oil market and receive my trading suggestions as soon as possible, I would like to invite you to subscribe to my Oil Trading Alerts - you can still do so at the price of $2 for the first 3 weeks.
Thank you.
Nadia Simmons
Sunshine Profits' Crude Oil Expert
Oil Investment Updates
Oil Trading Alerts
