Although AUD/USD moved sharply higher in the previous week, bulls' achievements from the last days are not so impressive. Do they lost the strength to continue the rally?
- EUR/USD: none
- GBP/USD: short (a stop-loss order at 1.2869; the initial downside target at 1.2490)
- USD/JPY: none
- USD/CAD: none
- USD/CHF: none
- AUD/USD: none
EUR/USD
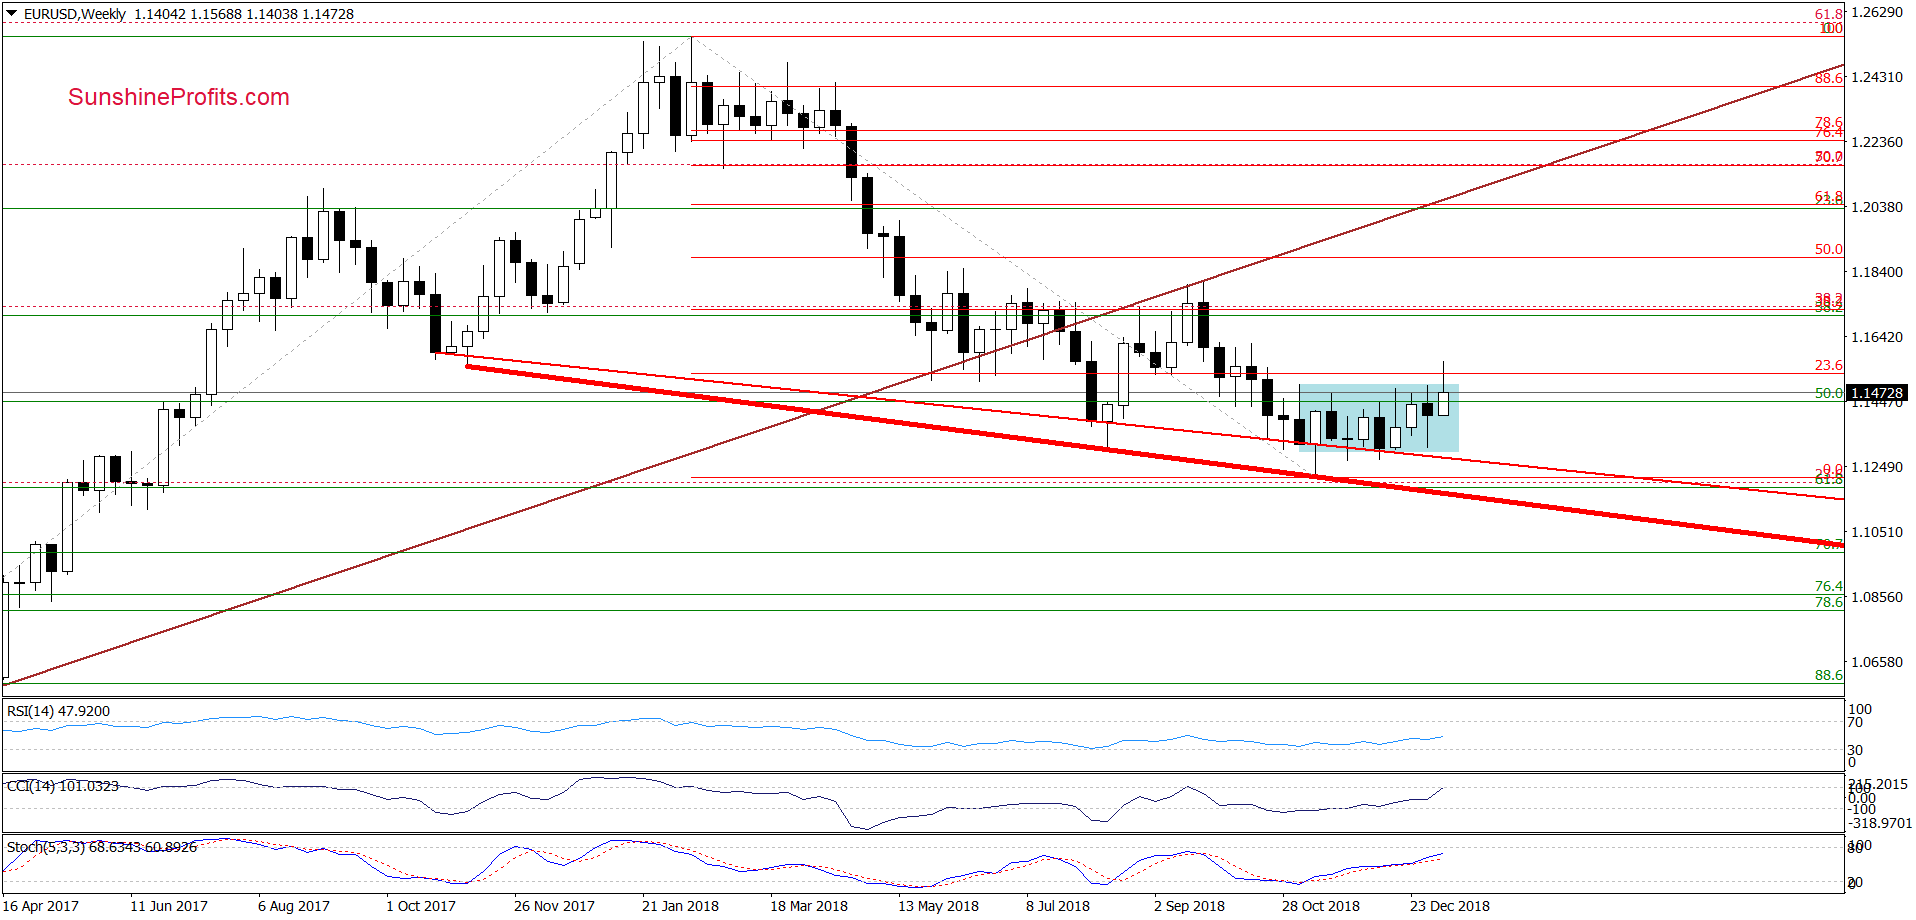
On the weekly chart, we see that although EUR/USD increased and broke above the upper border of the blue consolidation earlier this week, the improvement was very temporary, and the exchange rate pulled back, invalidating the earlier breakout.
How did this move affect the very short-term chart? Let’s check below.
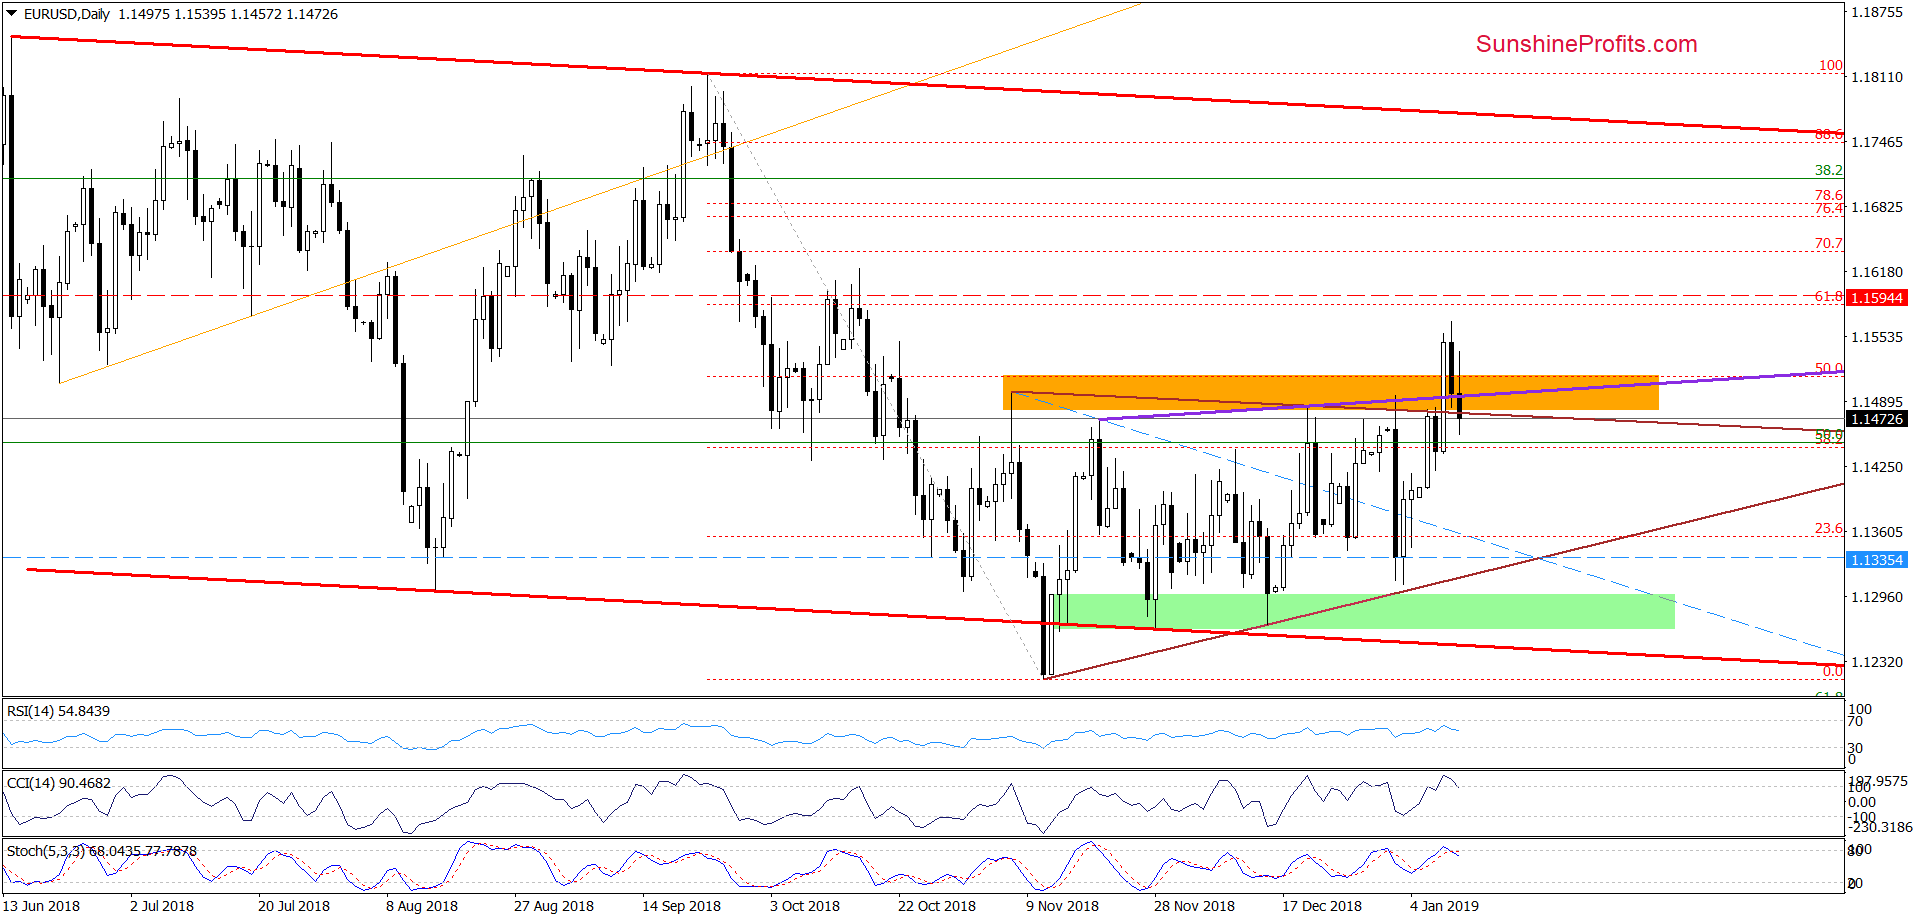
From this perspective, we see that despite the earlier breakout above the upper border of the brown triangle, the orange resistance zone and the 50% Fibonacci retracement, currency bulls didn’t manage to hold gained levels, which resulted in a correction.
Thanks to yesterday’s decline the pair invalidated the breakout above the orange zone and the Fibonacci retracement, which triggered further deterioration earlier today.
As a result, EUR/USD slipped below the purple support line based on the previous peaks and the upper border of the brown triangle, which in combination with the current position of the daily indicators (the CCI and the Stochastic Oscillator generated sell signals) suggests further deterioration in the coming week.
This scenario will be even more likely if the exchange rate closes today’s session under all these support/resistance levels. If we see such price action, we’ll likely open short positions because currency bears could take the pair to around 1.1335 or even the lower border of the brown triangle in the following days (currently at 1.1316). We will keep you informed should anything change, or should we see a confirmation/invalidation of the above.
Trading position (short-term; our opinion): No positions are justified from the risk/reward perspective.
USD/CHF
In our last commentary on tis currency pair, we wrote the following:
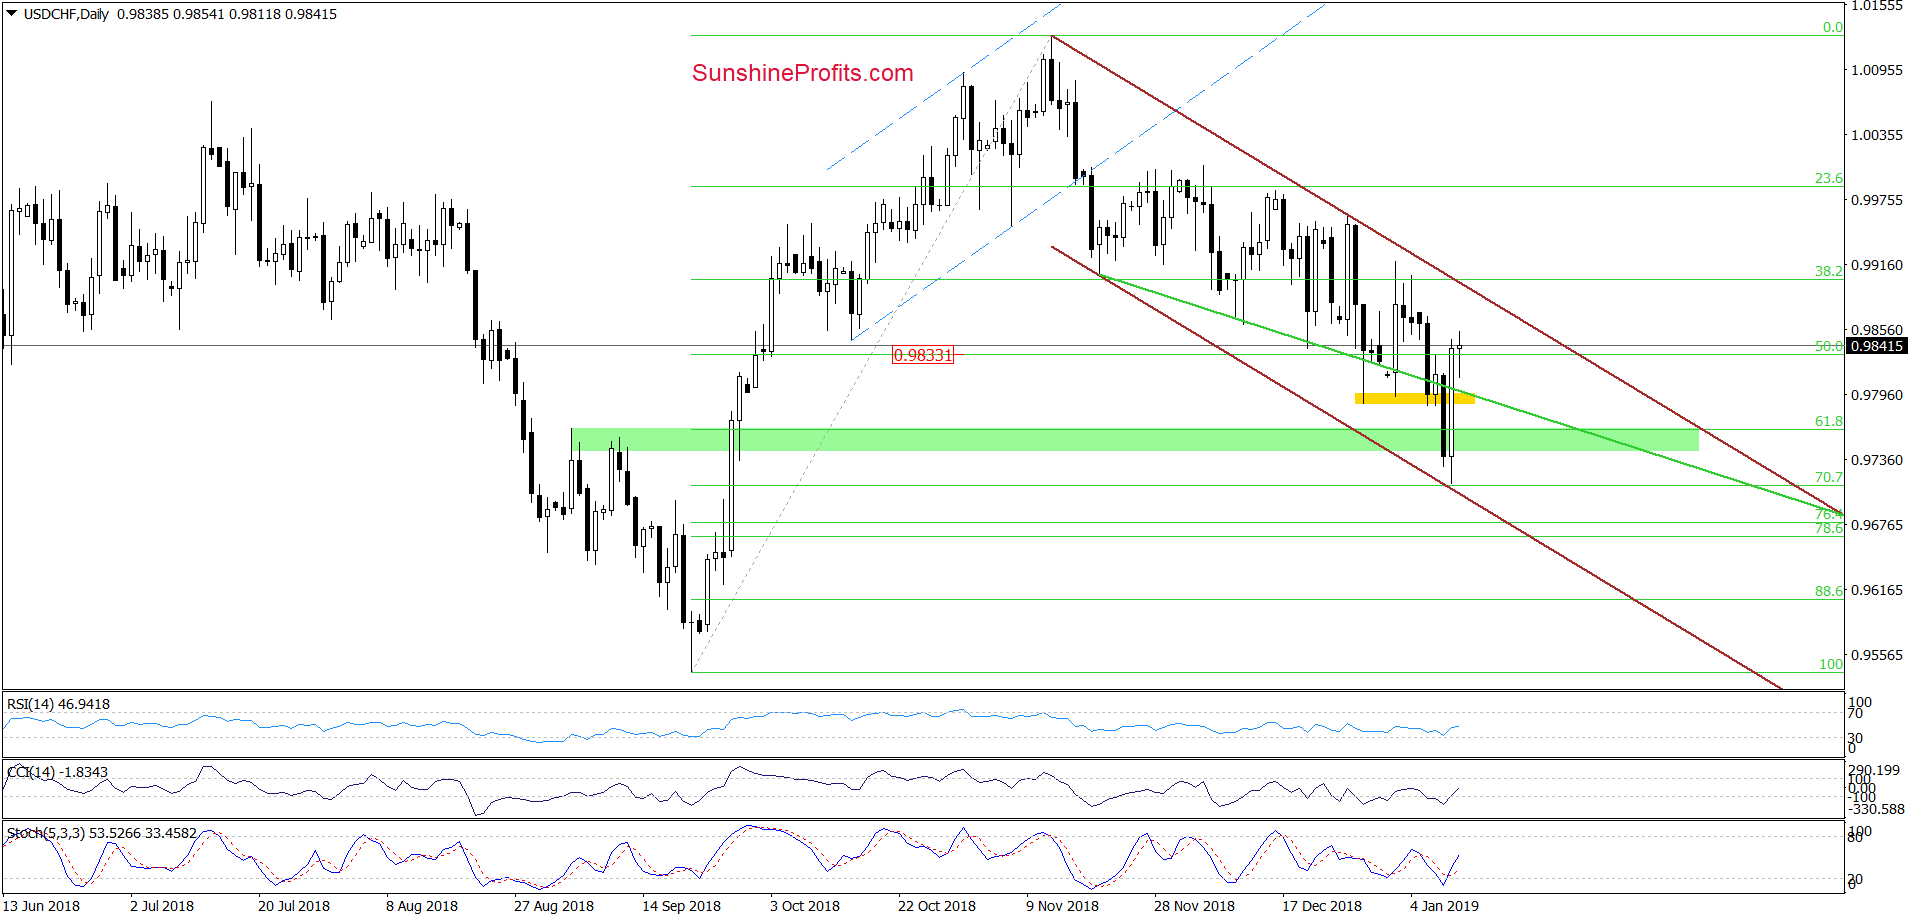
(…) the bears finished the day below the green support line based on the late-November and December lows.
This is a bearish development, which could translate into further deterioration and at least a test of the green support zone (created by the early-September 2018 peaks and the 61.8% Fibonacci retracement based on the September-November increases) if the buyers do not manage to invalidate yesterday’s breakdown later in the day.
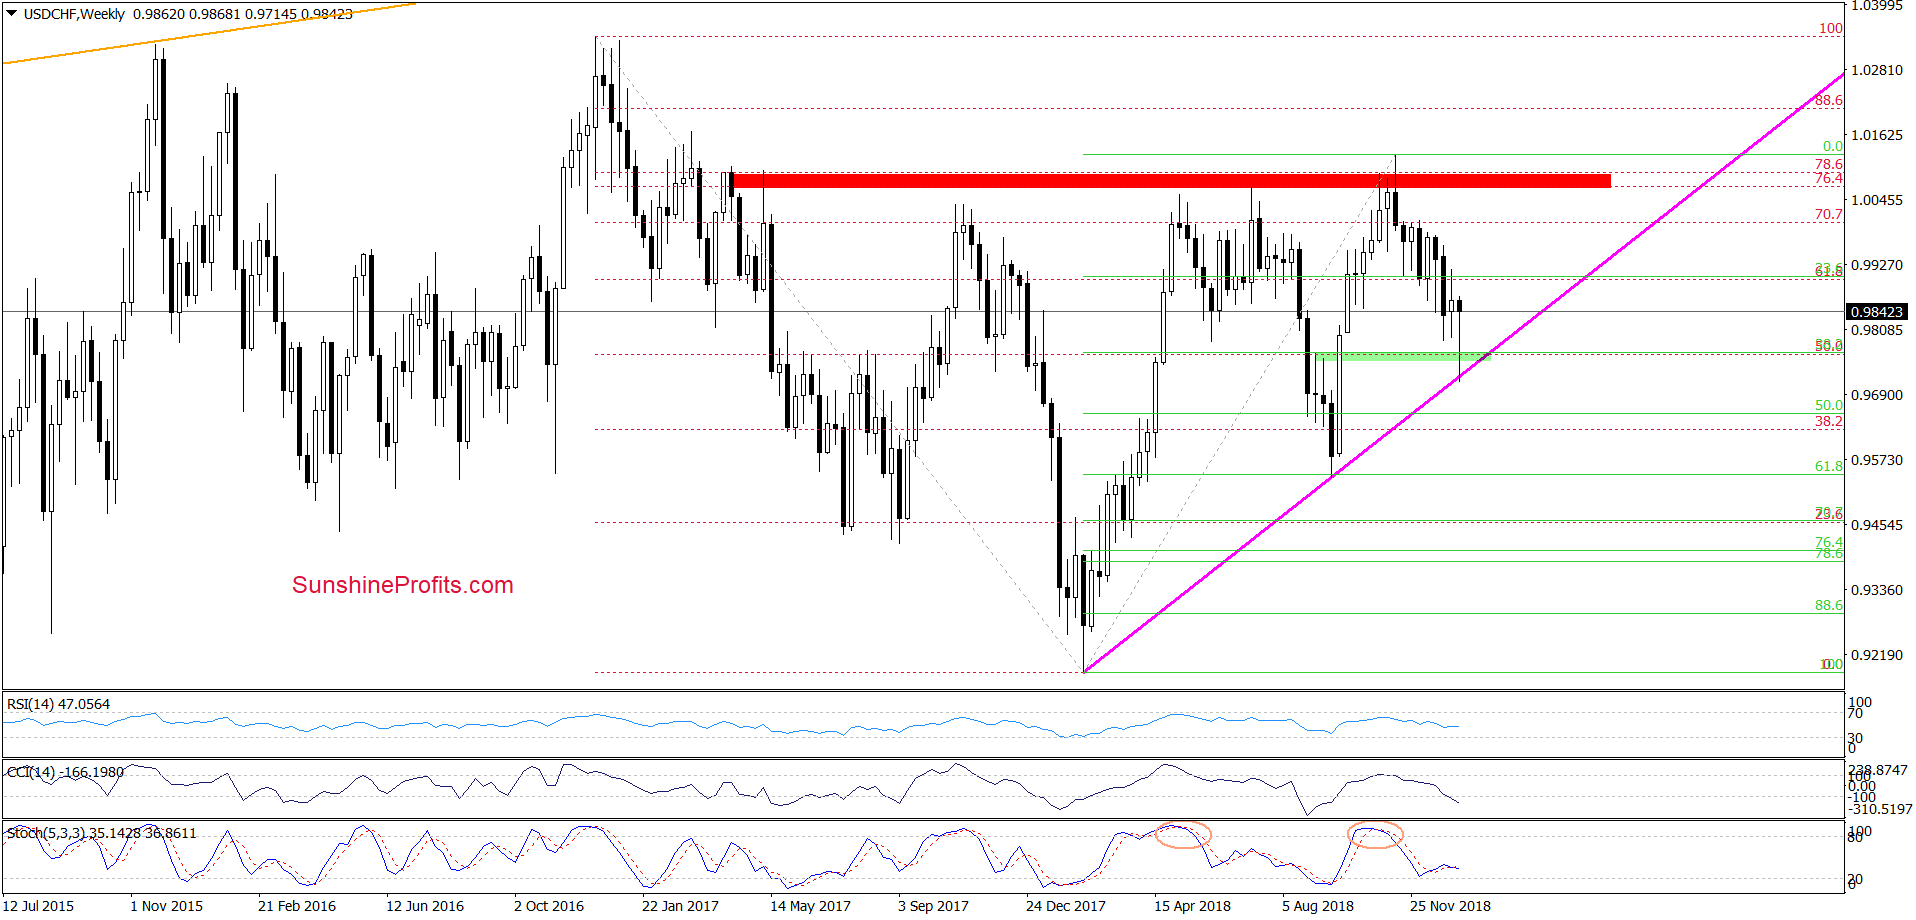
(…) this area is also reinforced by two other supports seen more clearly from the medium-term perspective – the 38.2% Fibonacci retracement (based on the entire 2018 upward move) and the pink rising support line based on the February 2018 and September 2018 lows.
Looking at the above chart, we see that the situation developed in line with the above assumptions and USD/CHF extended losses earlier this week. Thanks to the recent drop, the pair not only tested the green support zone, but also slipped below it, reaching the 70.7% Fibonacci retracement and the lower border of the brown declining trend channel.
As you see, the combination of these supports encouraged currency bulls to act, which resulted in a sharp rebound during yesterday’s session. Additionally, the pair broke above the green resistance line based on the previous lows, invalidating the earlier breakdown. On top of that, the CCI and the Stochastic Oscillator generated buy signals, suggesting that further improvement in the coming week should not surprise us.
Nevertheless, in our opinion, such price action will be more likely and reliable if the pair breaks above the upper border of he brown declining trend channel. If we see such price action, we’ll likely open long positions.
Trading position (short-term; our opinion): No positions are justified from the risk/reward perspective. We will keep you informed should anything change, or should we see a confirmation/invalidation of the above.
AUD/USD
Quoting our last commentary on this currency pair:
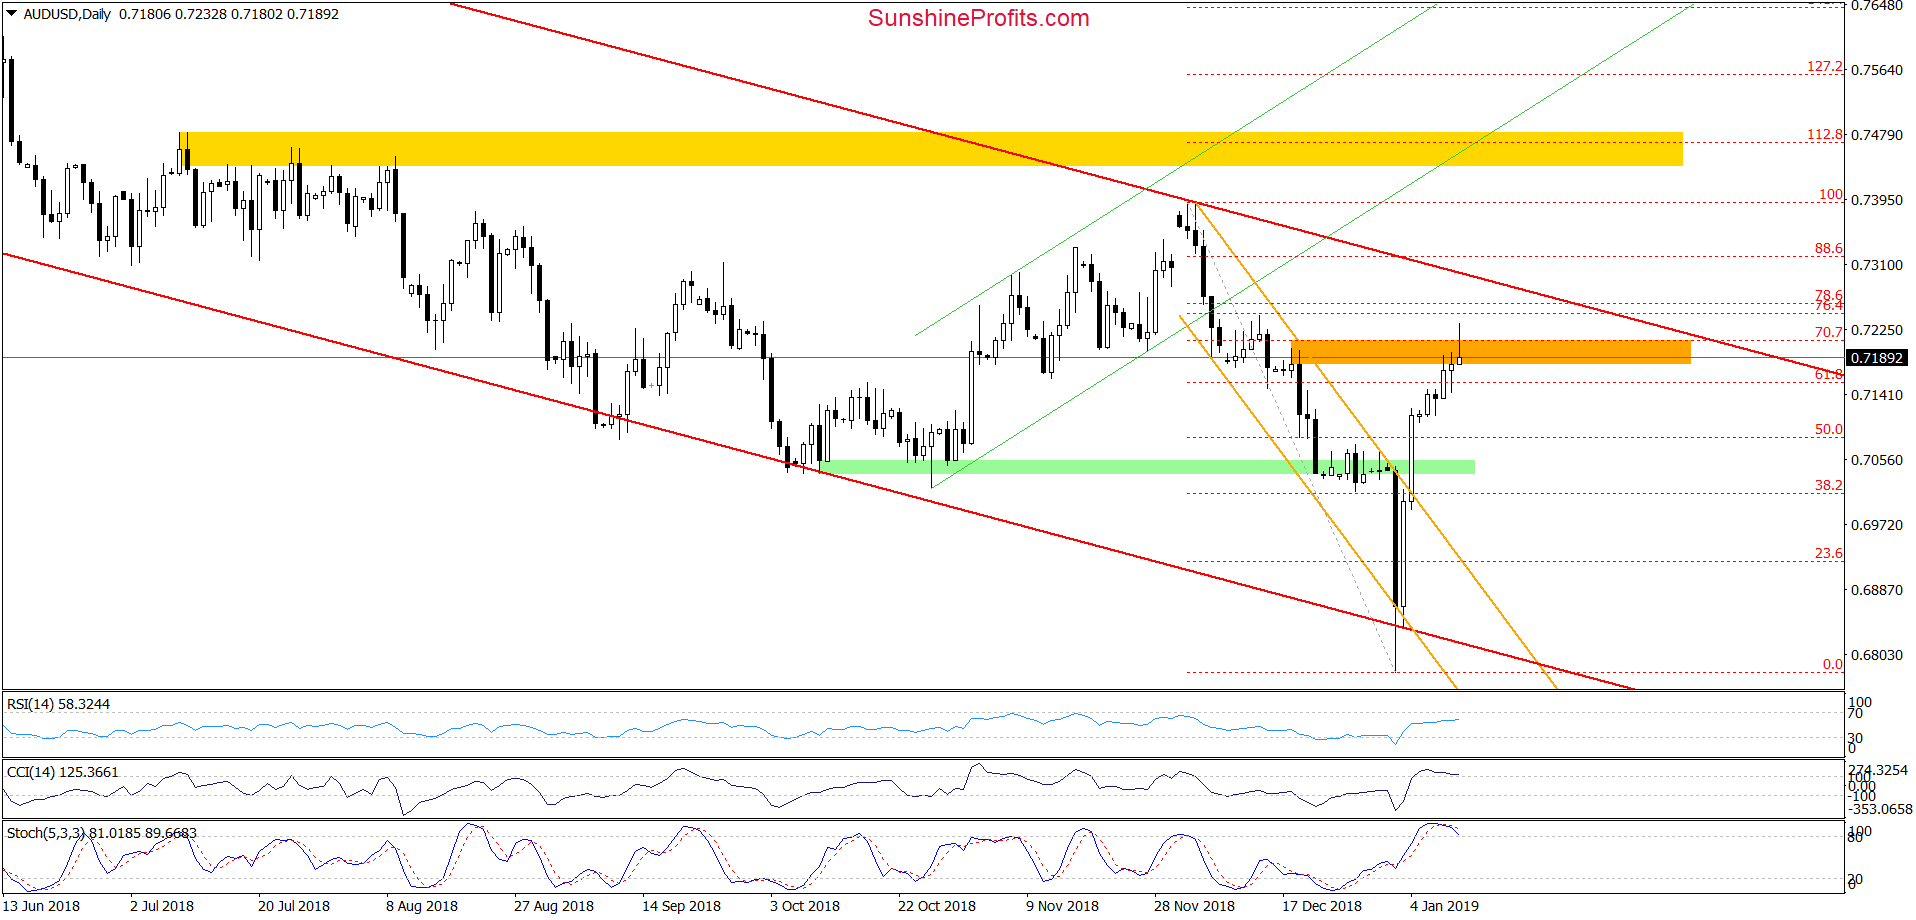
(…) Earlier today, we saw one more attempt to move higher, which in combination of the lack of the sell signals suggests that the pair will likely test the 61.8% retracement in the very near future. Nevertheless, taking into account the current position of the daily indicators, we think that the space for increases is limited and reversal in the coming days should not surprise us.
On the daily chart, we see that currency bulls pushed the exchange rate higher, which resulted in a breakout above the 61.8% Fibonacci retracement and a test of the next retracement and the orange resistance zone based on the mid-December highs.
Despite this improvement, the sellers took control on the trading floor earlier today, which resulted in a pullback and invalidation of today’s breakout above the mentioned resistances. Additionally, the Stochastic Oscillator generated a sell signal (while the CCI is very close to doing the same), increasing the probability of further deterioration in the coming week.
In our opinion, this scenario will be even more likely and reliable if the pair closes today’s session under the 70.7% retracement and the upper border of the orange zone. If we see such price action, we’ll consider going short. We will keep you informed should anything change, or should we see a confirmation/invalidation of the above.
Trading position (short-term; our opinion): No positions are justified from the risk/reward perspective.
Thank you.
Nadia Simmons
Forex & Oil Trading Strategist
Przemyslaw Radomski, CFA
Editor-in-chief, Gold & Silver Fund Manager


