

After the volatile end to the last week, most pairs are experiencing modest moves so far today. Can these develop into something more meaningful, into something perspective-changing? After all, euro bulls are on the move today. They’re joined by similarly-minded Australian dollar bulls. What kind of staying power do they have? Does it reflect anyhow on our open profitable position in the Japanese yen?
In our opinion, the following forex trading positions are justified - summary:
- EUR/USD: short (a stop-loss order at 1.1501; the next downside target at 1.1240)
- GBP/USD: none
- USD/JPY: short (a stop-loss order at 112.32; the initial downside target at 109.82)
- USD/CAD: long (a stop-loss order at 1.3228; the initial upside target at 1.3530)
- USD/CHF: none
- AUD/USD: none
EUR/USD
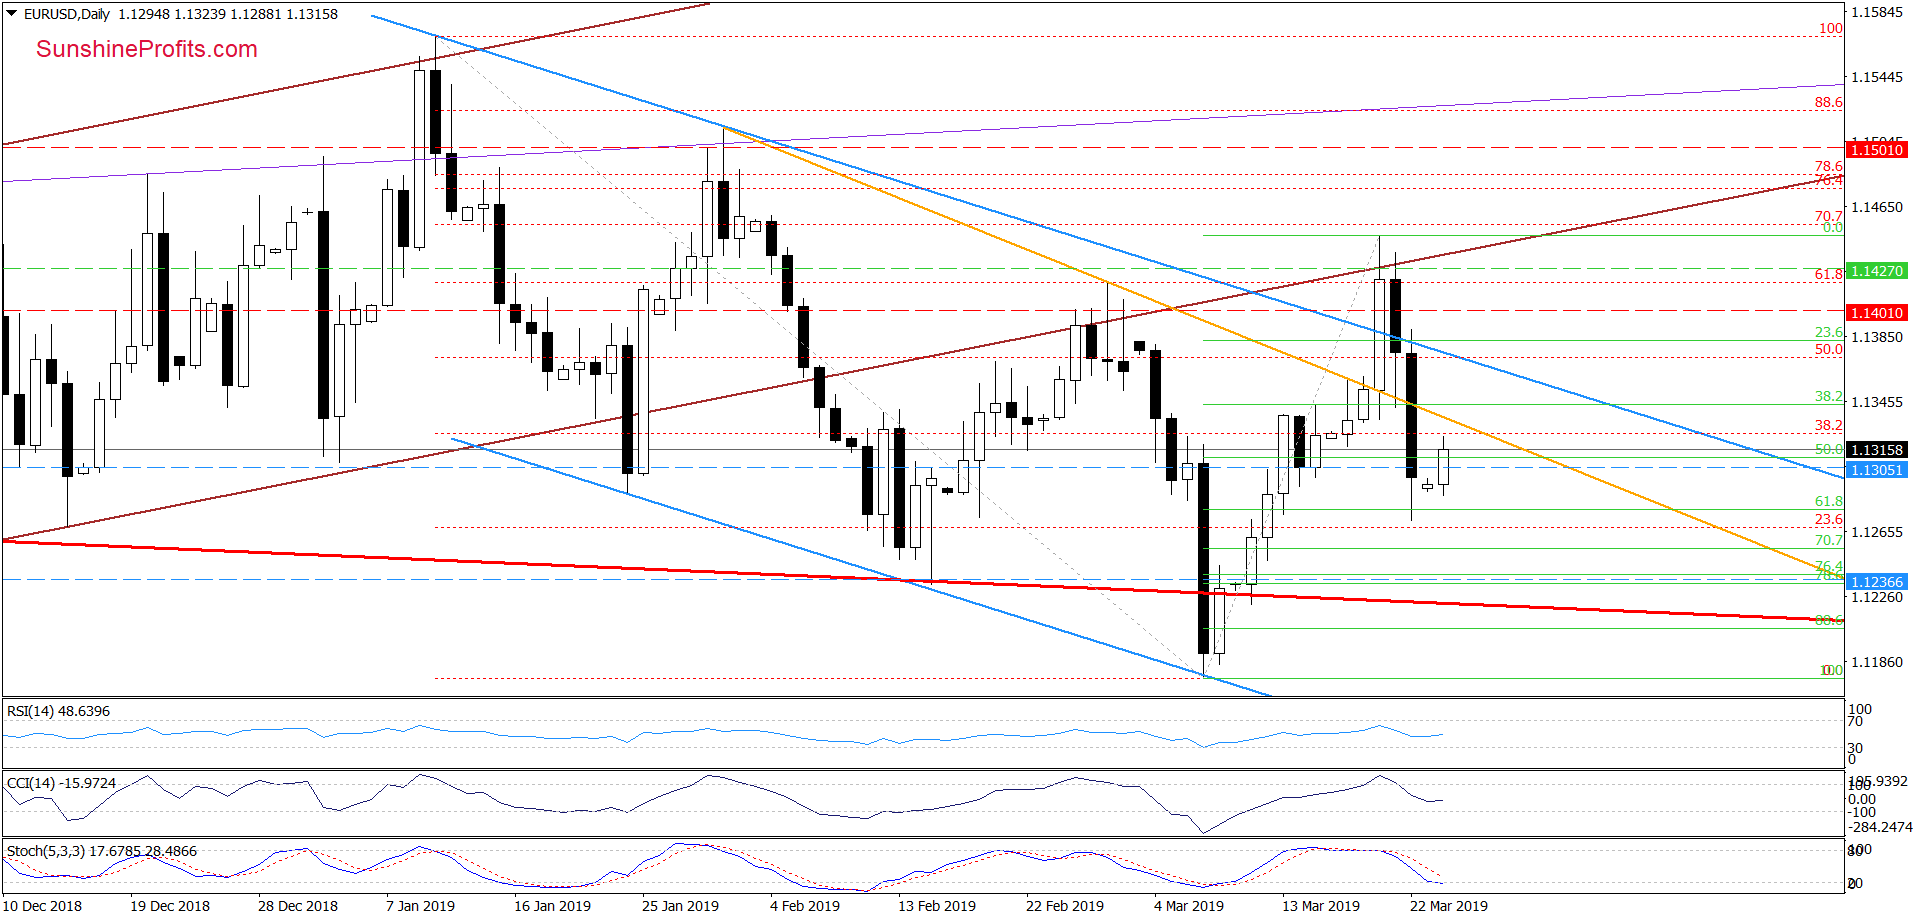
Starting the week, EUR/USD moved higher earlier today. However, the pair is still trading below the orange resistance line, which suggests that today’s move can be nothing more than a verification of Friday’s breakdown beneath it.
The sell signals from the CCI and Stochastics remain on the cards. Another attempt to move lower is likely still ahead of us. If this is the case, the exchange rate will reverse shortly and extend last week’s decline.
How low could the pair go next? It’s most fitting to quote our Friday’s Alert:
(…) If the situation develops in tune with this assumption, EUR/USD will extend losses and test the next Fibonacci retracement or even the lower border of the long-term red declining trend channel (currently at around 1.1232) in the coming week.
Trading position (short-term; our opinion): Profitable short positions with a stop-loss order at 1.1501 and the next downside target at 1.1240 are justified from the risk/reward perspective.
USD/CHF
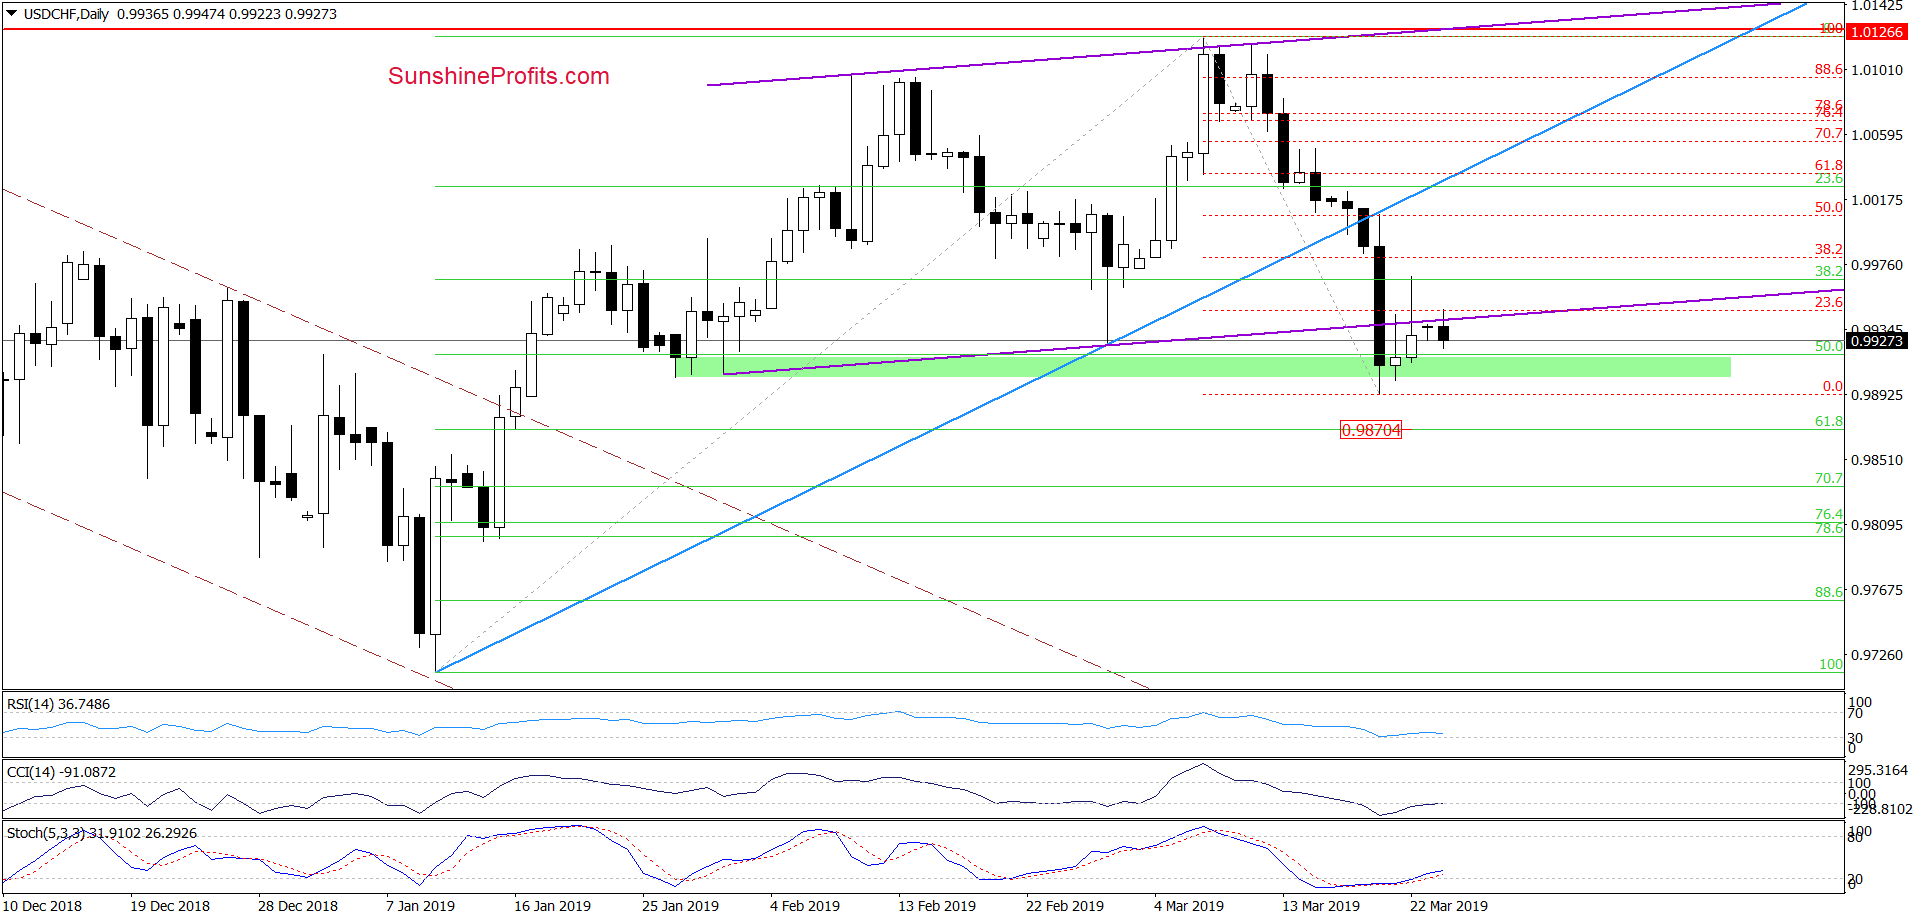
On Wednesday, the pair broke below the lower border of the purple rising trend channel. Both on Thursday and Friday, the bulls fought to invalidate the breakdown but ultimately failed.
Neither today have they had much success. The pair is heading down and currently trades at around 0.9930. Such price action suggests that buyers are still quite weak, which can translate into a test of last week’s lows at a minimum. However, if the green support zone marking them is broken, we can see a drop even to around 0.9870, where the 61.8% Fibonacci retracement is.
Trading position (short-term; our opinion): No positions are justified from the risk/reward perspective. We will keep you informed should anything change, or should we see a confirmation/invalidation of the above.
AUD/USD
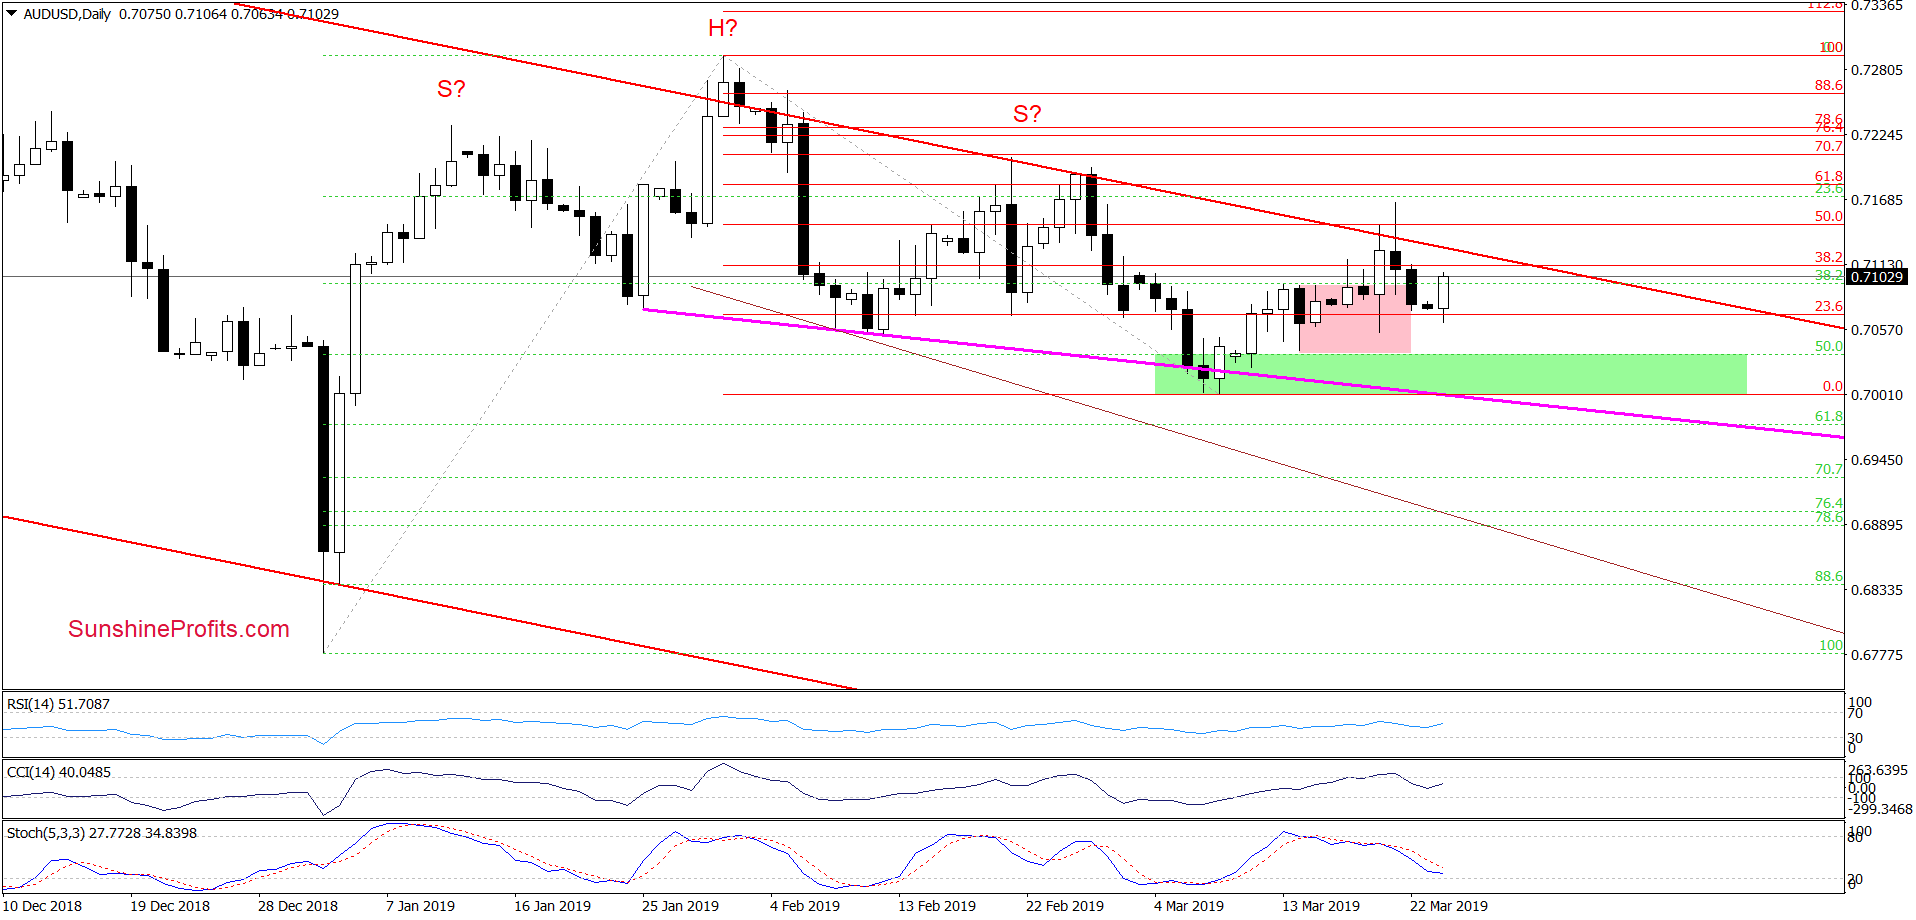
On Thursday, AUD/USD invalidated its tiny breakout above the upper border of the red declining trend channel. This was not unexpected as we’ve written these words still on Thursday:
(…) On the surface, this looks to be a bullish sign. Nevertheless, the current position of the daily indicators suggests that the space for gains may be limited. Especially, when we factor in the proximity to the 61.8% Fibonacci retracement and the late-February peaks.
Despite this bearish turn of events, the buyers took the pair higher earlier today, which suggests another retest of the red declining trend channel in the very near future. Lacking a successful breakout above it, the way to higher exchange rate levels remains closed.
Trading position (short-term; our opinion): No positions are justified from the risk/reward perspective. We will keep you informed should anything change, or should we see a confirmation/invalidation of the above.
Thank you.
Nadia Simmons
Forex & Oil Trading Strategist

