

After the last week’s sharp decline currency bulls triggered a rebound, which managed to invalidate two breakdowns under the long-term lines. Does this mean that the worst is already behind the buyers and we can expect a further rally?
- EUR/USD: short (a stop-loss order at 1.1525; the initial downside target at 1.1250)
- GBP/USD: short (a stop-loss order at 1.2844; the initial downside target at 1.2490)
- USD/JPY: none
- USD/CAD:none
- USD/CHF:none
- AUD/USD:none
EUR/USD
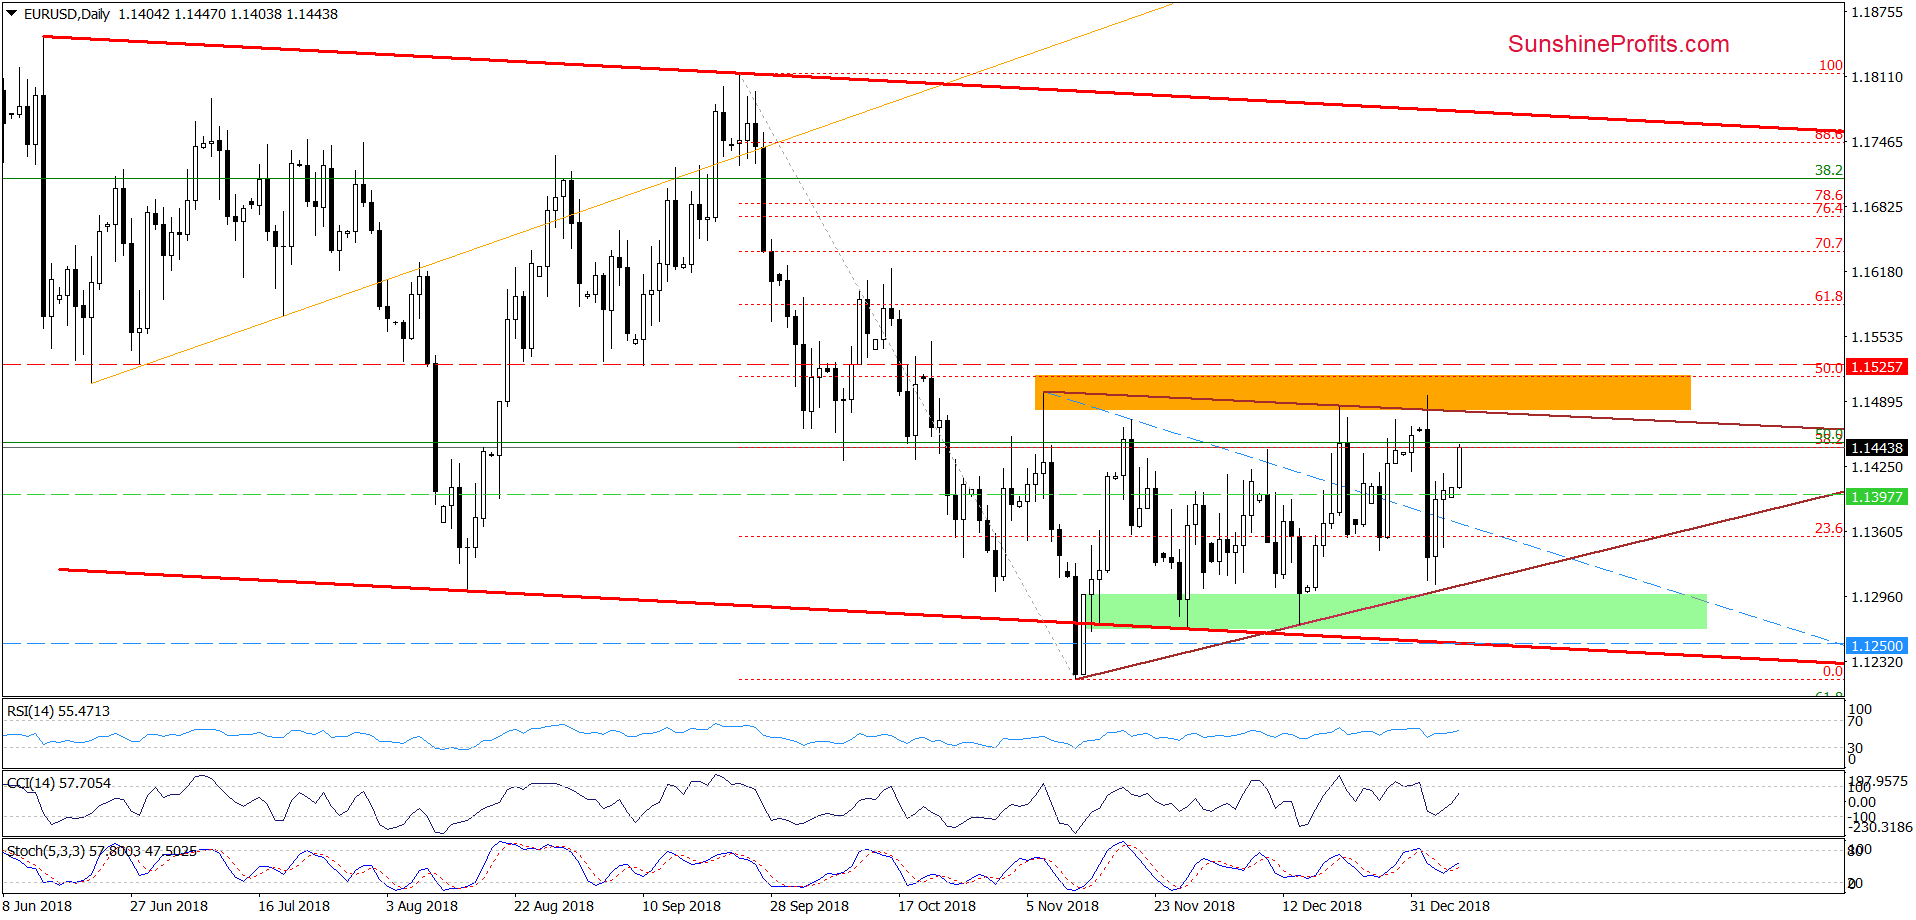
Looking at the daily chart, we see that although EUR/USD extended gains earlier today, the exchange rate is still trading under the orange resistance zone and the brown declining resistance line based on the previous highs.
Therefore, in our opinion as long as there is no breakout above them all upswings could be nothing more than a verification of the earlier breakdown. If this is the case, the pair will reverse in the very near future and the first downside target for the sellers will be the brown rising support line based on the November and mid-December lows.
Trading position (short-term; our opinion): Short positions with a stop-loss order at 1.1525 and the initial downside target at 1.1250 are justified from the risk/reward perspective.
USD/JPY
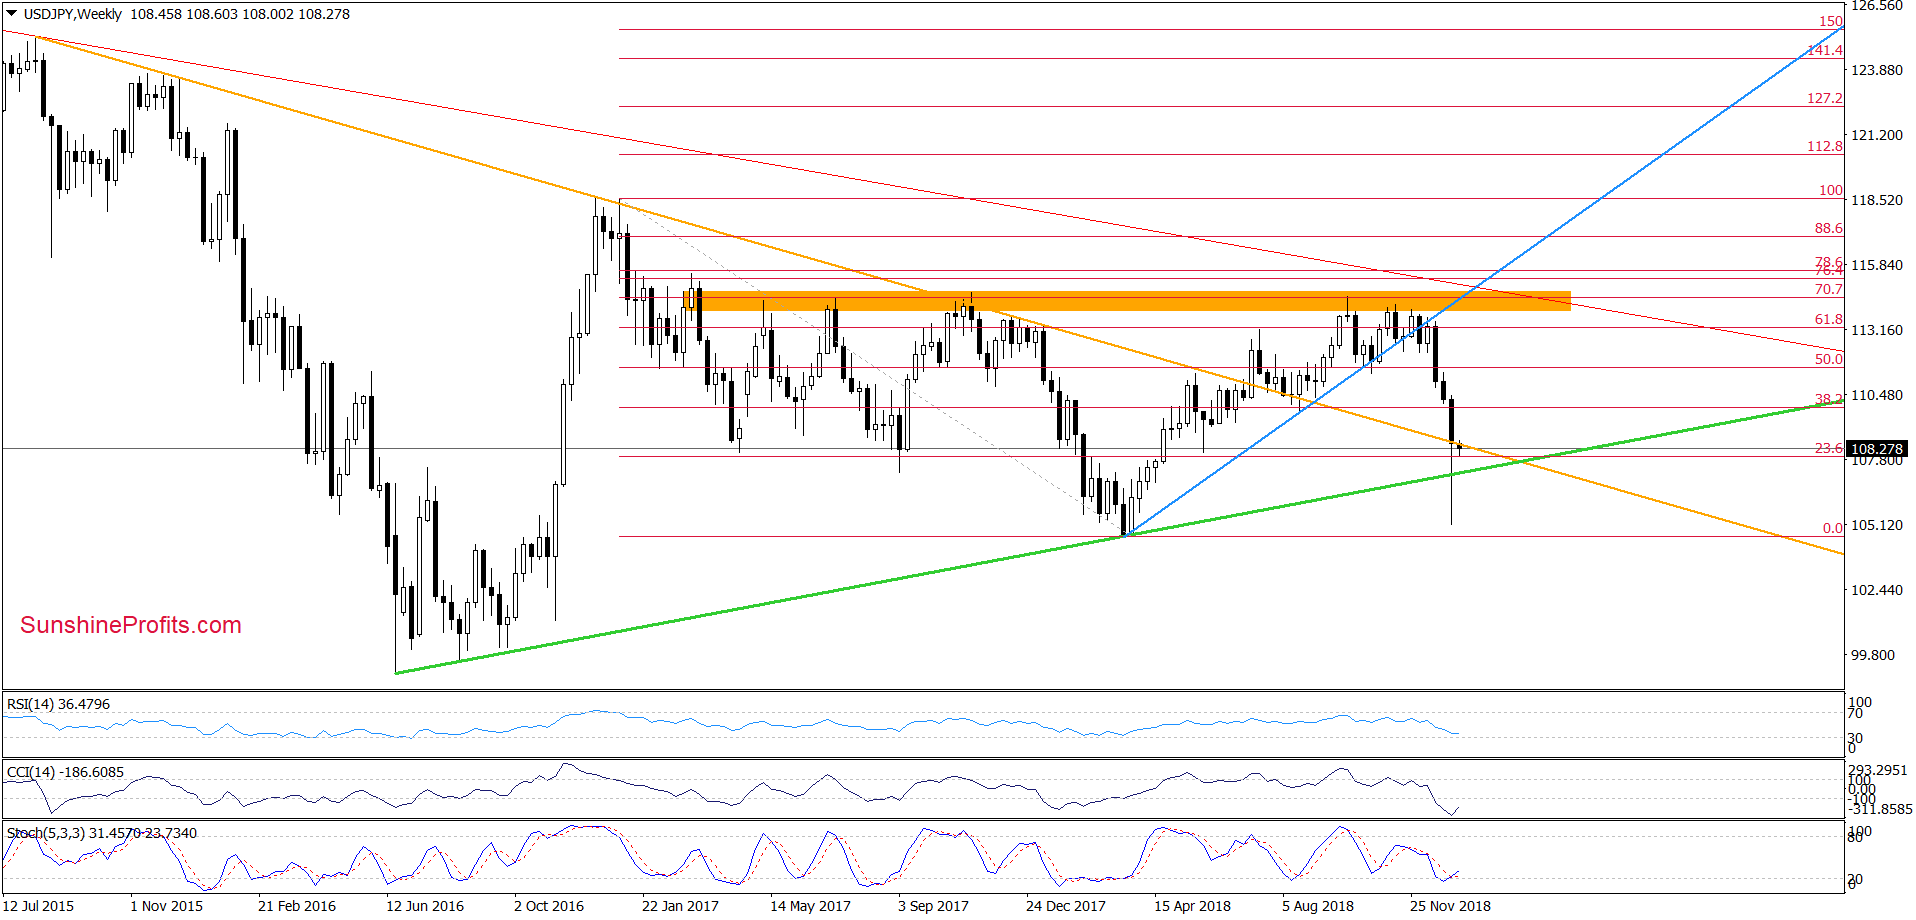
The first thing that catches the eye on the medium-term chart is the last week’s very sharp decline, which took USD/JPY not only under the long-term green support line (based on June 2016, August 2016 and March 2018 lows), but also below the previously-broken orange declining line (based on August 2015, November 2015 and December 2016 peaks).
Despite this deterioration, currency bulls managed to stop the sellers and triggered a rebound, which pushed the exchange rate to the above-mentioned lines. In this way, the bulls invalidated the earlier breakdown under these lines, which is a positive development that suggests further improvement in the coming week.
Nevertheless, the sellers triggered one more downswing earlier today, which means that higher values of USD/JPY will be more likely and reliable if the pair returns above the orange line.
Will the daily chart give currency bulls more reasons to act? Let’s check.
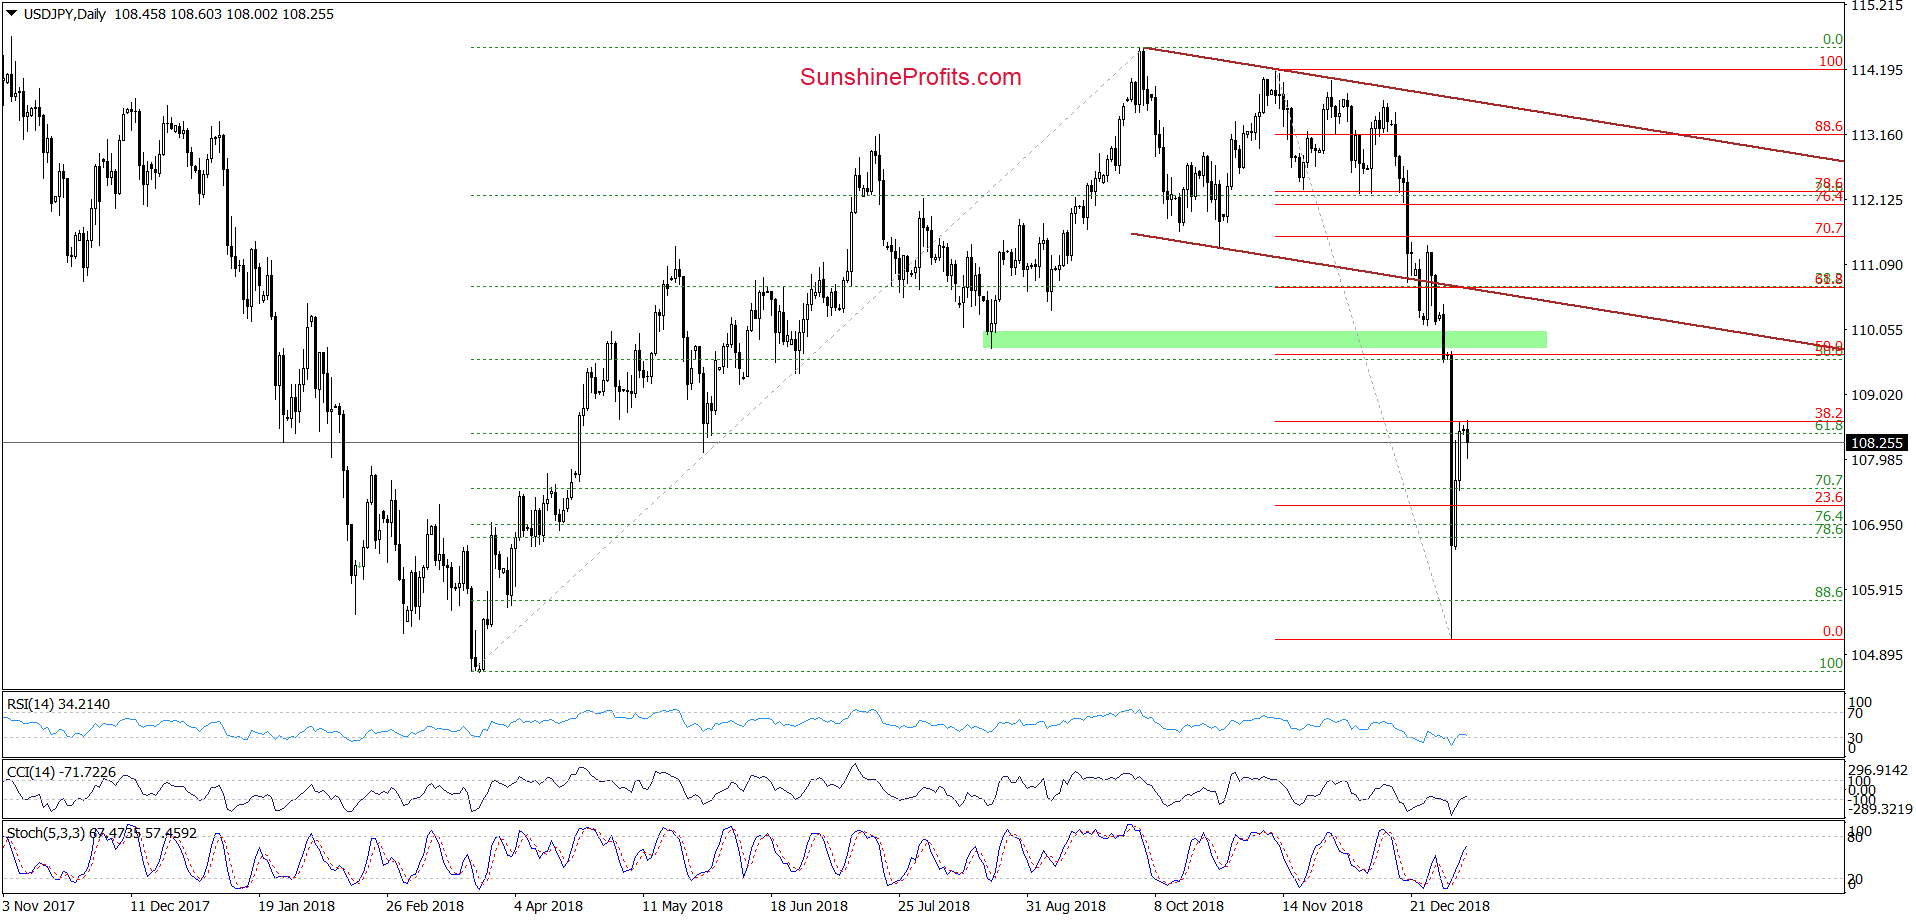
From this perspective, we see that the recent rebound took USD/JPY to the 38.2% Fibonacci retracement based on the recent sharp decline, which suggests that further improvement will be more likely if the bulls break above this resistance.
At this point it is worth noting that the buy signals generated by the indicators remain in the cards, supporting the buyers and another attempt to move higher. If this is the case and USD/JPY increase from here, we’ll likely see a test of the previously-broken green zone or even the lower border of the brown declining trend channel in the coming week.
Trading position (short-term; our opinion): No positions are justified from the risk/reward perspective. We will keep you informed should anything change, or should we see a confirmation/invalidation of the above.
AUD/USD
In our last commentary on this currency pair, we wrote:
(…) the pair declined not only to the above-mentioned lower border of the red declining trend channel, but also tested the 161.8% Fibonacci extension and the lower border of the short-term orange declining trend channel.
(…) the combination of these supports encouraged the bulls to act and AUD/USD closed Wednesday’s session above them, invalidation the earlier tiny breakdowns. This positive development triggered further improvement earlier today, which suggests that we’ll likely see a test of the previous lows and the green zone in the very near future.
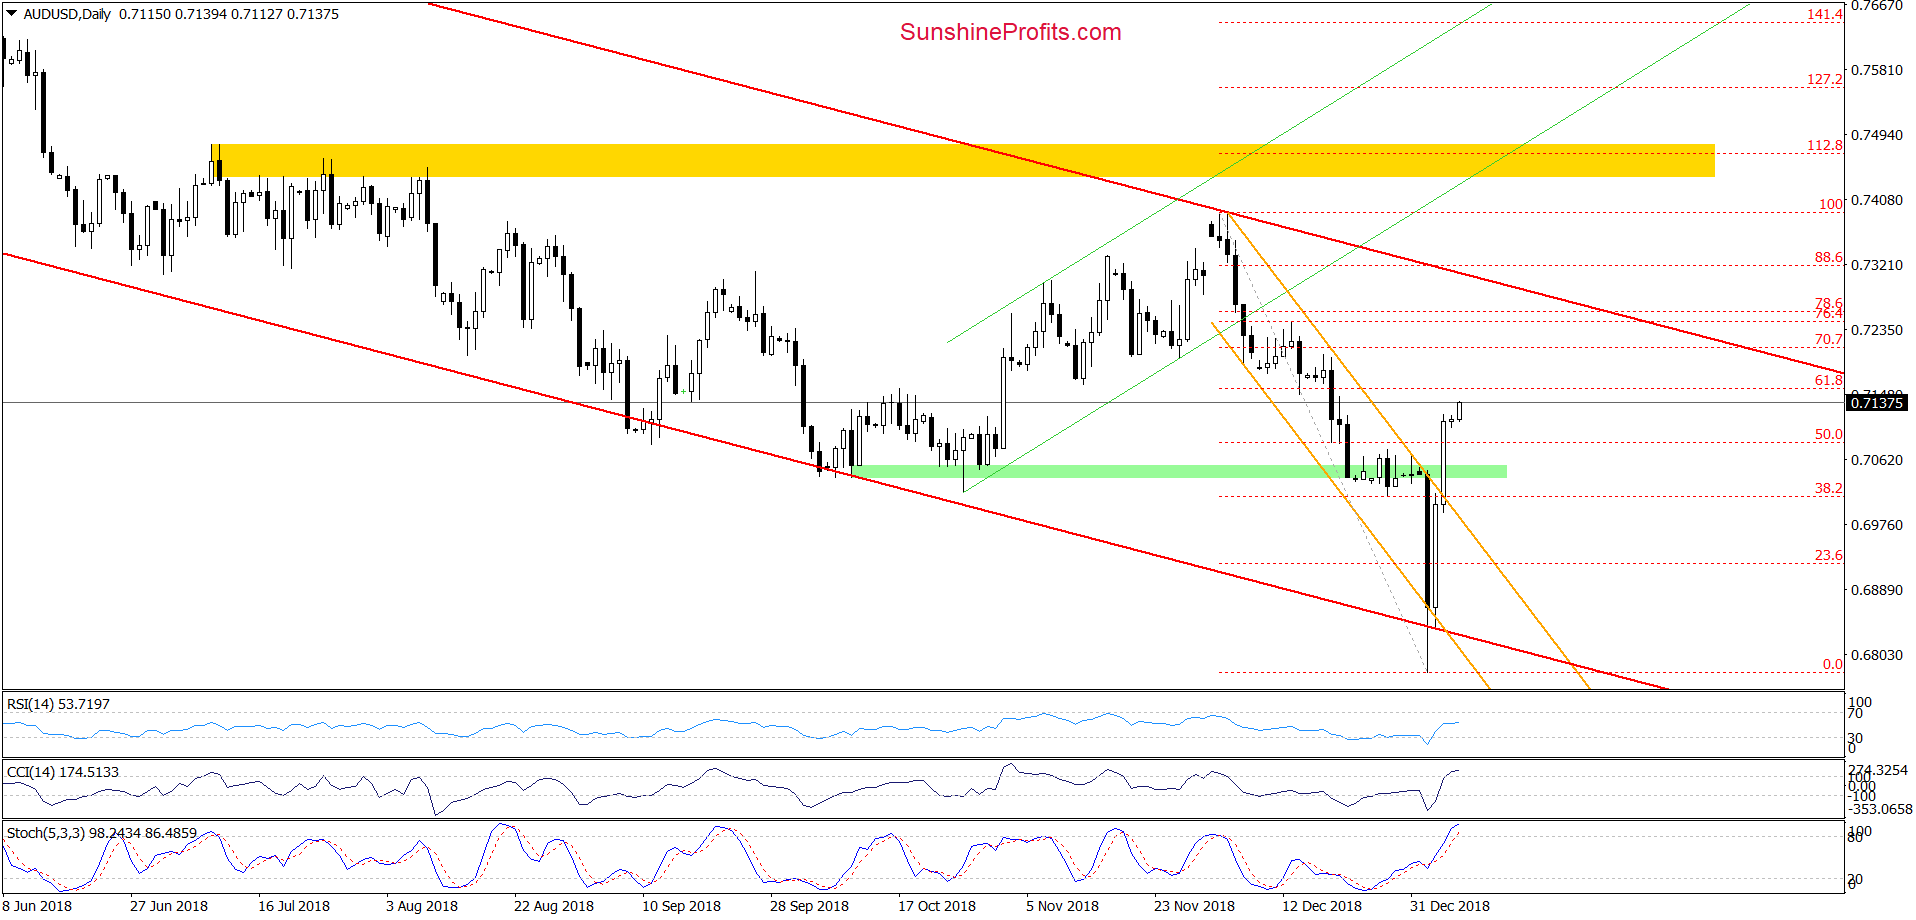
Looking at the daily chart, we see that the bulls not only tested, but also managed to break above the green zone in the previous week. This positive even triggered further improvement and AUD/USD closed Friday’s session above the 50% Fibonacci retracement.
Earlier today, we saw one more attempt to move higher, which in combination of the lack of the sell signals suggests that the pair will likely test the 61.8% retracement in the very near future. Nevertheless, taking into account the current position of the daily indicators, we think that the space for increases is limited and reversal in the coming days should not surprise us.
Is the bulls show weakness and the indicators generate the sell signals, we’ll consider going short. We will keep you informed should anything change, or should we see a confirmation/invalidation of the above.
Trading position (short-term; our opinion): No positions are justified from the risk/reward perspective.
Thank you.
Nadia Simmons
Forex & Oil Trading Strategist
Przemyslaw Radomski, CFA
Founder, Editor-in-chief, Gold & Silver Fund Manager
Gold & Silver Trading Alerts
Forex Trading Alerts
Oil Investment Updates
Oil Trading Alerts

