

The beginning of the week turned out to be not good to the buyers. Despite the successes of last week, they failed to break above the major resistance line, which triggered a quite sharp decline during yesterday's session. Will we see USD/JPY below THIS important support in the very near future?
- EUR/USD: none
- GBP/USD: none
- USD/JPY: short (a stop-loss order at 114.68; the exit target at 112.04)
- USD/CAD:none
- USD/CHF: short (a stop loss order at 1.0192; the exit target at 0.9850)
- AUD/USD:none
EUR/USD
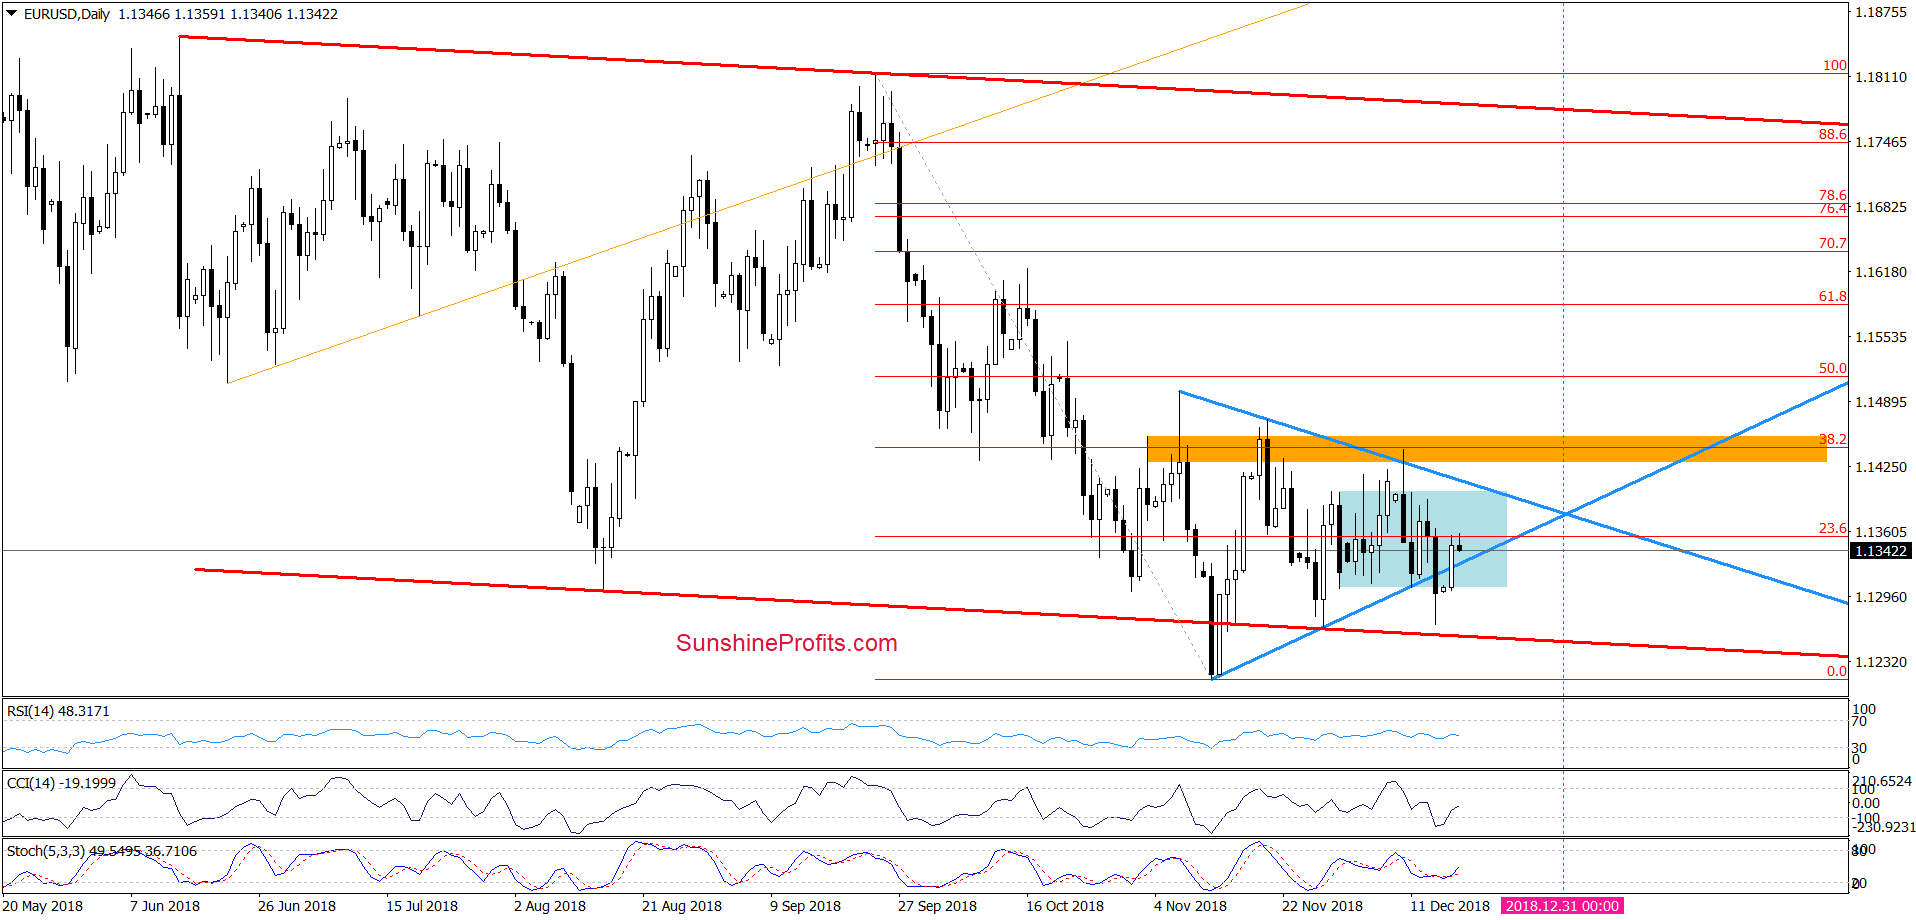
The first thing that catches the eye on the daily chart is an invalidation of the earlier breakdown under the lower border of the blue consolidation and the lower line of the blue triangle, which is a bullish development that suggests further improvement – especially when we factor in the buy signals generated by the CCI and the Stochastic Oscillator.
Nevertheless, before we see such price action, a pullback from here and a test of the strength of the lower border of the blue triangle (or even yesterday’s low and the lower line of the blue consolidation) can’t be ruled out.
How high can the pair climb if currency bulls manage to hold gained levels? We believe that the best answer to this question will be the quote from our yesterday’s alert:
(…) In our opinion, if we see a daily closure inside the triangle and the consolidation, the buyers will likely extend gains and test the upper borders of both formation in the very near future (currently at around 1.4002-1.1412).
Nevertheless, we continue to think that a long as there is no successful breakout above the triangle a sizable move to the upside is questionable.
Before we start to analyze another currency pair, please remember what we wrote yesterday about the wider perspective of the exchange rate:
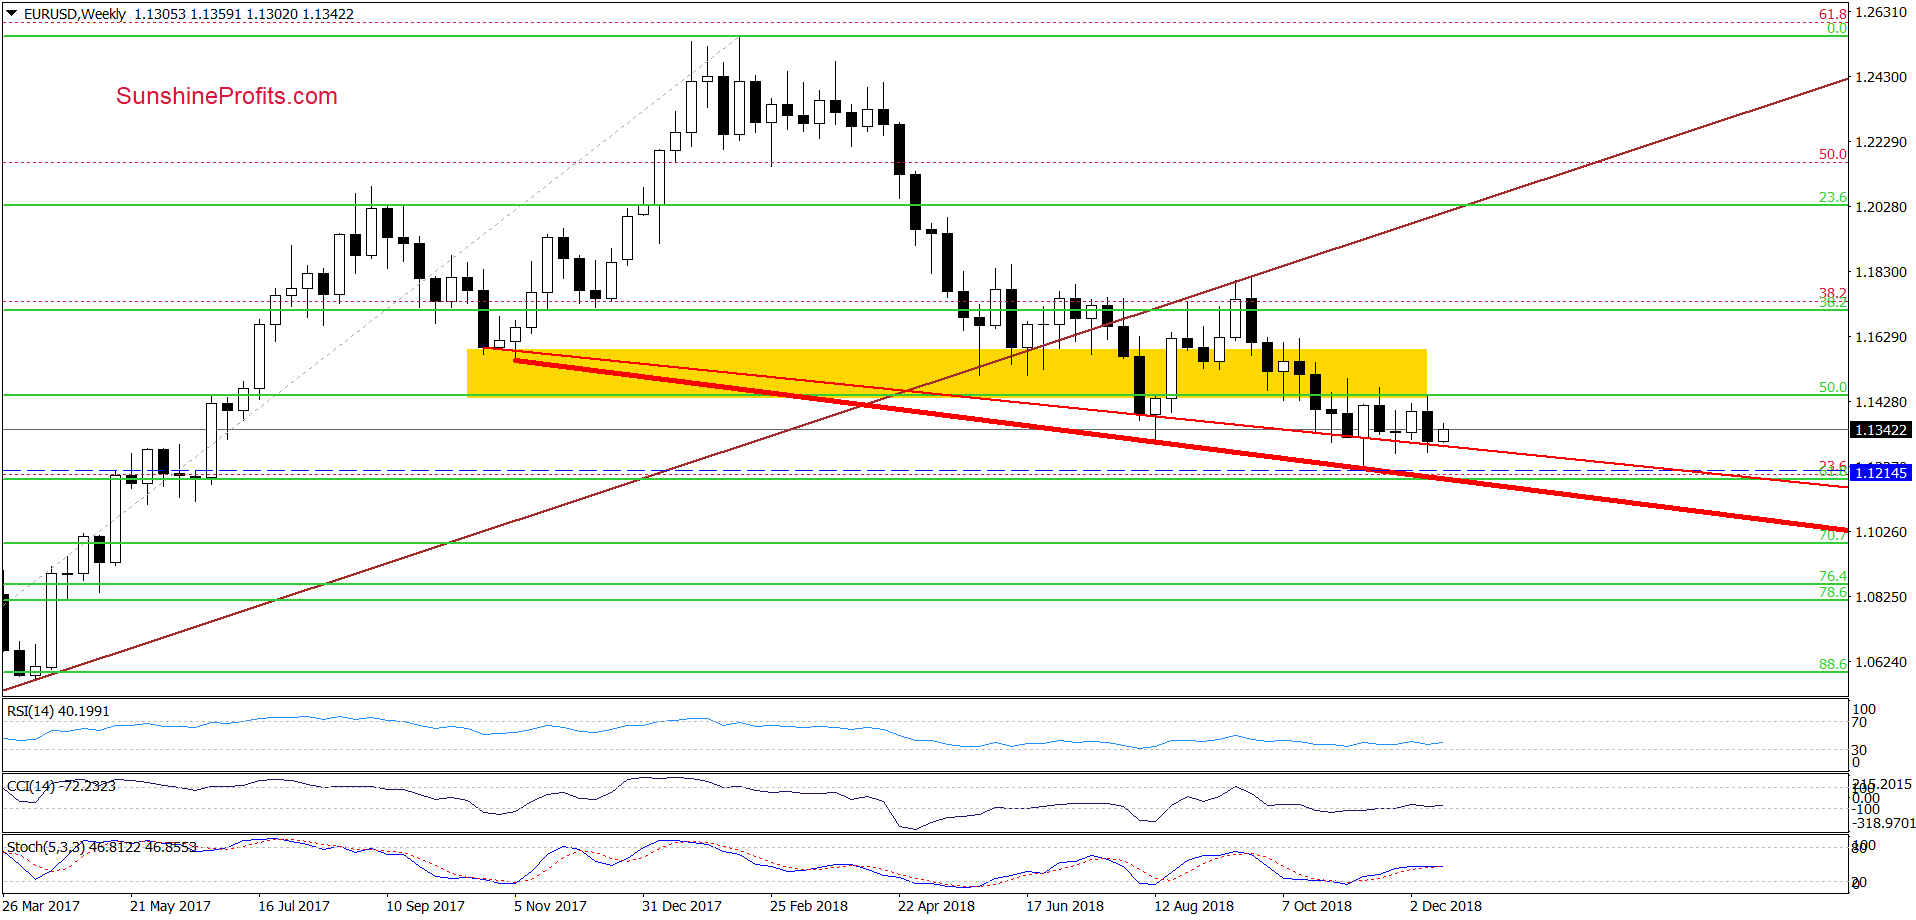
(…) although EUR/USD declined in the previous week, the long-term orange support line (based on the October 2017 and August 2018 lows (in terms of weekly closures) stopped the sellers once again.
As you see on the chart, similar price action, we could observe several times in the previous months, which suggests that as long as there is no weekly closure under this support another rebound from this area is very likely.
Trading position (short-term; our opinion): No positions are justified from the risk/reward perspective. We will keep you informed should anything change, or should we see a confirmation/invalidation of the above.
USD/JPY
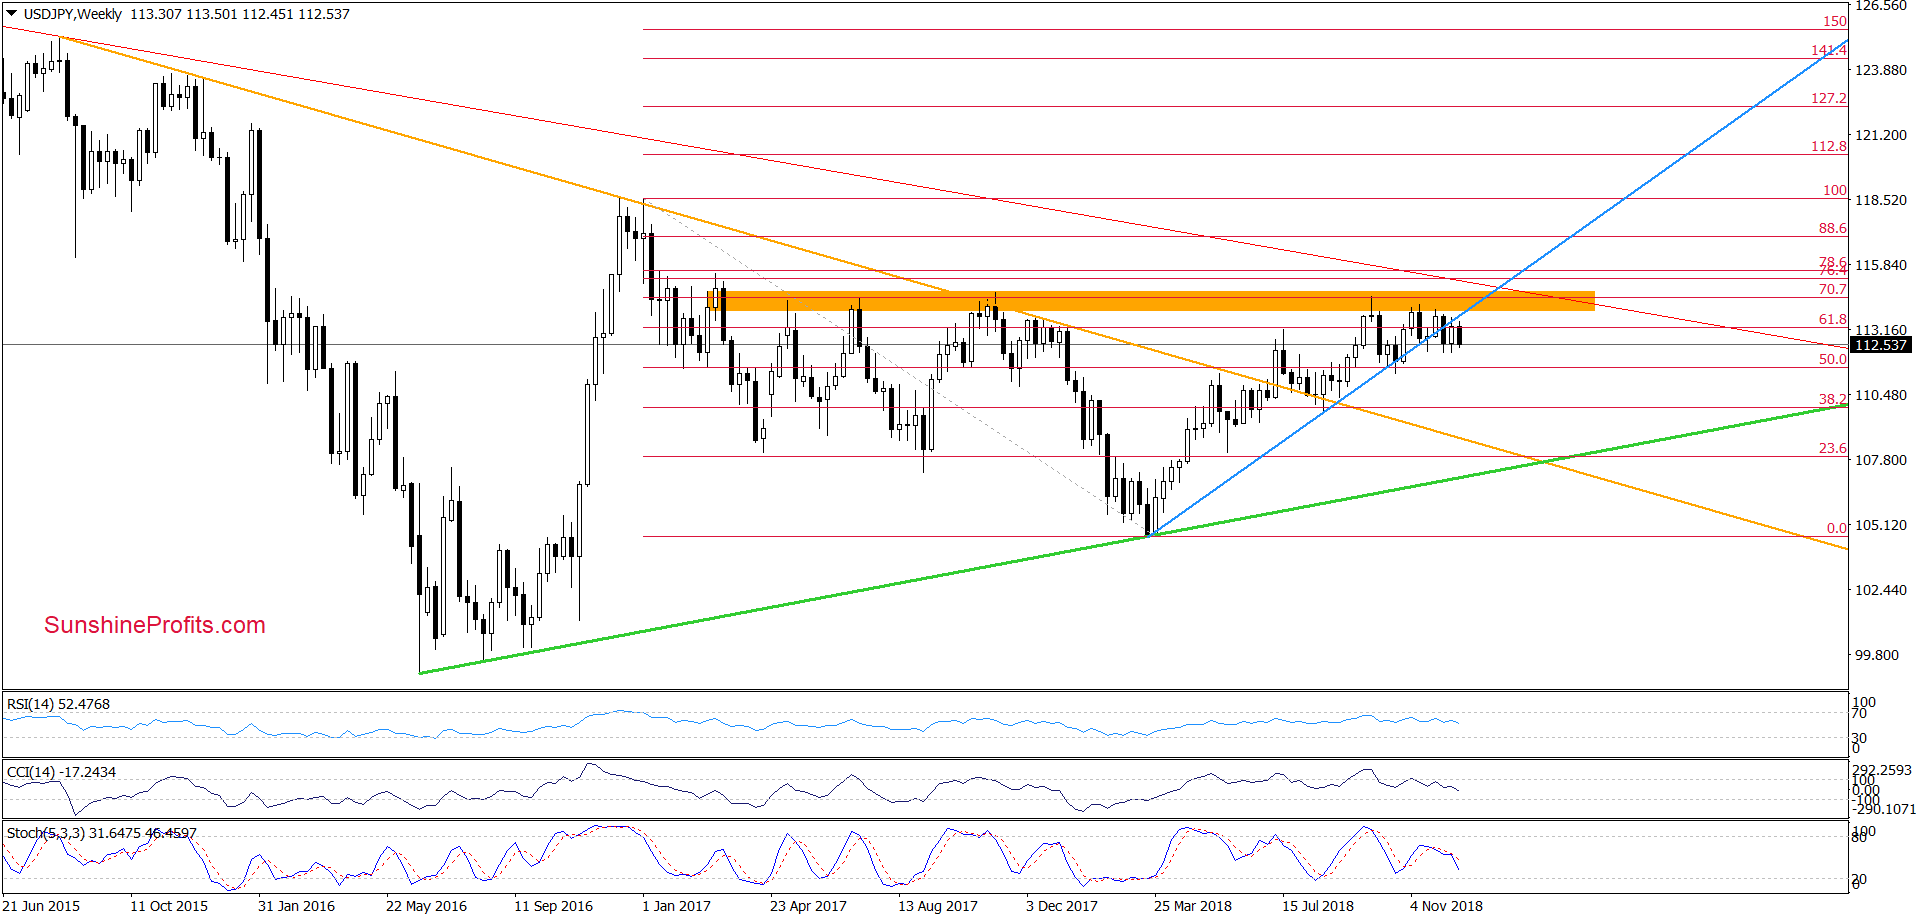
In our last commentary on this currency pair, we wrote:
(…) although USD/JPY moved a bit higher earlier this week, the overall situation in the broader perspective hasn’t changed much as the exchange rate is still trading under the previously-broken long-term blue line.
Taking this fact into account, we continue to believe that this week’s price action is nothing more than a verification of the earlier breakdown and suggests that reversal and lower values of the exchange rate might be just around the corner.
Looking at the weekly chart, we see that the situation developed in tune with our assumptions and the exchange rate reversed and pulled back earlier this week.
How did this drop affect the short-term picture?
Before we answer to this question, let’s recall the quote from our Forex Trading Alert posted on Friday:
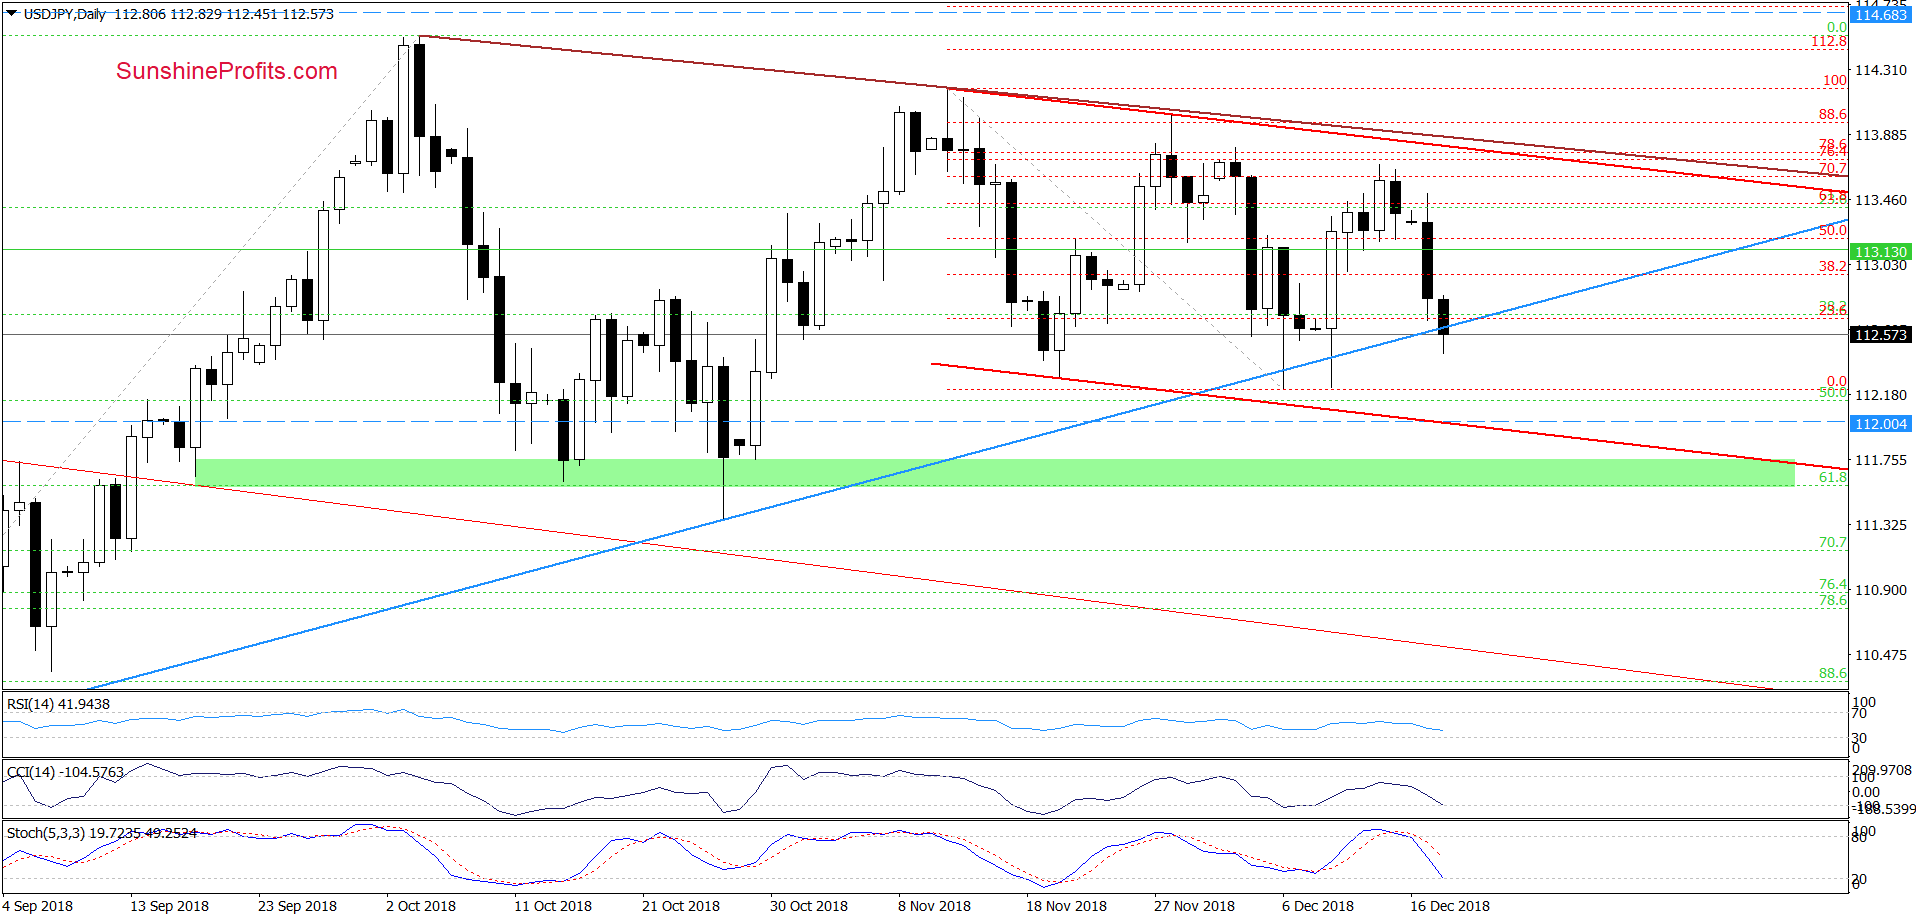
(…) the pair is trading not only below the 76.4% and 78.6% Fibonacci retracements, but also below the brown declining resistance line (based on the October and mid-November highs) and the upper border of the red declining tend channel.
Additionally, the current position of the daily indicators suggests that the space for gains is limited and reversal is just a matter of time (a very short time).
How low could the pair go if currency bears show their claws?
In our opinion, the first downside target will be around 112.54, where the blue support line (marked on the daily chart) currently is.
On the daily chart, we see that the combination of the above-mentioned factors lured the sellers to the trading floor, which resulted in quite a strong decline during yesterday's session. In addition, the indicators (the CCI and the Stochastic Oscillator) generated sale signals encouraging currency bears to continue pro-downward activities.
Thanks to these circumstances, USD/JPY extended losses earlier today and slipped under the blue support line once again. At this point it is worth noting that we saw a similar price action two times earlier this month, but none of them ended with a daily closure below this important support line.
Nevertheless, taking into account the current position of the indicators, we think that this time the sellers will go lower and test the lower border of the red declining trend channel (at around 112) in the very near future.
Trading position (short-term; our opinion): profitable short positions with a stop-loss order at 114.68 and the exit target at 112.04 (we decided to move it a bit lower) are justified from the risk/reward perspective.
USD/CHF
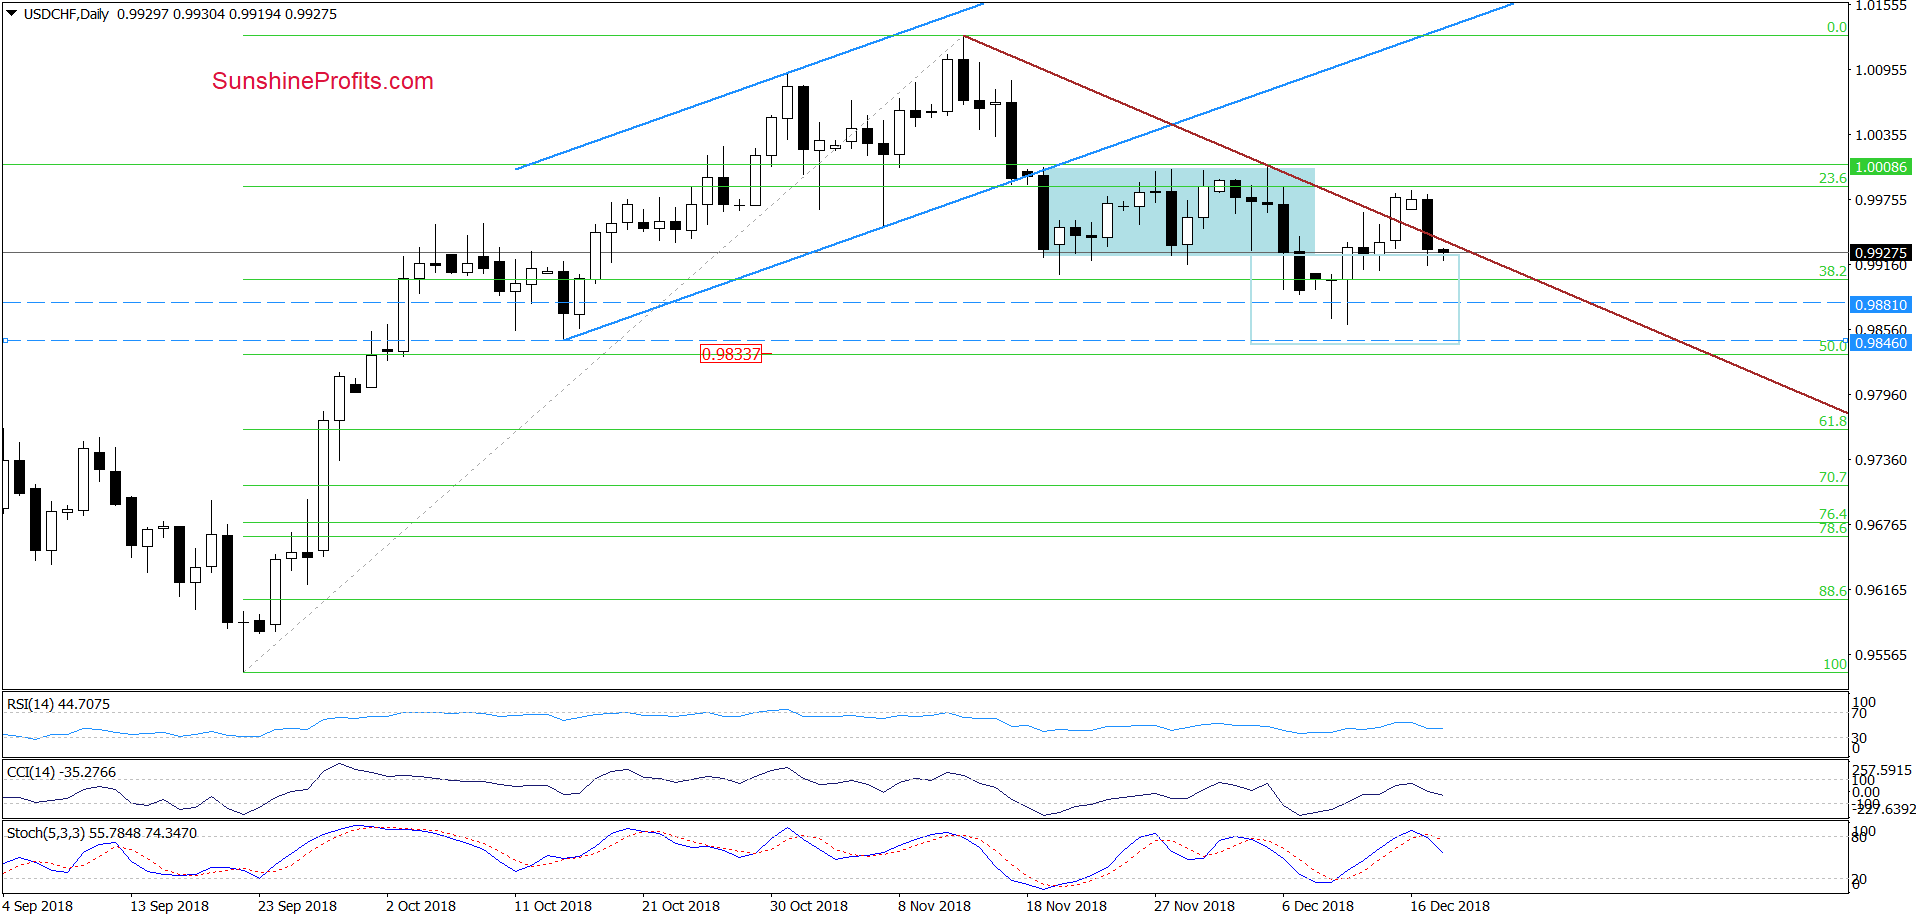
From today’s point of view, we see that although currency bulls took USD/CHF above the short-term brown declining resistance line based on the previous highs, this improvement did not last long.
As you see, the proximity to the recent peaks encouraged currency bears to act, which translated into a pullback during yesterday’s session. Thanks to this drop the pair lipped under the brown line, invalidating the earlier small breakout.
Additionally, the CCI and the Stochastic Oscillator generated sell signals, suggesting that lower values of USD/CHF are just around the corner. If this is the case and the pair declines from current levels, the sellers will likely test not only the recent lows, but also the mid-October lows and the 50% Fibonacci retracement in the following days (around 0.9833-0.9846).
Finishing today’s commentary on this currency pair, it is also worth noting that in this area the size of the downward move will correspond to the height of the blue consolidation, which increases the probability that the sellers will want to make profits in this area.
Trading position (short-term; our opinion): profitable short positions with a stop loss order at 1.0192 and the exit target at 0.9850 are justified from the risk/reward perspective.
Thank you.
Nadia Simmons
Forex & Oil Trading Strategist
Przemyslaw Radomski, CFA
Founder, Editor-in-chief, Gold & Silver Fund Manager
Gold & Silver Trading Alerts
Forex Trading Alerts
Oil Investment Updates
Oil Trading Alerts

