

Whatever one wants to say about the recent movement in the Japanese yen, they cannot say that it was boring. The yen moved fast and far and paused only after reaching its long-term price extreme. Is the yen move over or is a brief pause all that one should expect from this currency? What about the euro? Will it soar or plunge in the coming days? You will find more details in today's Forex Trading Alert.
- EUR/USD: none
- GBP/USD: short (a stop-loss order at 1.2869; the initial downside target at 1.2490)
- USD/JPY: none
- USD/CAD:none
- USD/CHF:none
- AUD/USD:none
EUR/USD
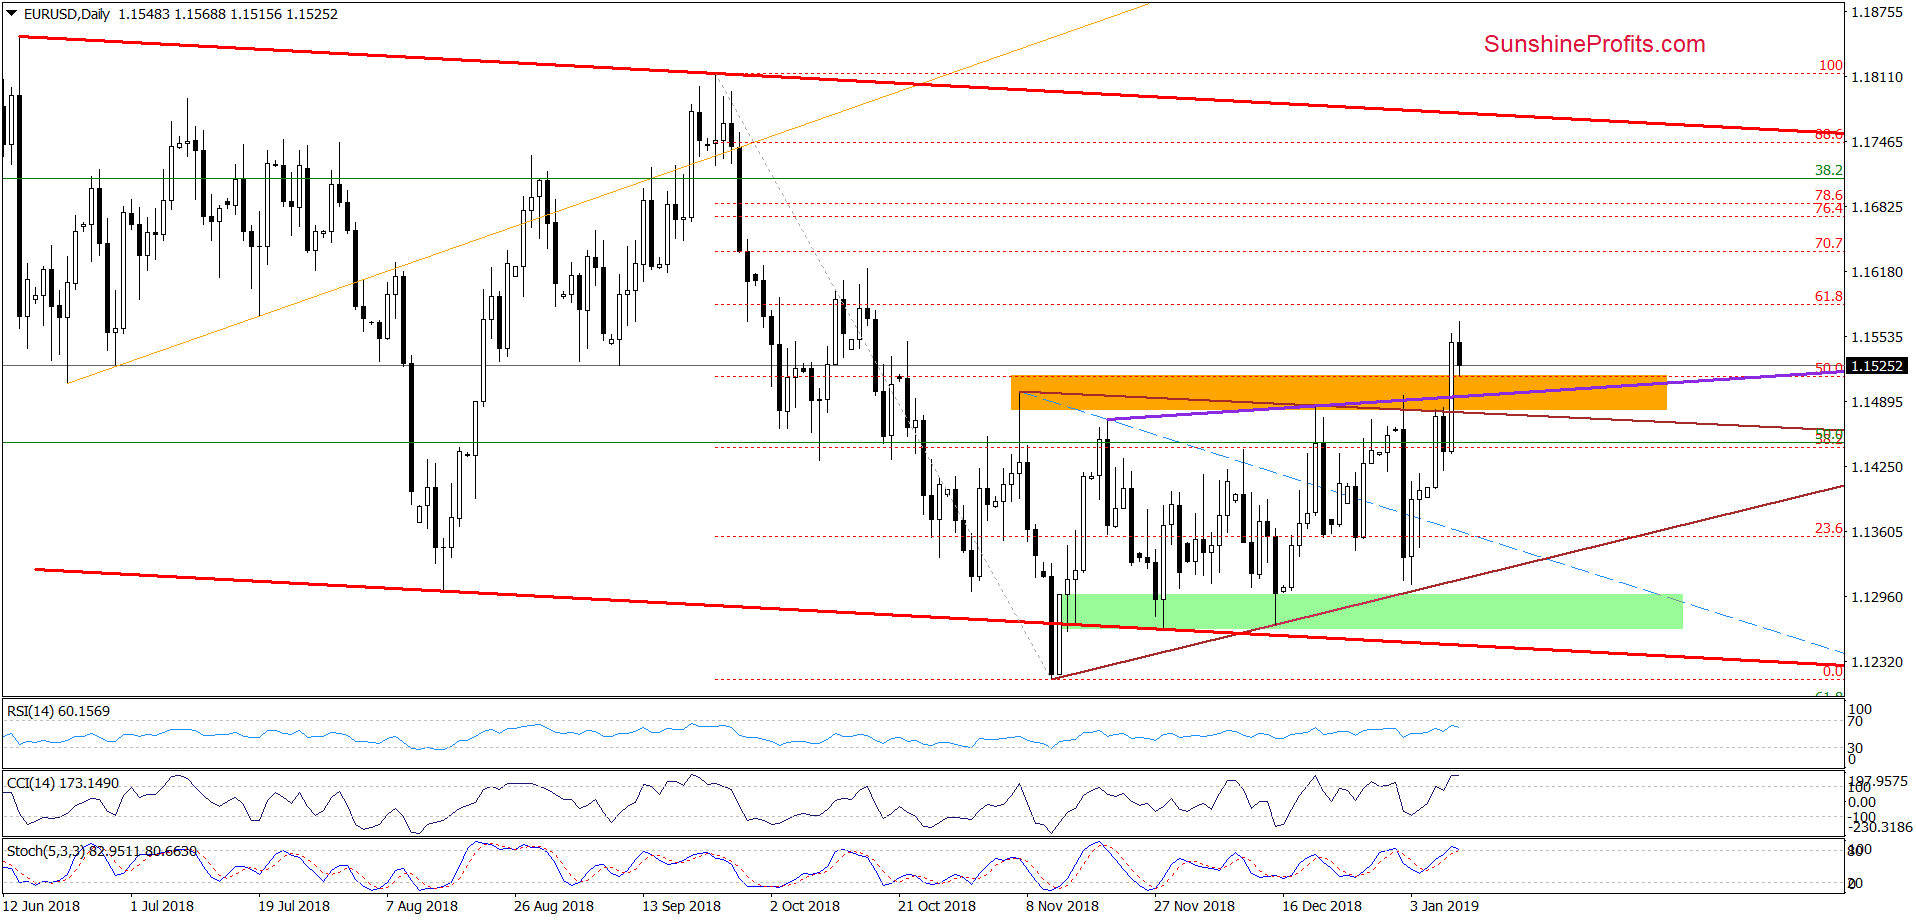
The highlight of yesterday’s session was a breakout above the upper border of the brown triangle, which triggered further improvement and resulted in a climb and a daily closure above the orange resistance zone and the 50% Fibonacci retracement.
Earlier today, the exchange rate pulled back and slipped to the previously-broken resistances, which looks like a verification of yesterday’s breakout and suggests that one more upswing could be just around the corner. However, at this point, it is worth noting that the CCI and the Stochastic Oscillator increased to their overbought areas (additionally the latter is very close to generating a sell signal), indicating that the space for gains may be limited.
Nevertheless, as long as there is no daily closure under the above-mentioned levels, a rebound from here and a test of the 61.8% Fibonacci retracement and the mid-October peaks can’t be ruled out.
Trading position (short-term; our opinion): No positions are justified from the risk/reward perspective.
GBP/USD
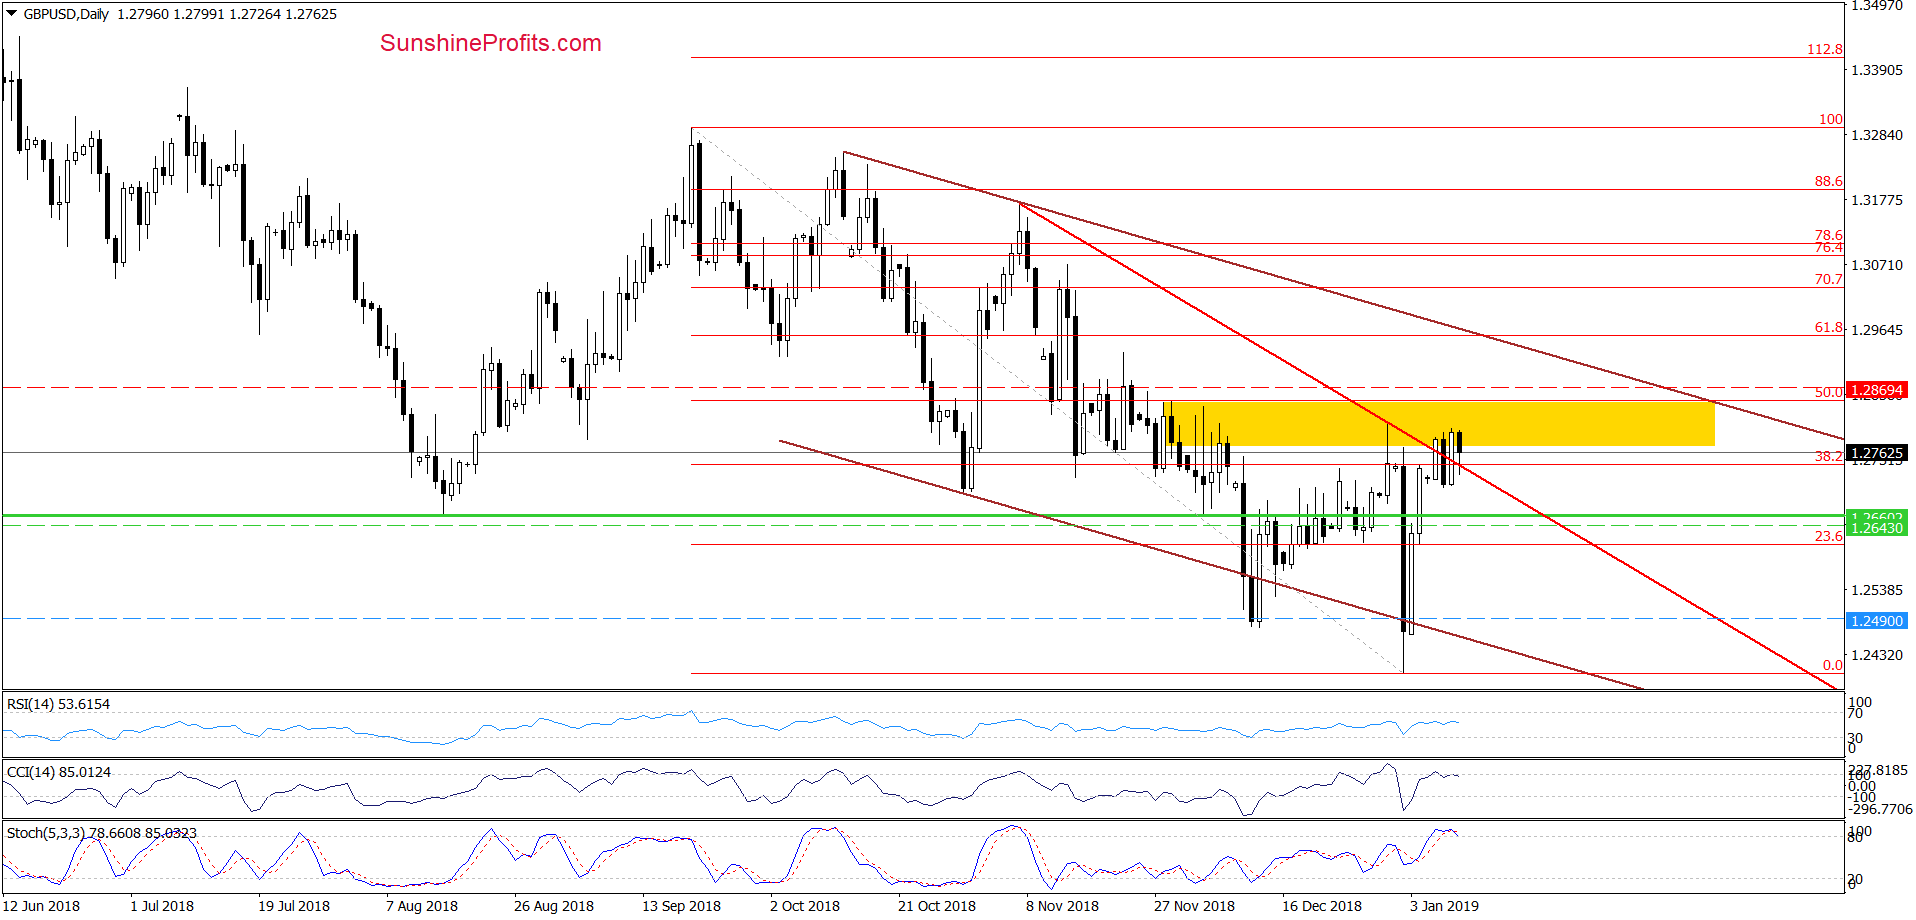
From today’s point of view, we see that GBP/USD came back above the red declining resistance line during yesterday’s session, but despite this improvement the pair is still trading in a narrow rage under the yellow resistance zone.
Additionally, the CCI and the Stochastic Oscillator generated sell signals, increasing the likelihood of another downward move in the very near future. If this is the case and GBP/USD declines from here, invalidating yesterday’s breakout above the red line, we’ll likely see a test of the recent lows or even the lower border of the brown declining trend channel in the coming days.
Trading position (short-term; our opinion): Short positions with a stop-loss order at 1.2869 and the initial downside target at 1.2490 are justified from the risk/reward perspective. We will keep you informed should anything change, or should we see a confirmation/invalidation of the above.
USD/JPY
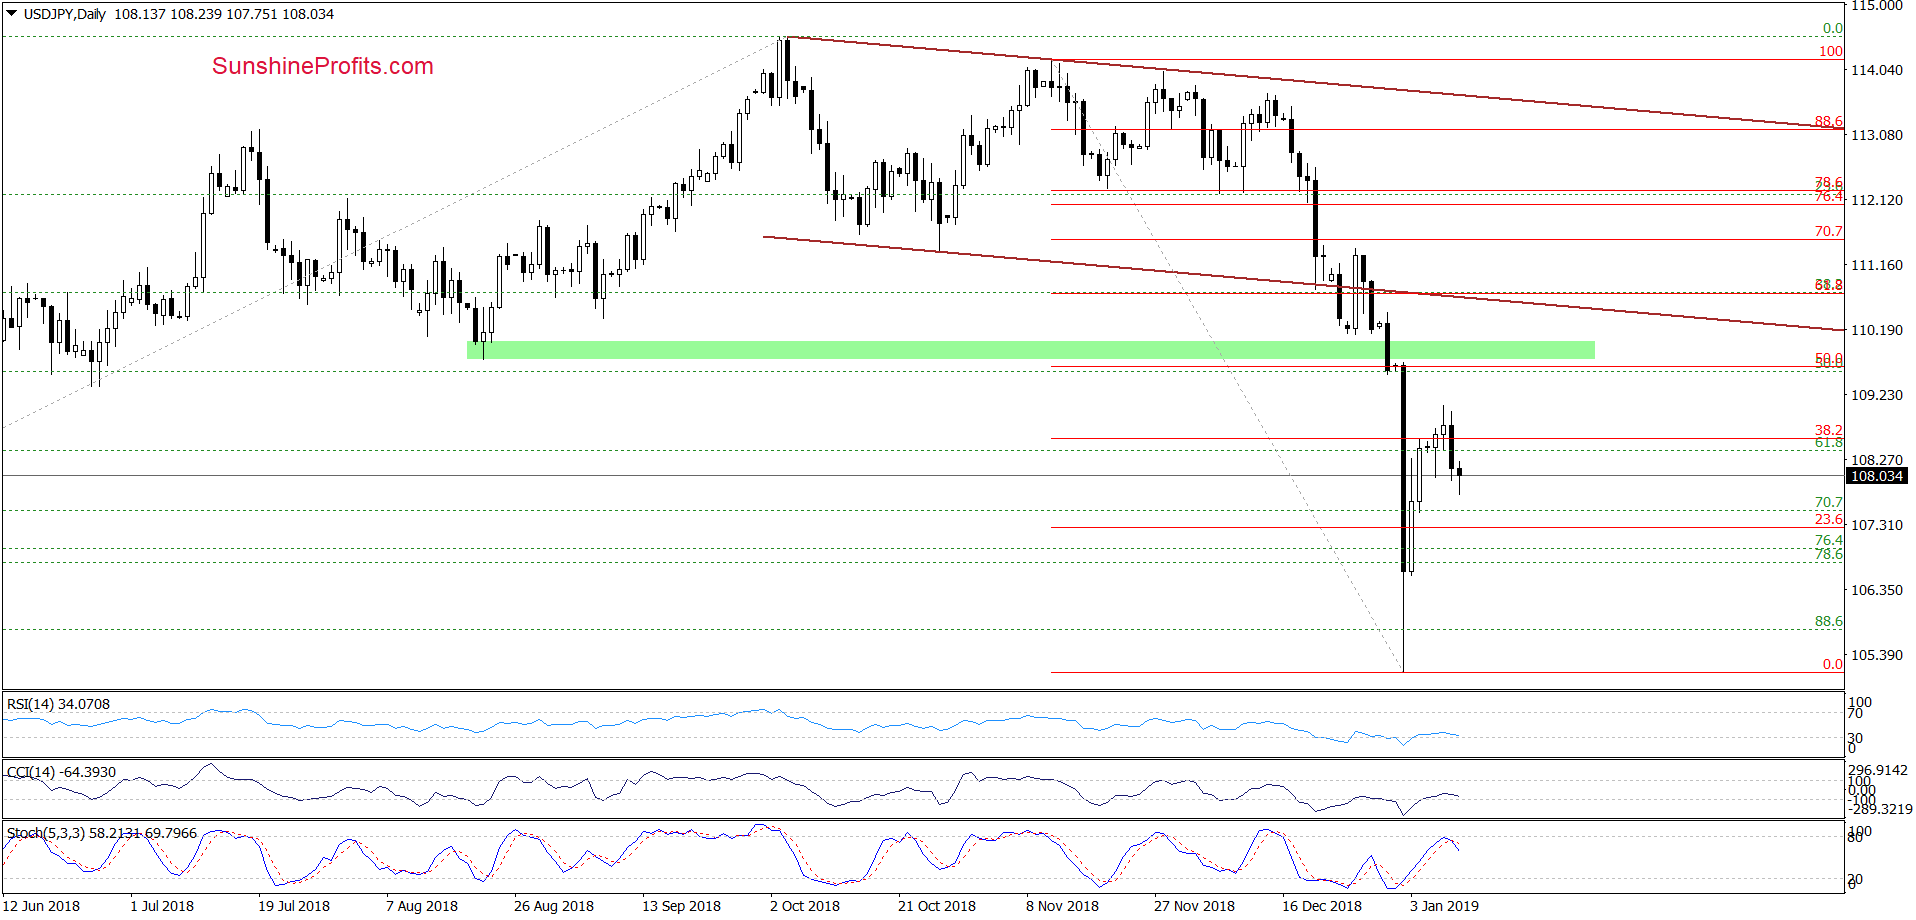
Looking at the daily chart, we see that although USD/JPY climbed slightly above the 38.2% Fibonacci retracement (based on the recent sharp decline) this improvement was very temporary and the exchange rate moved lower on Wednesday.
Thanks to yesterday’s downswing the pair invalidated the mentioned breakout above the retracement, which triggered further deterioration earlier today. Additionally, the Stochastic Oscillator generated a sell signal, giving the seller another reason to act.
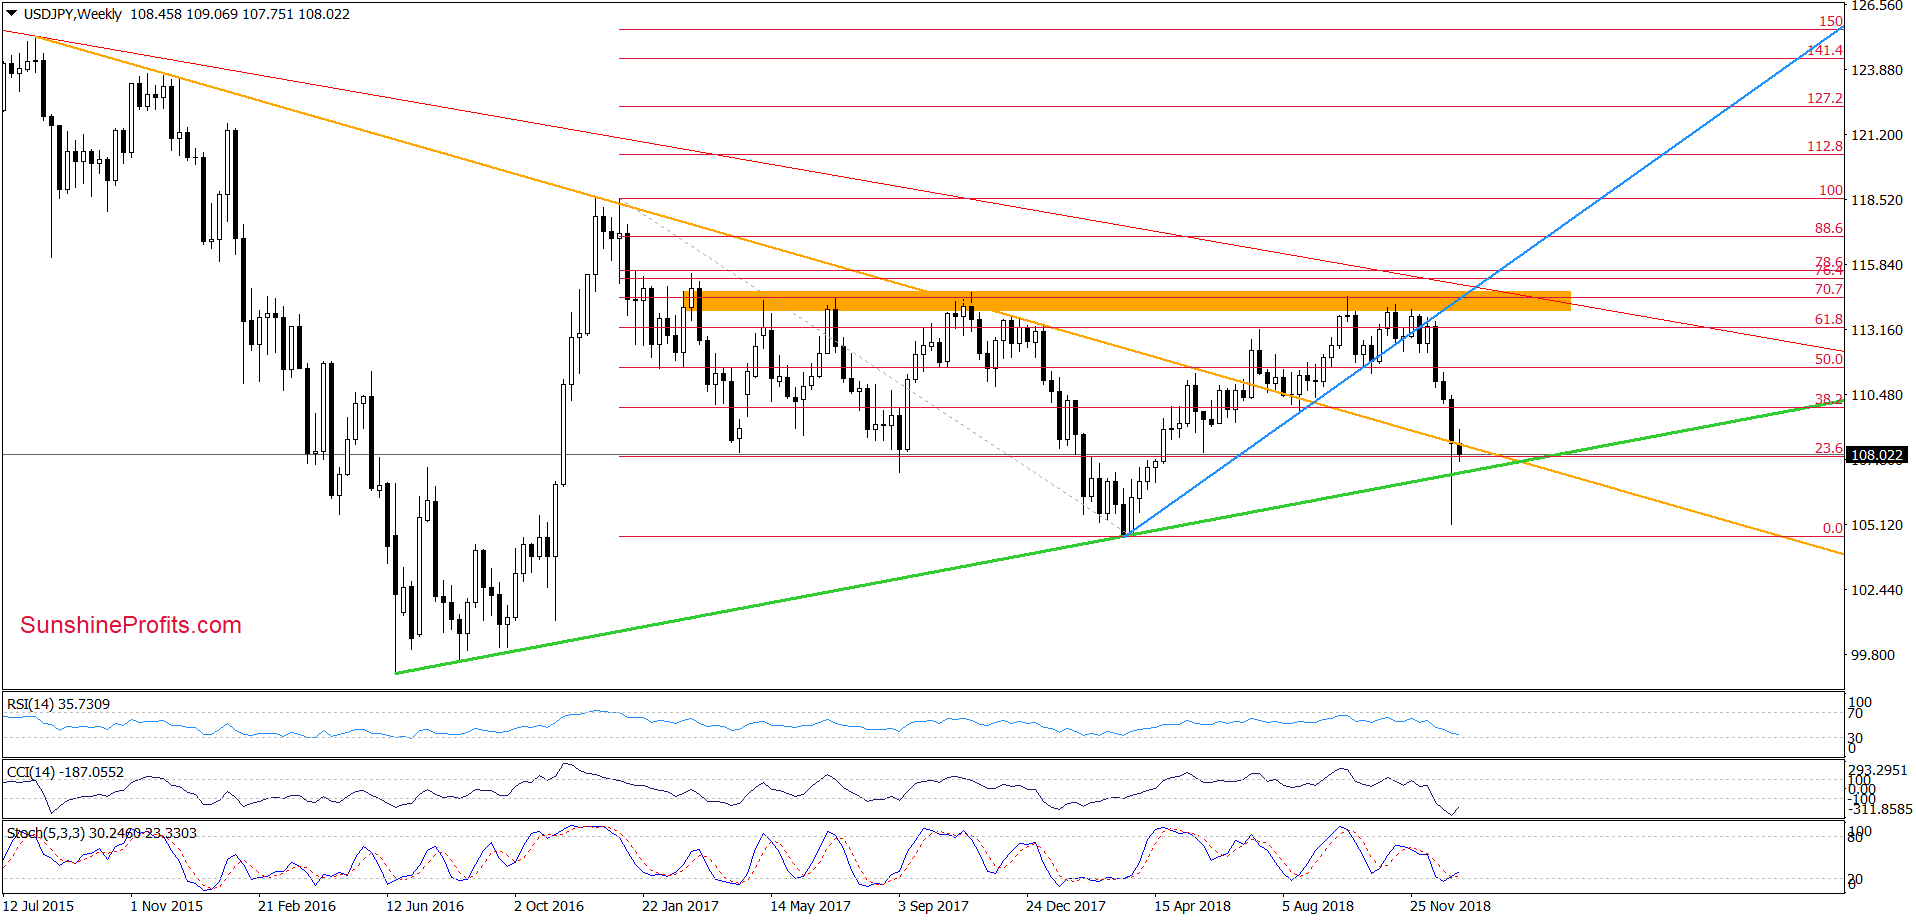
If this is the case and the pair extends losses from current levels, we’ll likely see a drop to (at least) 107.26, where the previously-broken long-term green support line (marked on the weekly chart below) currently is.
Trading position (short-term; our opinion): No positions are justified from the risk/reward perspective. We will keep you informed should anything change, or should we see a confirmation/invalidation of the above.
Thank you.
Nadia Simmons
Forex & Oil Trading Strategist
Przemyslaw Radomski, CFA
Founder, Editor-in-chief, Gold & Silver Fund Manager
Gold & Silver Trading Alerts
Forex Trading Alerts
Oil Investment Updates
Oil Trading Alerts

