

In the previous week, currency bulls showed their strength and pushed the U.S. dollar to a fresh 2018 peak against its Canadian counterpart. Thanks to that increase, the exchange rate climbed above the upper border of the long-term rising trend channel and several Fibonacci retracements, but will the buyers be strong enough to defeat the nearest resistance area?
EUR/USD
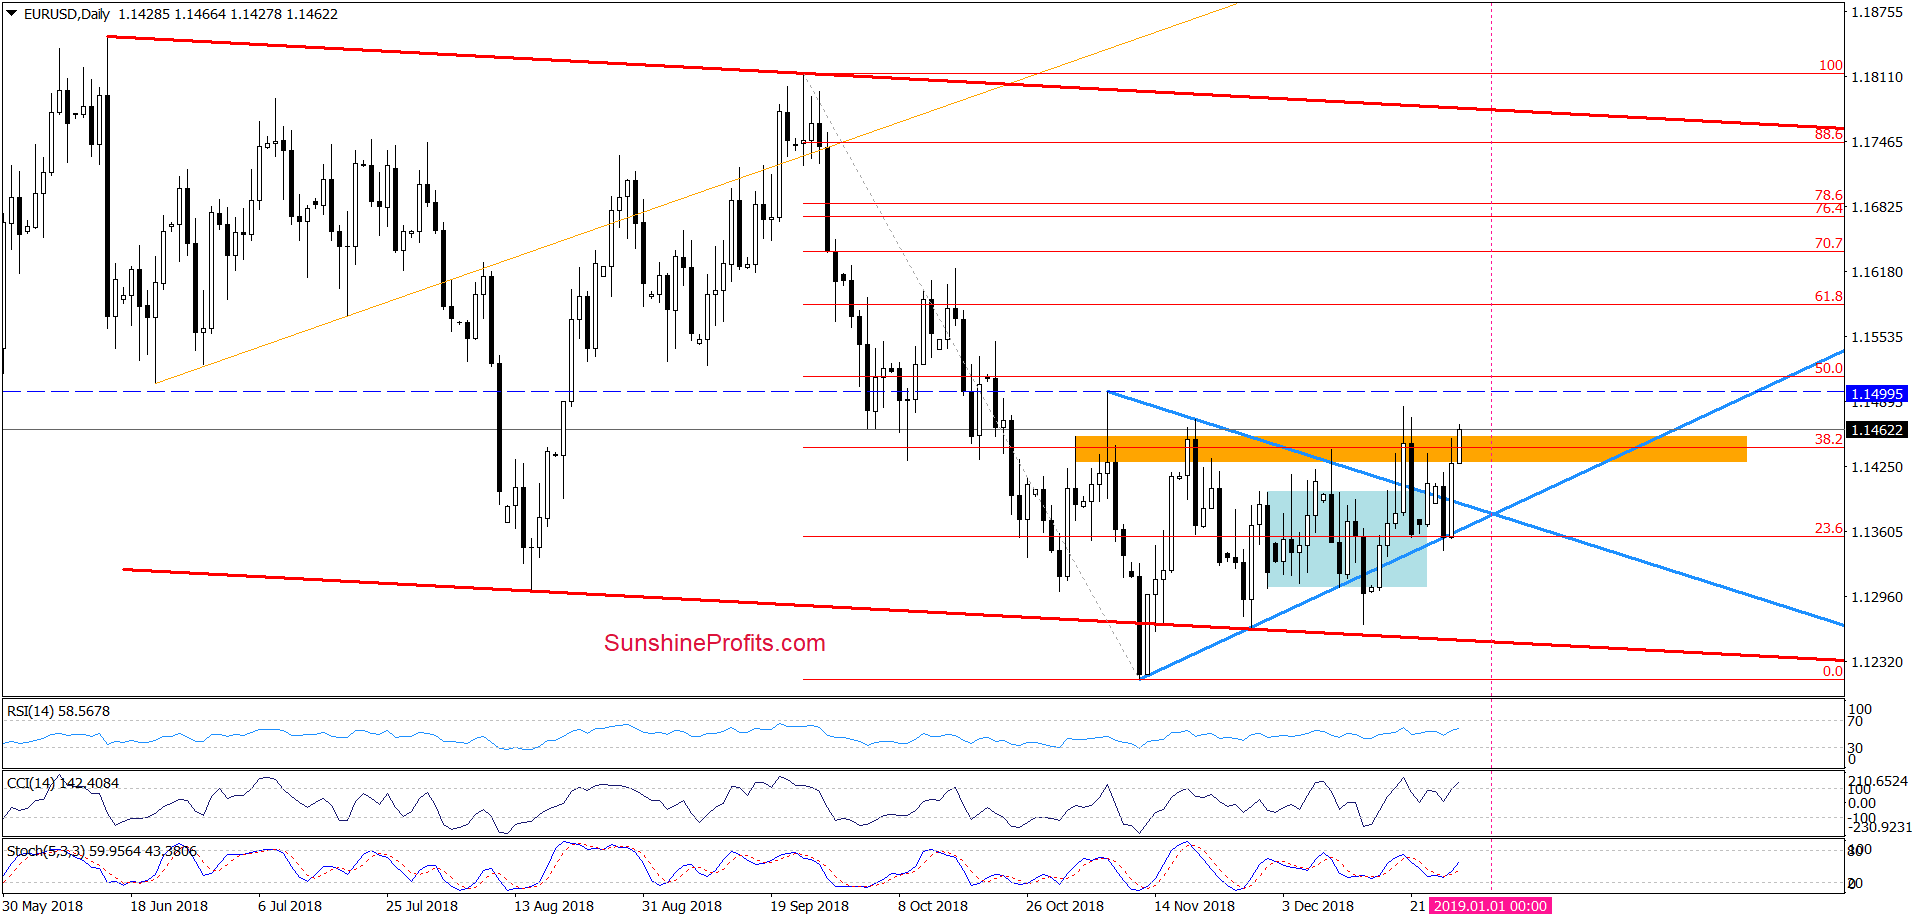
The highlight of yesterday’s session was another breakout above the upper border of the blue triangle and a test of the orange resistance zone. Although EUR/USD pulled back a bit after currency bulls didn’t manage to break above this area, the buyers closed the ranks and pushed the exchange rate higher earlier today.
Thanks to this move, the pair climbed above the orange zone, which in combination with the buy signal generated by the daily indicator suggests that we’ll likely see a test of the December high or even the early-November peak and the 50% Fibonacci retracement in the coming days.
Nevertheless, we think that this pro-growth scenario will be more likely and reliable if the exchange rate closes today’s session above the orange resistance area.
Finishing today’s commentary on this currency pair, please keep in mind what we wrote yesterday about potential reversal:
(…) The intersection of the arms of the triangle will take place at the beginning of the next year, which means that both Monday and Wednesday sessions may indicate the place where the reversal will take place - according to the Triangle Apex Reversal technique.
Depending on where this happens, we will take further investment decisions. In other words, if the bulls push the currency pair above the orange resistance zone and fail to keep the EUR/USD above this resistance once again, we will consider the opening short positions. (…)
Trading position (short-term; our opinion): No positions are justified from the risk/reward perspective. We will keep you informed should anything change, or should we see a confirmation/invalidation of the above.
USD/JPY
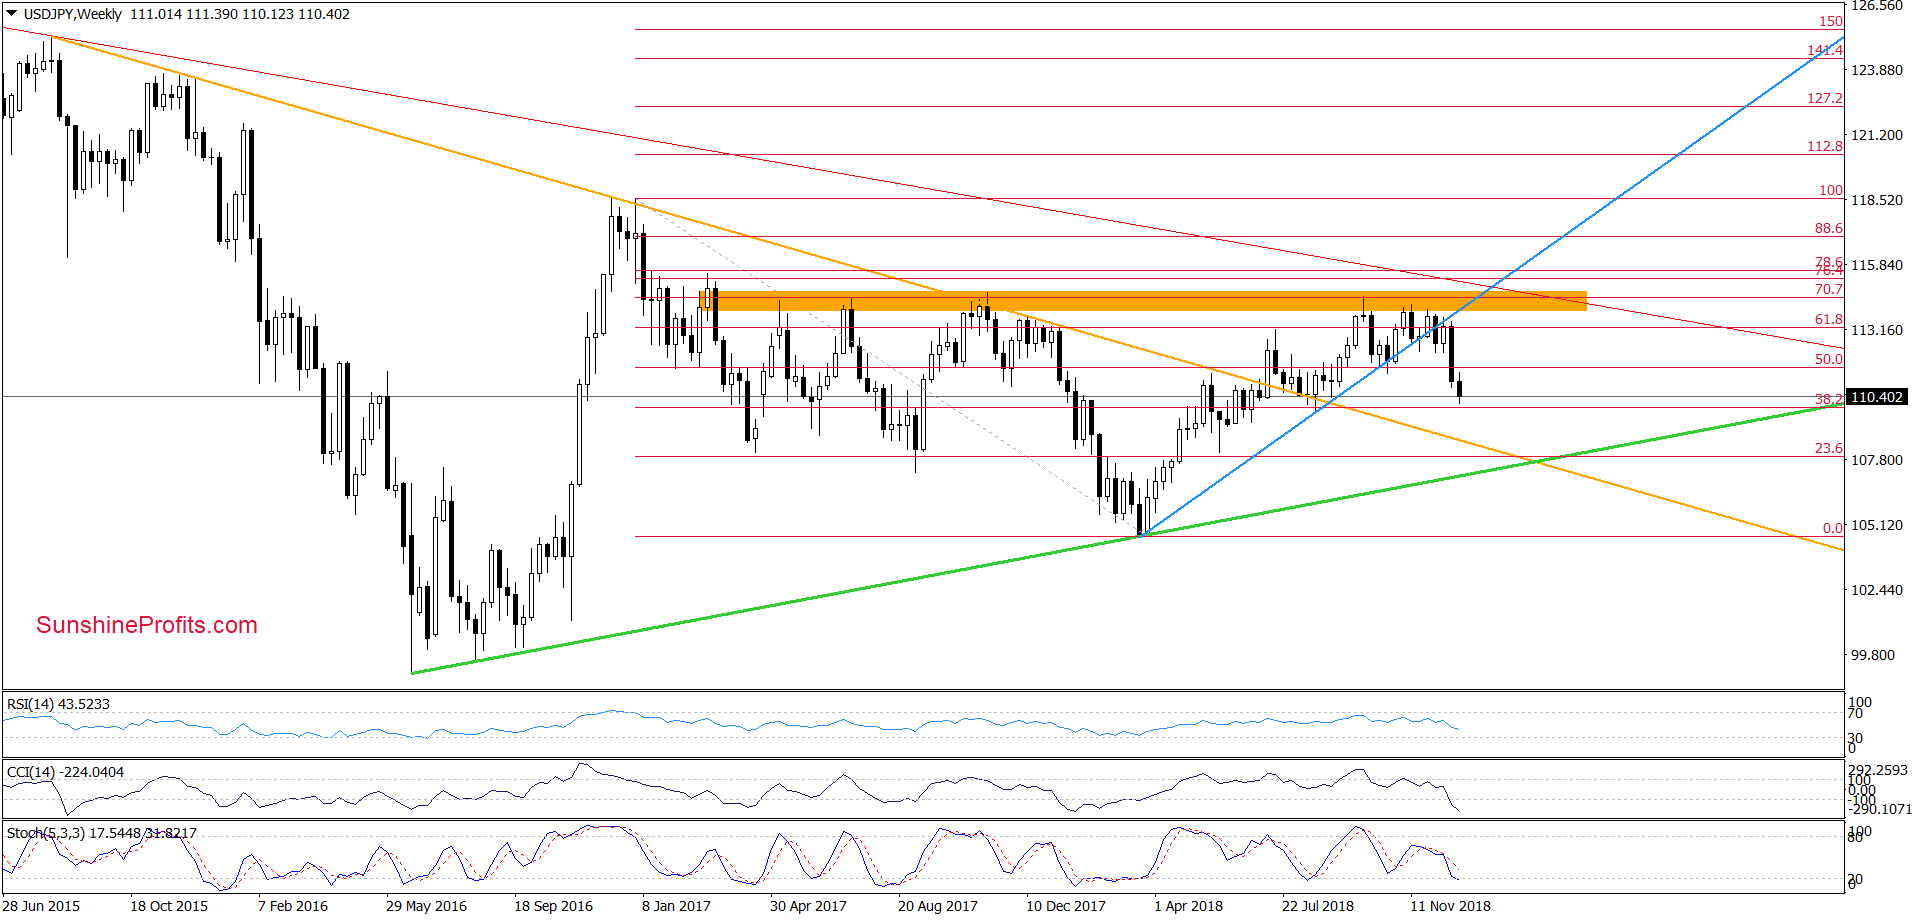
Looking at the weekly chart, we see that the overall situation in the medium term has deteriorated as USD/JPY moved sharply lower in the previous week and extended losses earlier this week.
How low can the exchange rate go in the coming days?
We believe that the best answer to this question will be the quotes from our Forex Trading Alert posted on Monday:
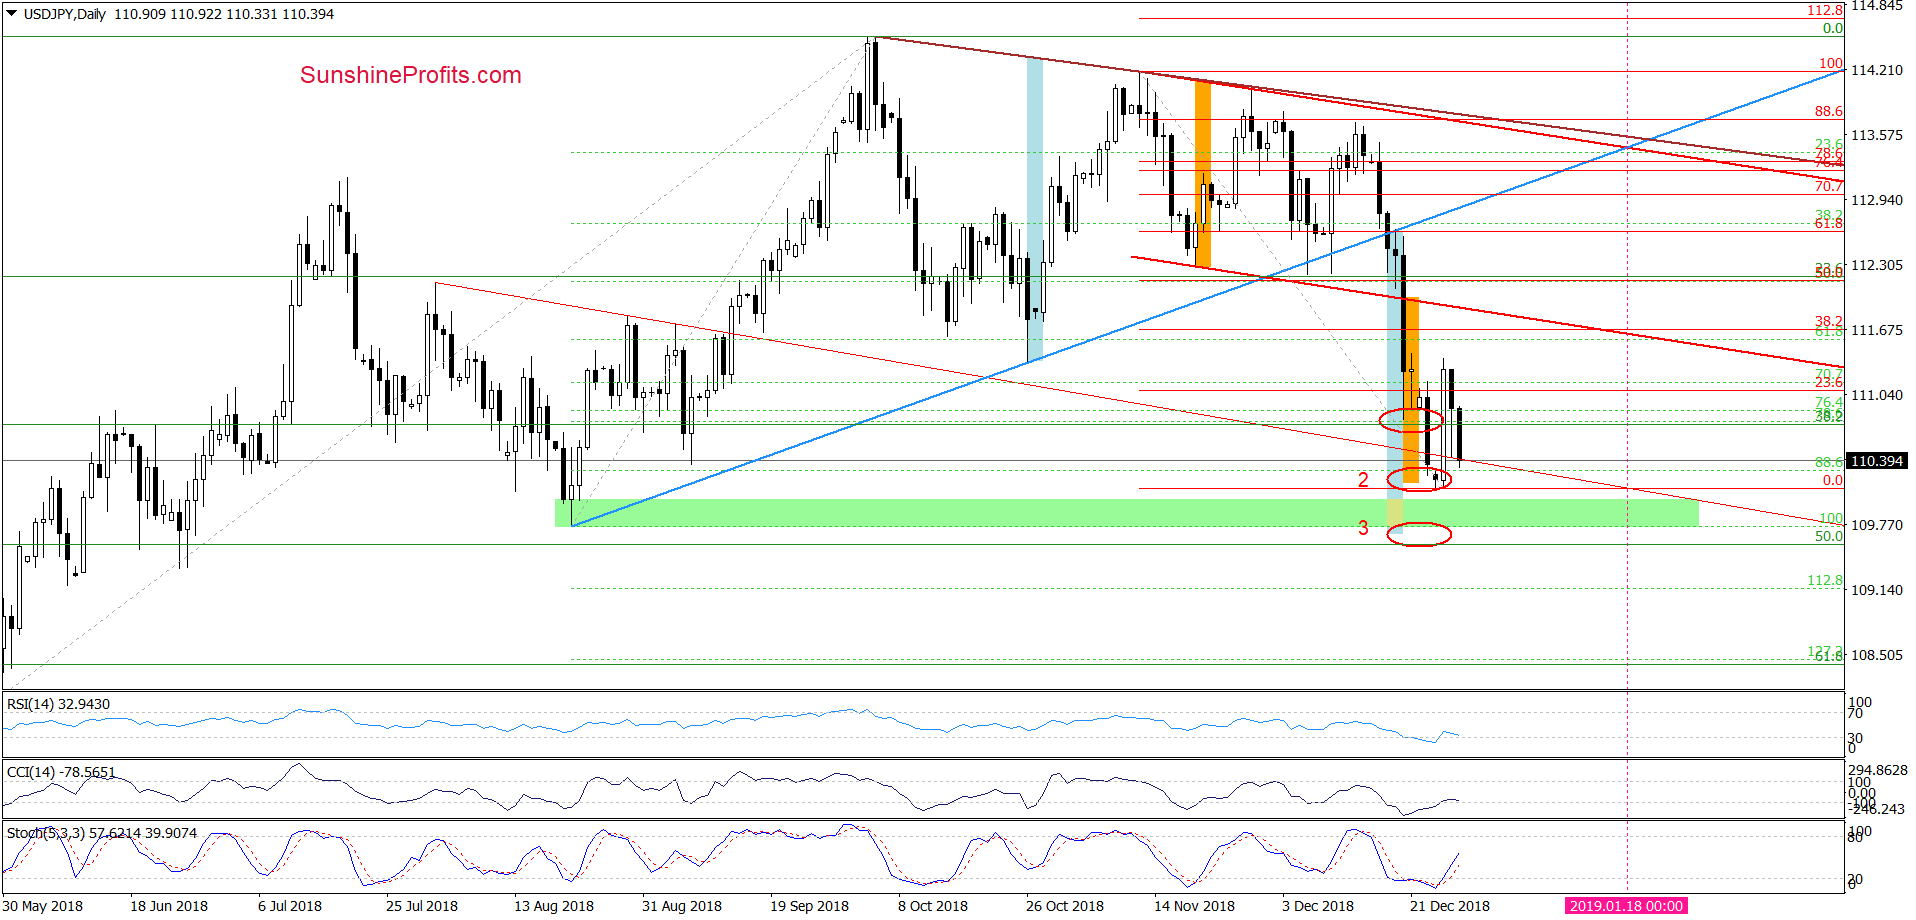
(…) if the bulls fail once again, we can see further declines to our next downside target (we marked this area with the red ellipse with number 2).
(…) we would like to draw your attention to one more downside target - marked with the red ellipse with number 3. Why did we add it on the chart? Because USD/JPY broke below the medium-term blue support line, which is the bottom line of the triangle at the same time (the intersection of both arms of the formation will take place on January 20, (…)).
With this fact in mind, we must also take into account the scenario in which the currency pair can expand the downward move and fall even to the August low. Why? Because in this region the size of the decline will be the same size as the height of the triangle mentioned above. (…)
Trading position (short-term; our opinion): No positions are justified from the risk/reward perspective. We will keep you informed should anything change, or should we see a confirmation/invalidation of the above.
USD/CAD
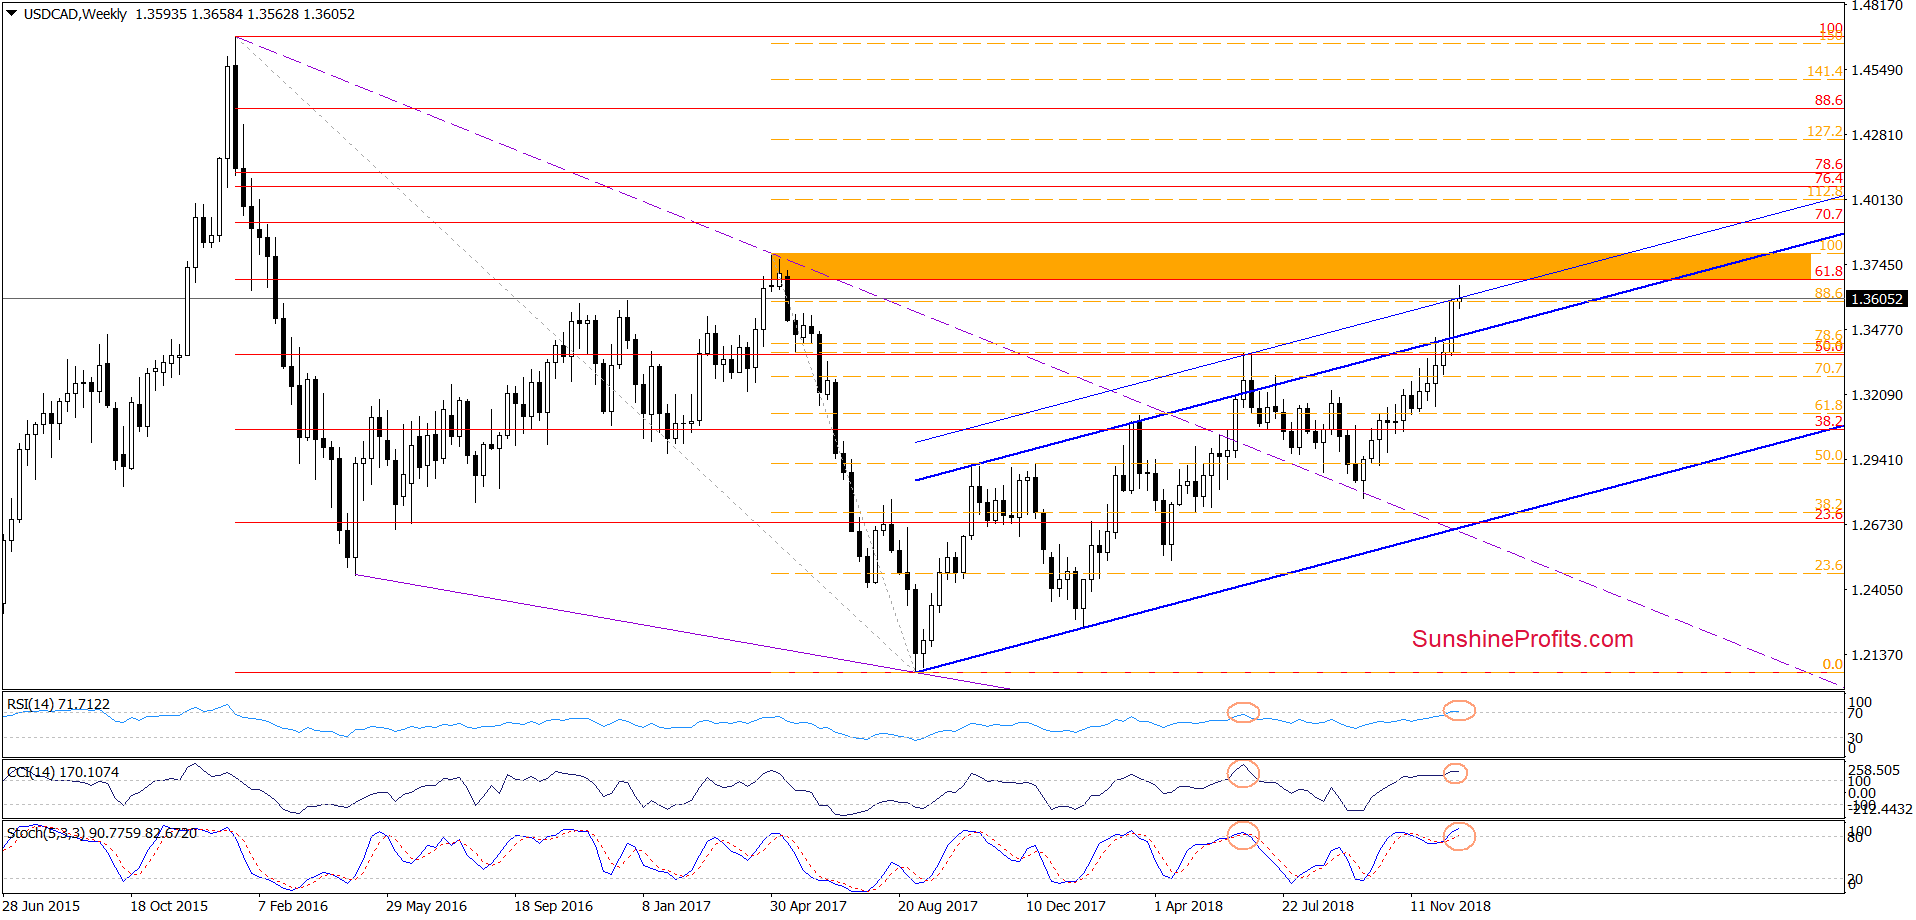
From the medium-term point of view, we see that the situation has improved in the previous week after USD/CAD moved sharply higher and broke above a very important resistance area created by the 50% Fibonacci retracement based on the entire 2016-2017 downward move, the 76.4% and 78.6% Fibonacci retracements based on the late-April 2017- early-September 2017 declines and the upper border of the long-term blue rising trend channel.
This bullish development triggered further increases earlier this week, which resulted in a climb above the 88.6% Fibonacci retracement and the blue resistance line based on the mid-June peak, which is parallel to the upper border of the blue rising trend channel.
What does it mean for the exchange rate? In our opinion, a test of the next resistance area created by the late-April 2017 and May 2017 peaks and reinforced by the 61.8% Fibonacci retracement (based on the entire 2016-2017 downward move).
At this point, it is worth noting that the current position of the weekly indicators suggests that the space for increases may be limited. What do we mean by that? As you see on the chart, the RSI climbed above the level of 70 for the first time since the beginning of 2016. Back then such high reading of the indicator preceded a significant correction, which suggests that we may se a similar price action in the coming week. This scenario is also reinforced by the bearish divergence between the CCI and the exchange rate and an extremally high reading of the Stochastic Oscillator.
Therefore, if the situation develops in tune with our assumptions and USD/CAD fail to break above the orange resistance zone, we’ll consider opening short positions. We will keep you informed should anything change, or should we see a confirmation/invalidation of the above.
Trading position (short-term; our opinion): No positions are justified from the risk/reward perspective.
Thank you.
Nadia Simmons
Forex & Oil Trading Strategist
Przemyslaw Radomski, CFA
Founder, Editor-in-chief, Gold & Silver Fund Manager
Gold & Silver Trading Alerts
Forex Trading Alerts
Oil Investment Updates
Oil Trading Alerts

