

A double bottom, a breakout above the consolidation and buy signals generated by the indicators. Can bulls fail with such a combination of positive factors?
- EUR/USD: short (a stop-loss order at 1.1593; the initial downside target at 1.1337)
- GBP/USD: short (a stop-loss order at 1.2968; the initial downside target at 1.2630)
- USD/JPY: none
- USD/CAD: none
- USD/CHF: none
- AUD/USD: short (a stop-loss order at 0.7288; the initial downside target at 0.7055)
EUR/USD
Yesterday, we wrote the following:
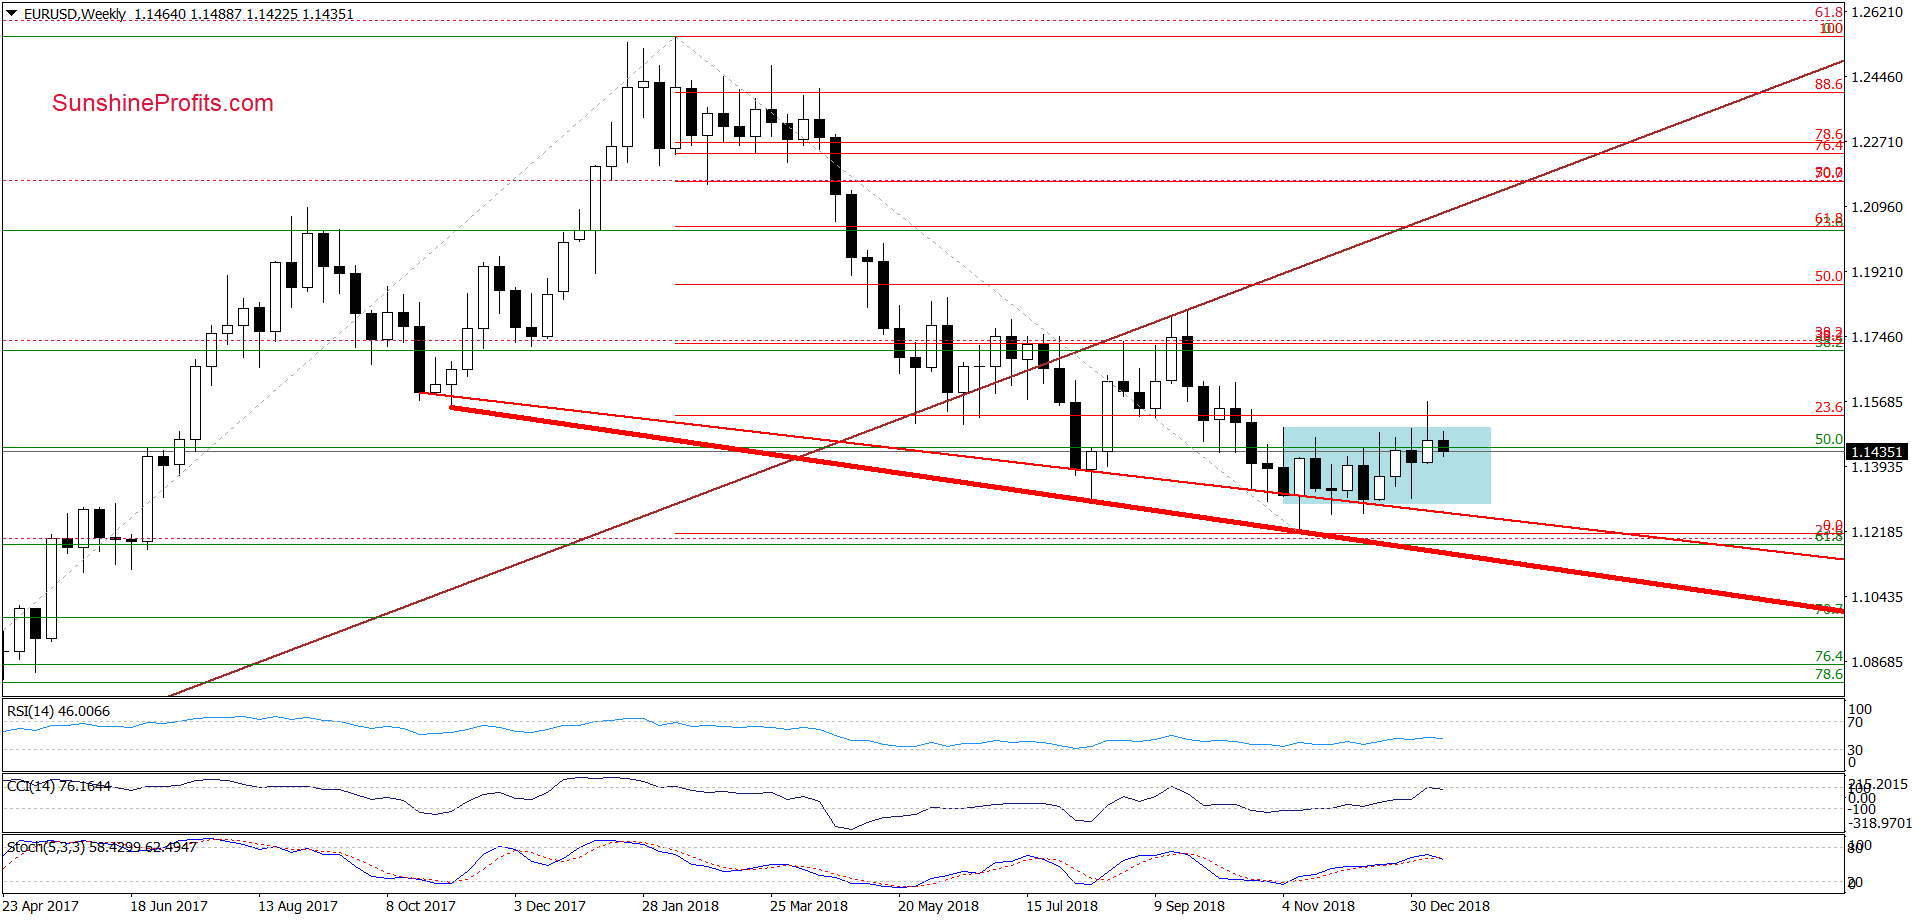
(…) EUR/USD (…) broke above the upper border of the blue consolidation in the previous week, but despite this improvement currency bulls didn’t manage to hold gained levels.
As a result, the pair pulled back and invalidated the earlier breakout not only above the consolidation, but also the 23.6% Fibonacci retracement, which together with the current position of the indicators suggests that lower values of the exchange may be just around the corner.
Looking at the weekly chart, we see that the situation developed in line with the above scenario and currency bears took the exchange rate lower earlier today. How did this drop affect the daily chart?
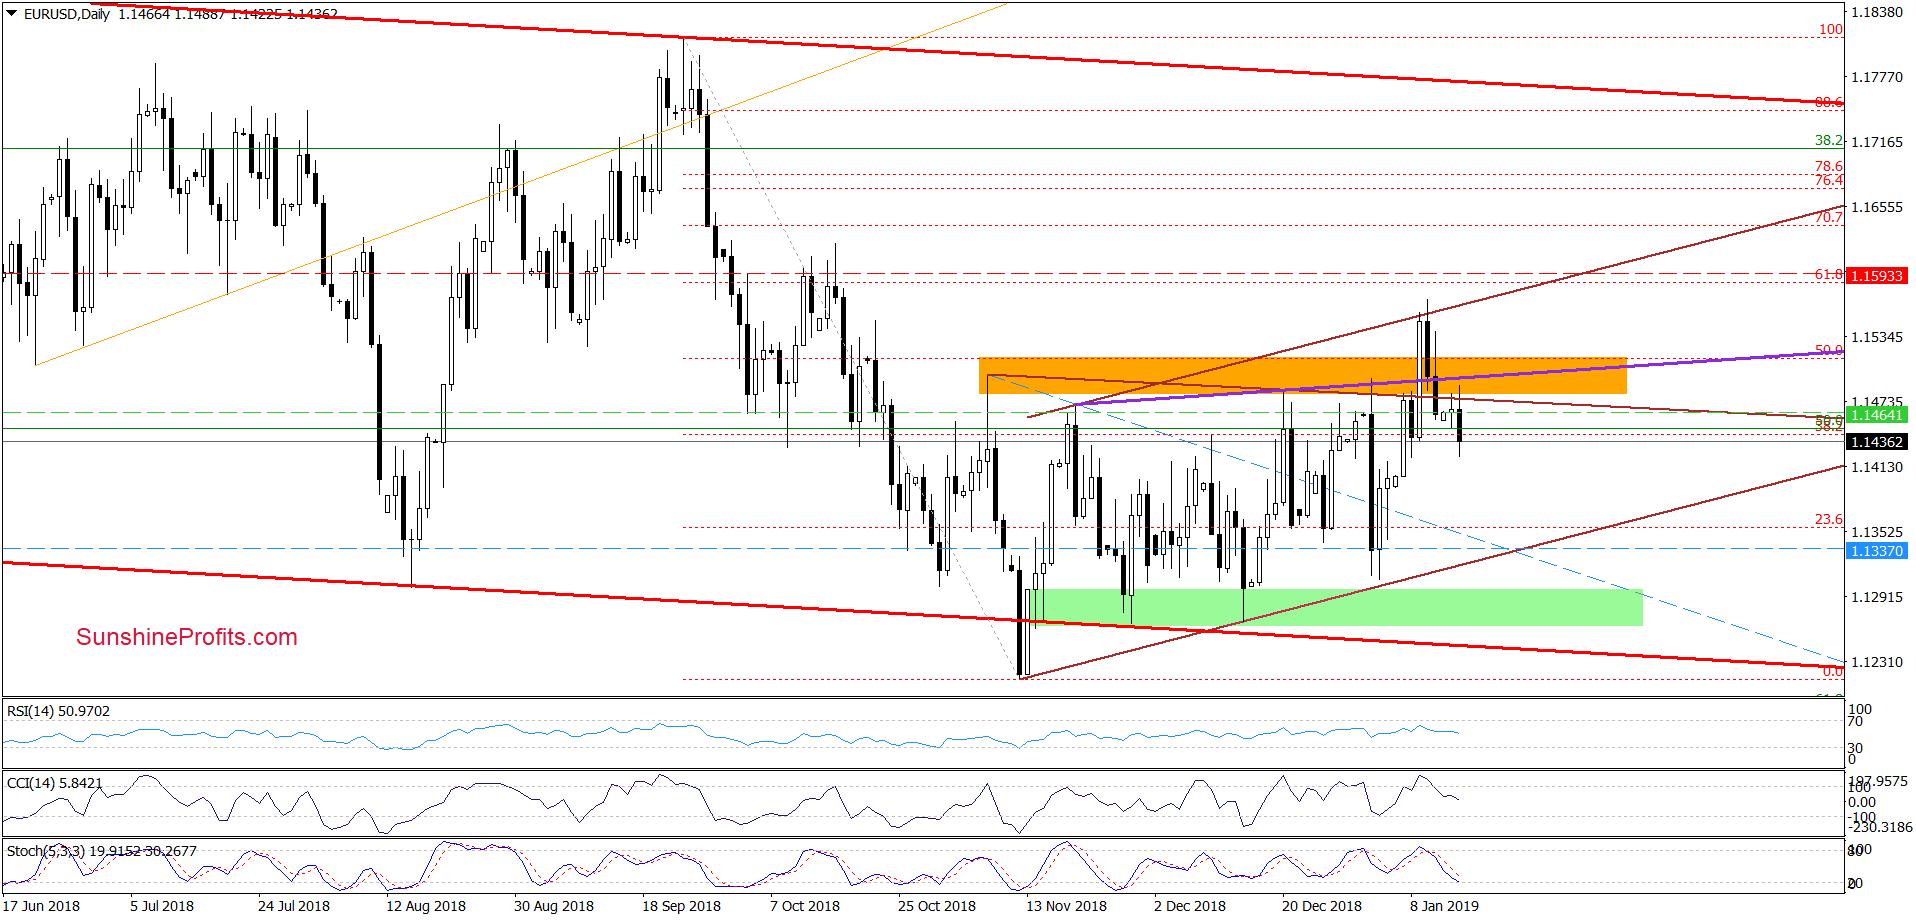
From today’s point of view, we see that although currency bulls tried to take EUR/USD higher earlier today, they failed because the upper line of the brown triangle in combination with the lower border of the orange zone stopped them for the second time in a row.
As a result, the exchange rate turned south and declined under Wednesday low, making our short positions profitable and increasing the probability of further deterioration in the following days.
How low can EUR/USD go? We believe that the best answer to this question will be the quote from our Friday’s alert:
(…) This scenario will be even more likely if the exchange rate closes today’s session under all these support/resistance levels. If we see such price action, we’ll likely open short positions because currency bears could take the pair to around 1.1335 or even the lower border of the brown triangle in the following days (currently at 1.1316).
Trading position (short-term; our opinion): Short positions with a stop-loss order at 1.1593 and the initial downside target at 1.1337 are justified from the risk/reward perspective. We will keep you informed should anything change, or should we see a confirmation/invalidation of the above.
USD/CAD
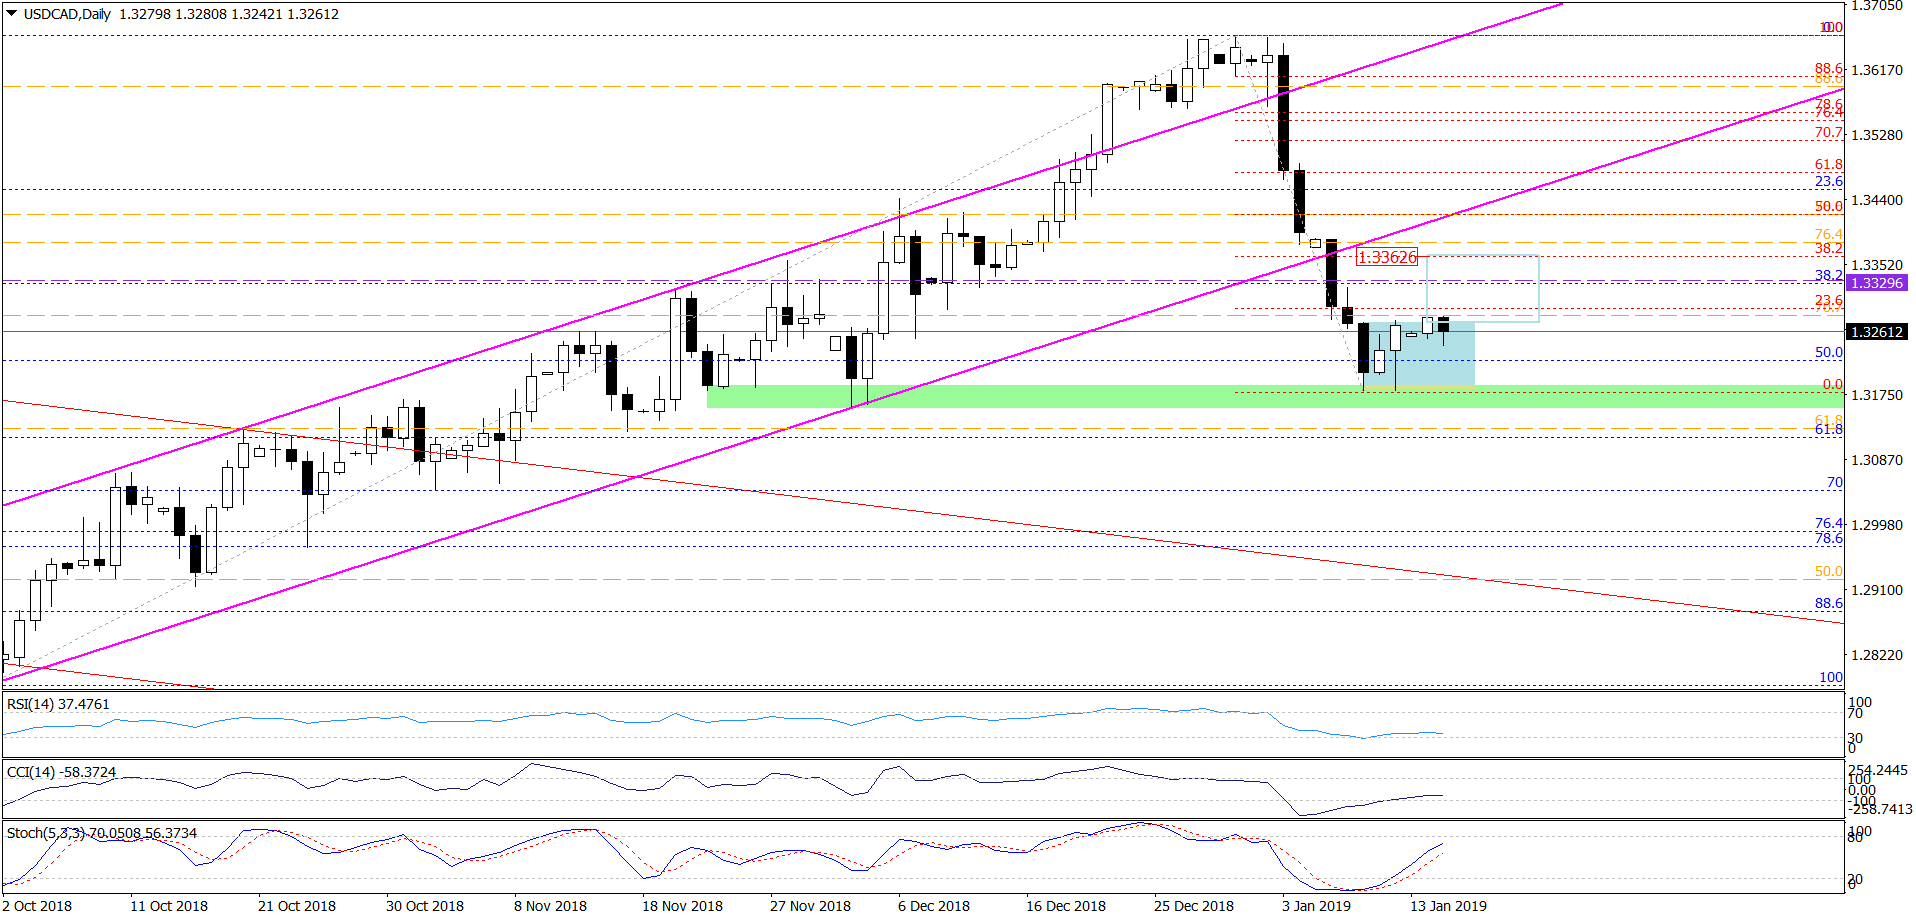
On the daily chart, we see that USD/CAD bounced off the green support zone (created by the late-November and early-December lows) in the previous week, activating a double-bottom formation (based on the last week’s lows). Additionally, all daily indicators generated buy signals, giving the bulls a green light for further growth (to at least 1.3329, where the size of the move will correspond to the height of the pattern).
On top of that, the buyers pushed the pair above the upper border of the blue consolidation during yesterday’s session, increasing the likelihood of an upward move to around 1.3362, where the size of the correction will be equal to the height of the blue consolidation (around the 38.2% Fibonacci retracement based on the entire recent decline).
Nevertheless, despite all these positive factors, currency bulls allowed their rivals to take USD/CAD below the previously-broken upper border of the consolidation earlier today, which doesn’t bode well (at least for the moment) for further improvement and an implementation of the aforementioned pro-growth scenarios.
However, before the bulls’ plans will be canceled currency bears will have to close today's session inside the consolidation. If it happens, the risk of a re-test of the green support zone (or even a fresh low) will increase, but if they fail, the pro-growth scenarios will return to the game.
Trading position (short-term; our opinion): No positions are justified from the risk/reward perspective. We will keep you informed should anything change, or should we see a confirmation/invalidation of the above.
USD/CHF
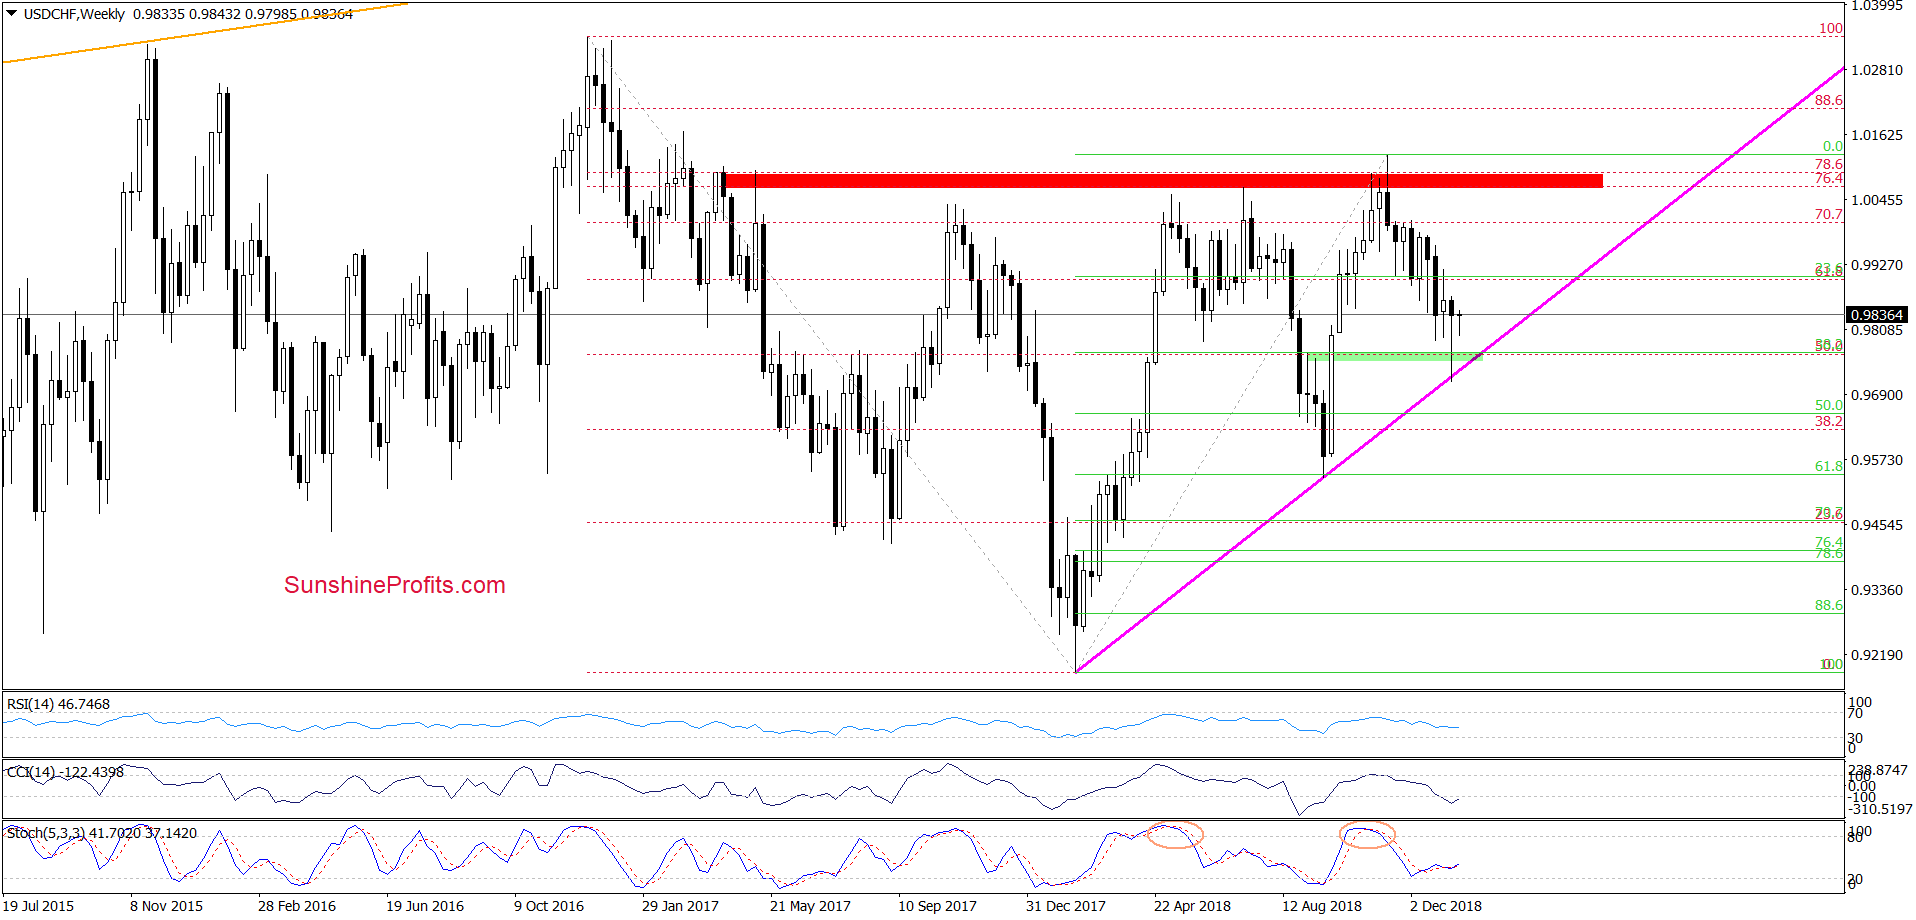
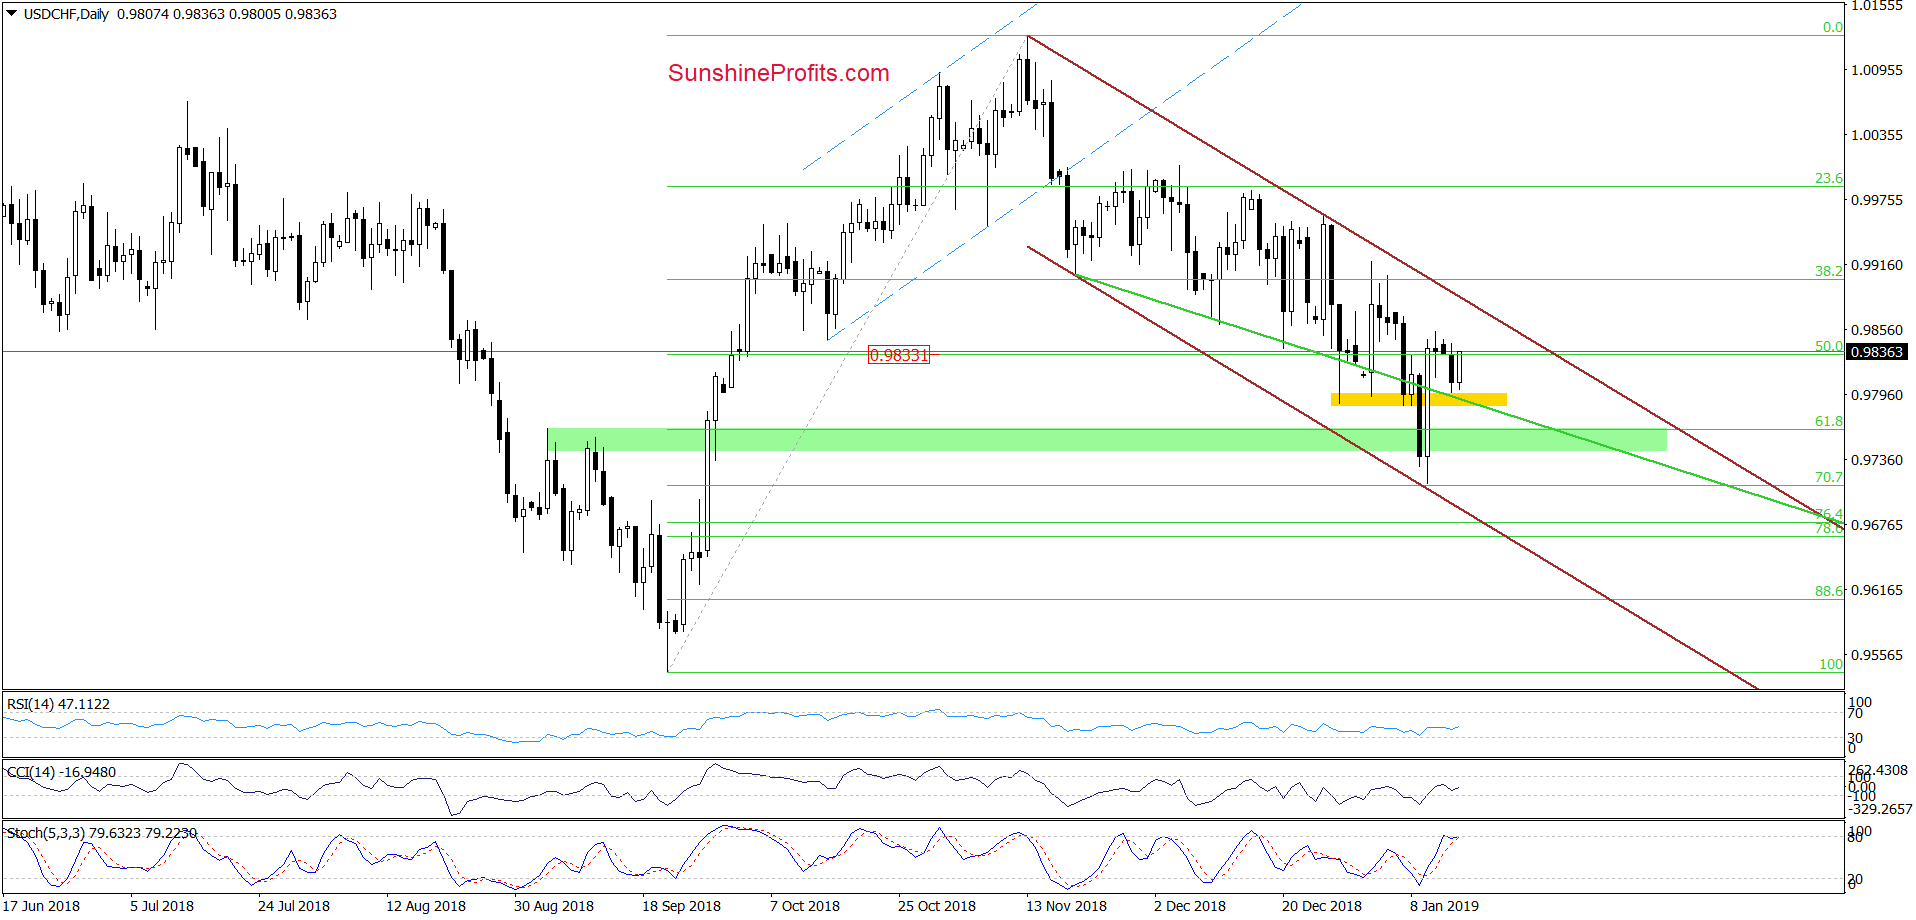
Although the pair broke above the green resistance line based on the previous lows and invalidated the earlier breakdown in the previous week, currency bears decided to check the strength of their rivals and started a new week with a test of the yellow support zone.
Thanks to yesterday’s drop, the pair also slipped to the above-mentioned green line, which looks like a verification of the last week’s breakout. If this is the case and the buyers push USD/CHF higher in the coming day(s), we’ll see at least a test of the upper border of the brown declining trend channel.
If currency bulls manage to break above it, we’ll consider opening long positions. Until this time, waiting at the sidelines seems to be the best decision. We will keep you informed should anything change, or should we see a confirmation/invalidation of the above.
Trading position (short-term; our opinion): No positions are justified from the risk/reward perspective.
Thank you.
Nadia Simmons
Forex & Oil Trading Strategist
Przemyslaw Radomski, CFA
Editor-in-chief, Gold & Silver Fund Manager

