

From week to week, the U.S. dollar strengthened against its Canadian counterpart. Thanks to last year's increases, the currency pair approached the important resistance zone, which encouraged the bears to come back to the trading floor. What are the consequences of this event?
- EUR/USD: short (a stop-loss order at 1.1525; the initial downside target at 1.1250)
- GBP/USD: short (a stop-loss order at 1.2844; the initial downside target at 1.2490)
- USD/JPY: none
- USD/CAD:none
- USD/CHF:none
- AUD/USD:none
EUR/USD
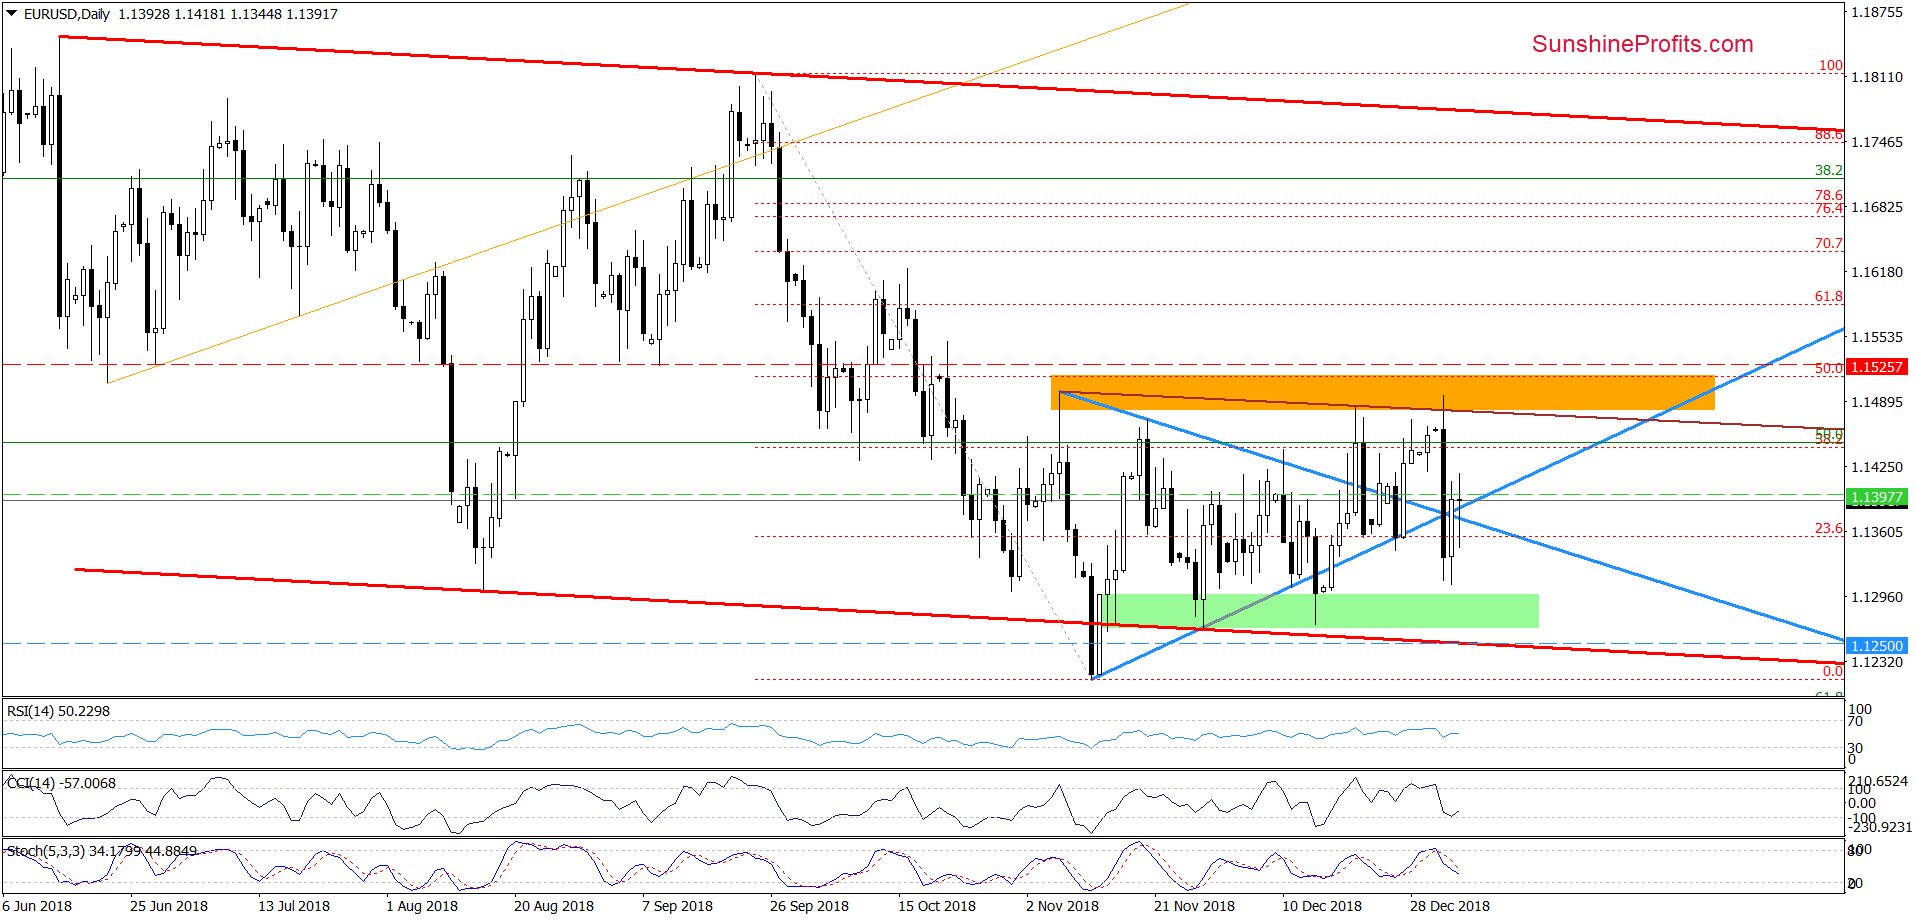
From today’s point of view, we see that although EUR/USD climbed above the previously-broken upper and lower border of the blue triangle yesterday (and also earlier today), currency bulls have some problems with further improvement.
Additionally, the sell signals generated by the indicators remain in the cards, suggesting another attempt to move lower in the very near future. Therefore, we continue to think that our recent comments on this currency pair are up-to-date also today:
(…) the exchange rate invalidated not only the earlier breakout above the previous peak and the orange zone, but also the brown declining resistance line based on the previous highs.
Additionally, the CCI and the Stochastic Oscillator generated sell signals, suggesting further deterioration in the following days. This scenario will be even more likely and reliable if EUR/USD drops under both arms of the blue triangle.
If we see such price action, the way to the lower border of the red declining trend channel will be open (around 1.1250 at the moment of writing this alert). (…)
Trading position (short-term; our opinion): Short positions with a stop-loss order at 1.1525 and the initial downside target at 1.1250 are justified from the risk/reward perspective. We will keep you informed should anything change, or should we see a confirmation/invalidation of the above.
GBP/USD
Quoting our Wednesday’s alert:
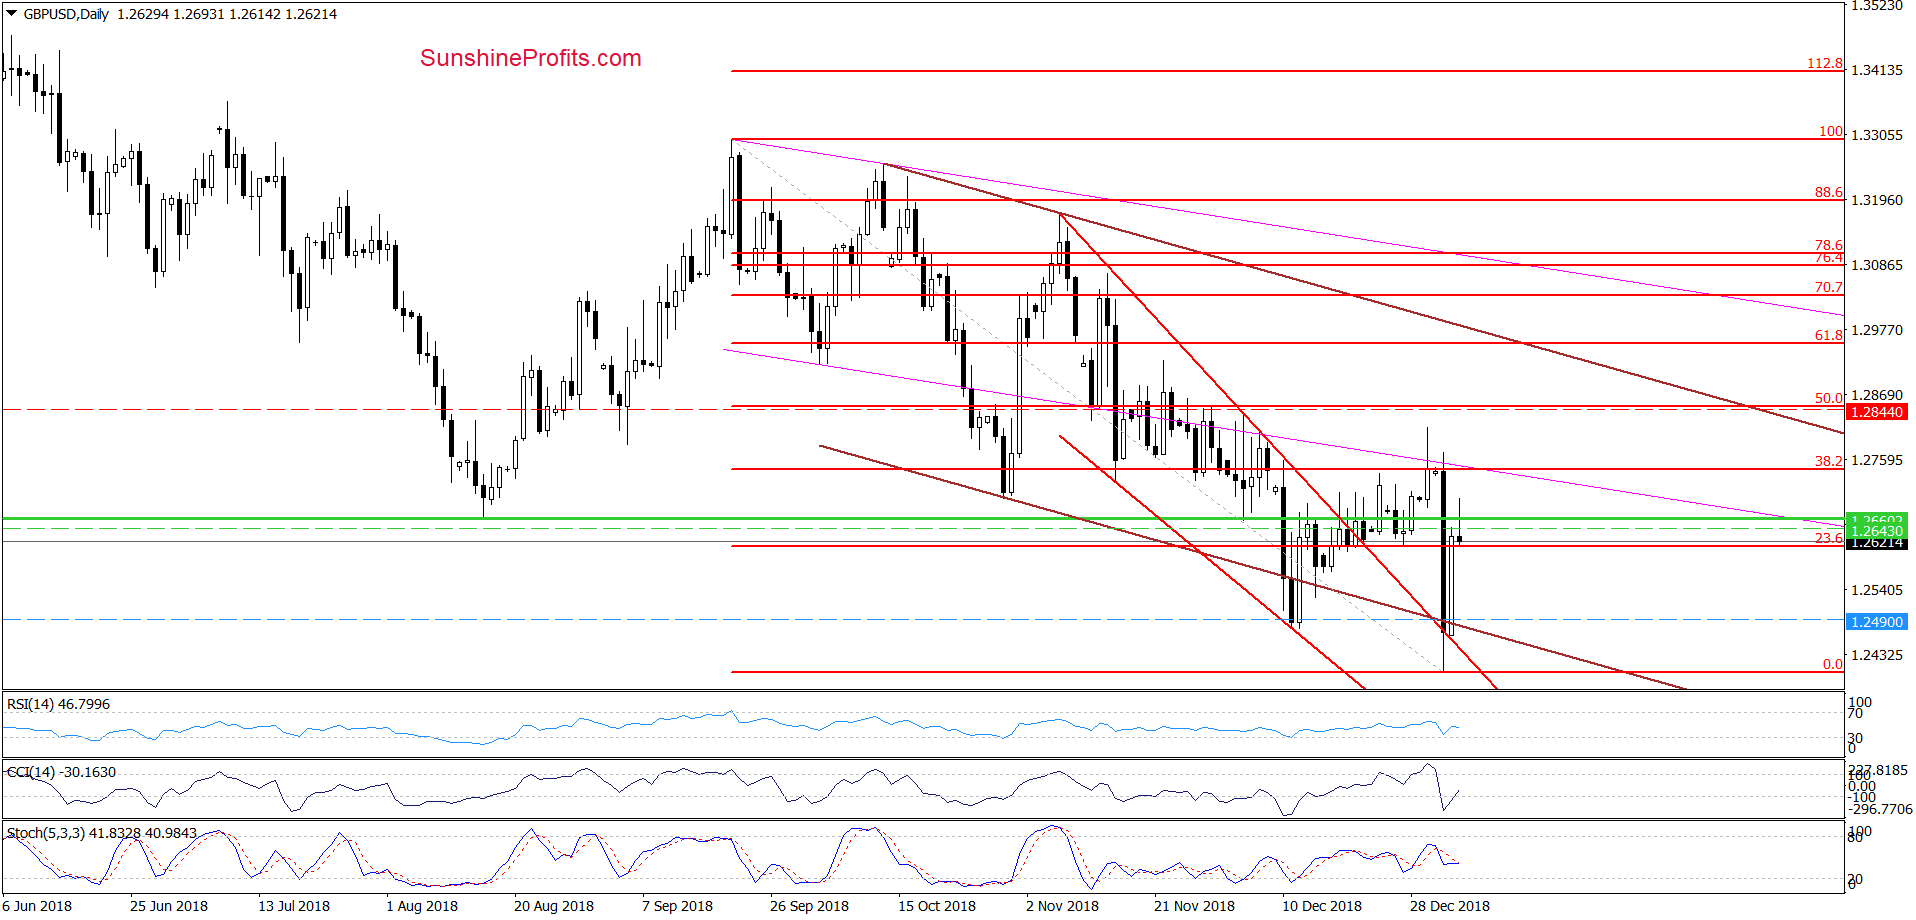
(…) GBP/USD reached our upside target during Monday’s session. Despite this improvement, currency bulls didn’t manage to hold gained levels, which resulted in a pullback and an invalidation of the earlier tiny breakout above the Fibonacci retracement.
This negative development triggered further deterioration earlier today, which caused a sharp downswing and a comeback under the green horizontal line (another bearish sign). On top of that, the CCI and the Stochastic Oscillator generated sell signals, giving the sellers one more reason to act.
Connecting the dots, we think that (…) GBP/USD can decline even to the lower border of the brown declining trend channel (at around 1.2490 at the moment of writing these words) in the following days.
From today’s point of view, we see that we did not have to wait long to see currency bears in the above-mentioned support area, because GBP/USD sharply dived in the next hours after the publication of our alert.
The combination of the previously-broken upper line of the red declining trend channel and the lower border of the brown declining channel encouraged the buyers to act, which translated into a sharp rebound on the following day.
Despite this upswing, the exchange rate slipped under the green horizontal line, invalidating the earlier tiny breakout earlier today, which looks like a verification of the earlier breakdown. If this is the case and the pair closes today’s session below this line, we’ll likely see a re-test of the recent lows in the coming week.
Trading position (short-term; our opinion): Short positions with a stop-loss order at 1.2844 and the initial downside target at 1.2490 are justified from the risk/reward perspective. We will keep you informed should anything change, or should we see a confirmation/invalidation of the above.
USD/CAD
In our last commentary on this currency pair, we wrote the following:
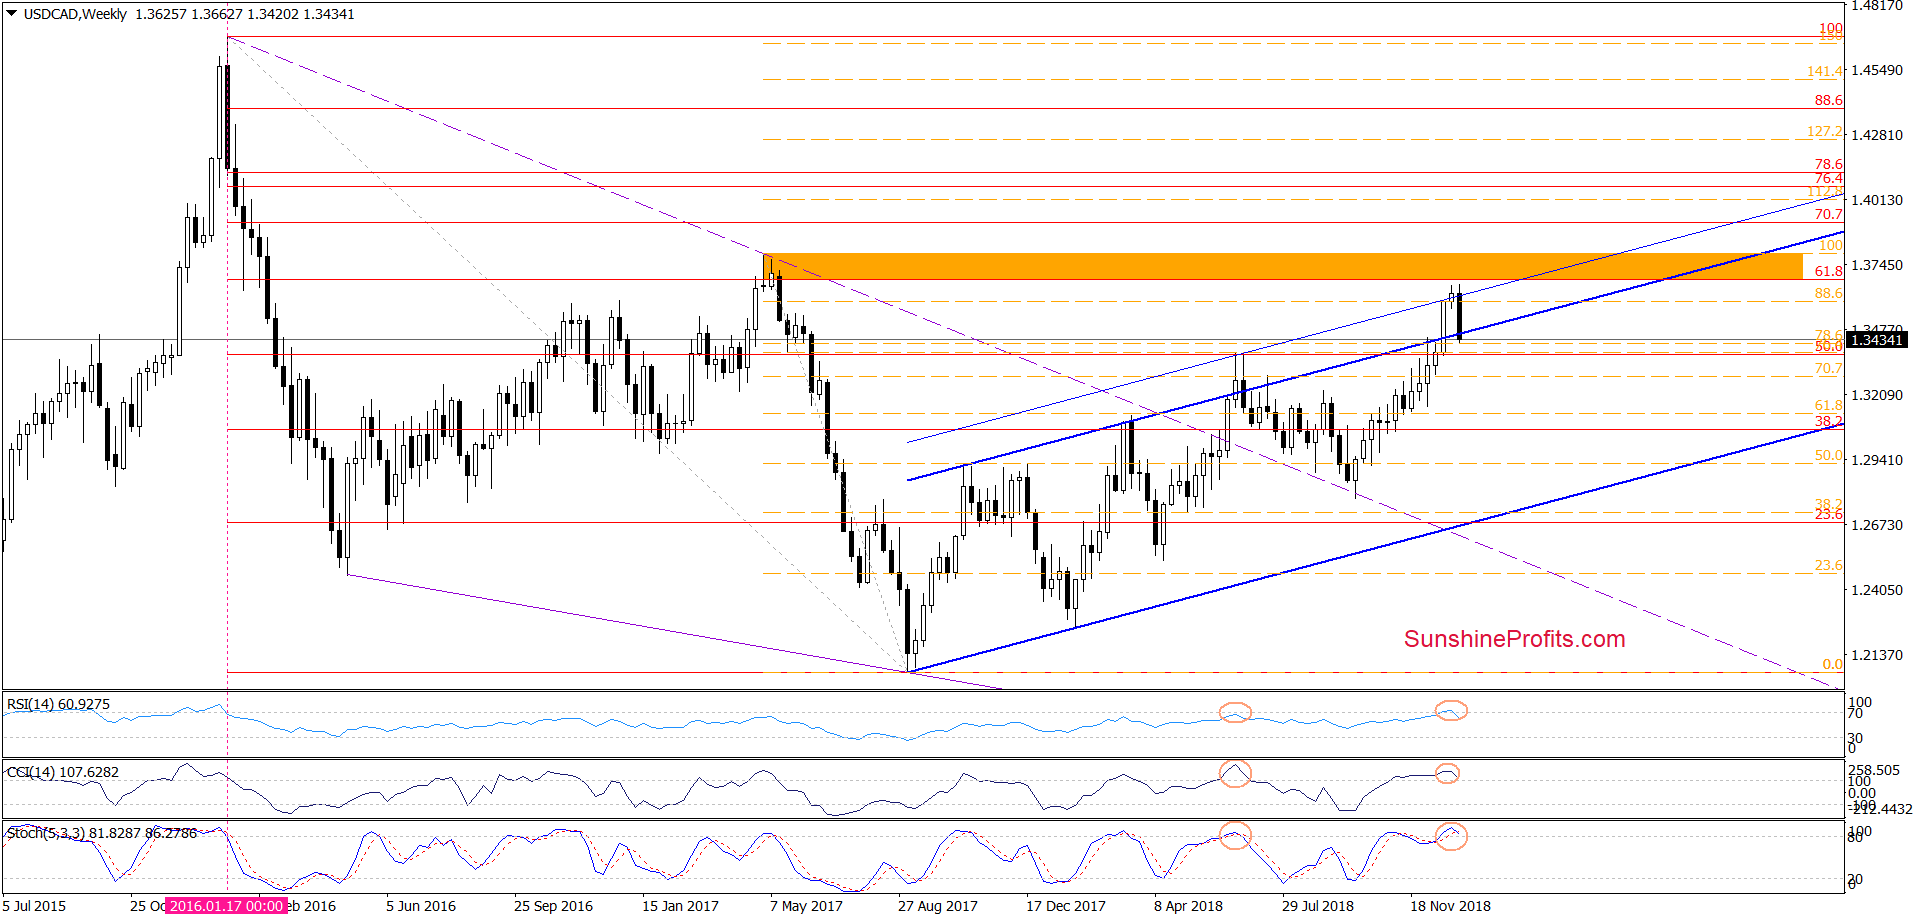
(…) the current position of the weekly indicators suggests that the space for increases may be limited. What do we mean by that? As you see on the chart, the RSI climbed above the level of 70 for the first time since the beginning of 2016. Back then such high reading of the indicator preceded a significant correction, which suggests that we may see a similar price action in the coming week. This scenario is also reinforced by the bearish divergence between the CCI and the exchange rate and an extremally high reading of the Stochastic Oscillator.
Therefore, if the situation develops in tune with our assumptions and USD/CAD fail to break above the orange resistance zone, we’ll consider opening short positions. (…)
The first thing that catches the eye on the weekly chart is this week’s sharp drop (in line with our assumptions) and invalidation of the earlier tiny breakout above the thin blue resistance line (parallel to the upper border of the blue rising trend channel).
As you see on the chart, this negative development triggered further deterioration, which translated into a decline under the upper border of the blue rising trend channel. Additionally, the RSI and the Stochastic Oscillator generated the sell signals (while the CCI is very close to doing the same), increasing the probability of further deterioration in the coming week(s).
Therefore, if USD/CAD closes today’s session inside the blue trend channel (and we see an invalidation of the earlier breakout above this line), we’ll likely open short positions.
Trading position (short-term; our opinion): No positions are justified from the risk/reward perspective, but if we see a weekly closure under the upper border of the blue rising trend channel and an invalidation of the earlier breakout above this line, we’ll likely open short positions. We will keep you informed should anything change, or should we see a confirmation/invalidation of the above.
Thank you.
Nadia Simmons
Forex & Oil Trading Strategist
Przemyslaw Radomski, CFA
Founder, Editor-in-chief, Gold & Silver Fund Manager
Gold & Silver Trading Alerts
Forex Trading Alerts
Oil Investment Updates
Oil Trading Alerts

