

After a series of drops started at the beginning of the year, USD/CAD got stuck in a consolidation around the 50% Fibonacci retracement. Despite several previous attempts to break above the formation, the buyers were not strong enough to reach higher levels. Nevertheless, earlier today, currency bulls managed to close the ranks and continue to move north. How high can they take the exchange rate in the coming days?
- EUR/USD: half of existing short positions with a new stop-loss order at 1.1417 and the next downside target at 1.1298. In other words, we decided to close half of our profitable short positions at around our initial downside target (1.1337) and take profits off the table.
- GBP/USD: none
- USD/JPY: none
- USD/CAD: none
- USD/CHF: none
- AUD/USD: short (a stop-loss order at 0.7288; the initial downside target at 0.7055)
EUR/USD
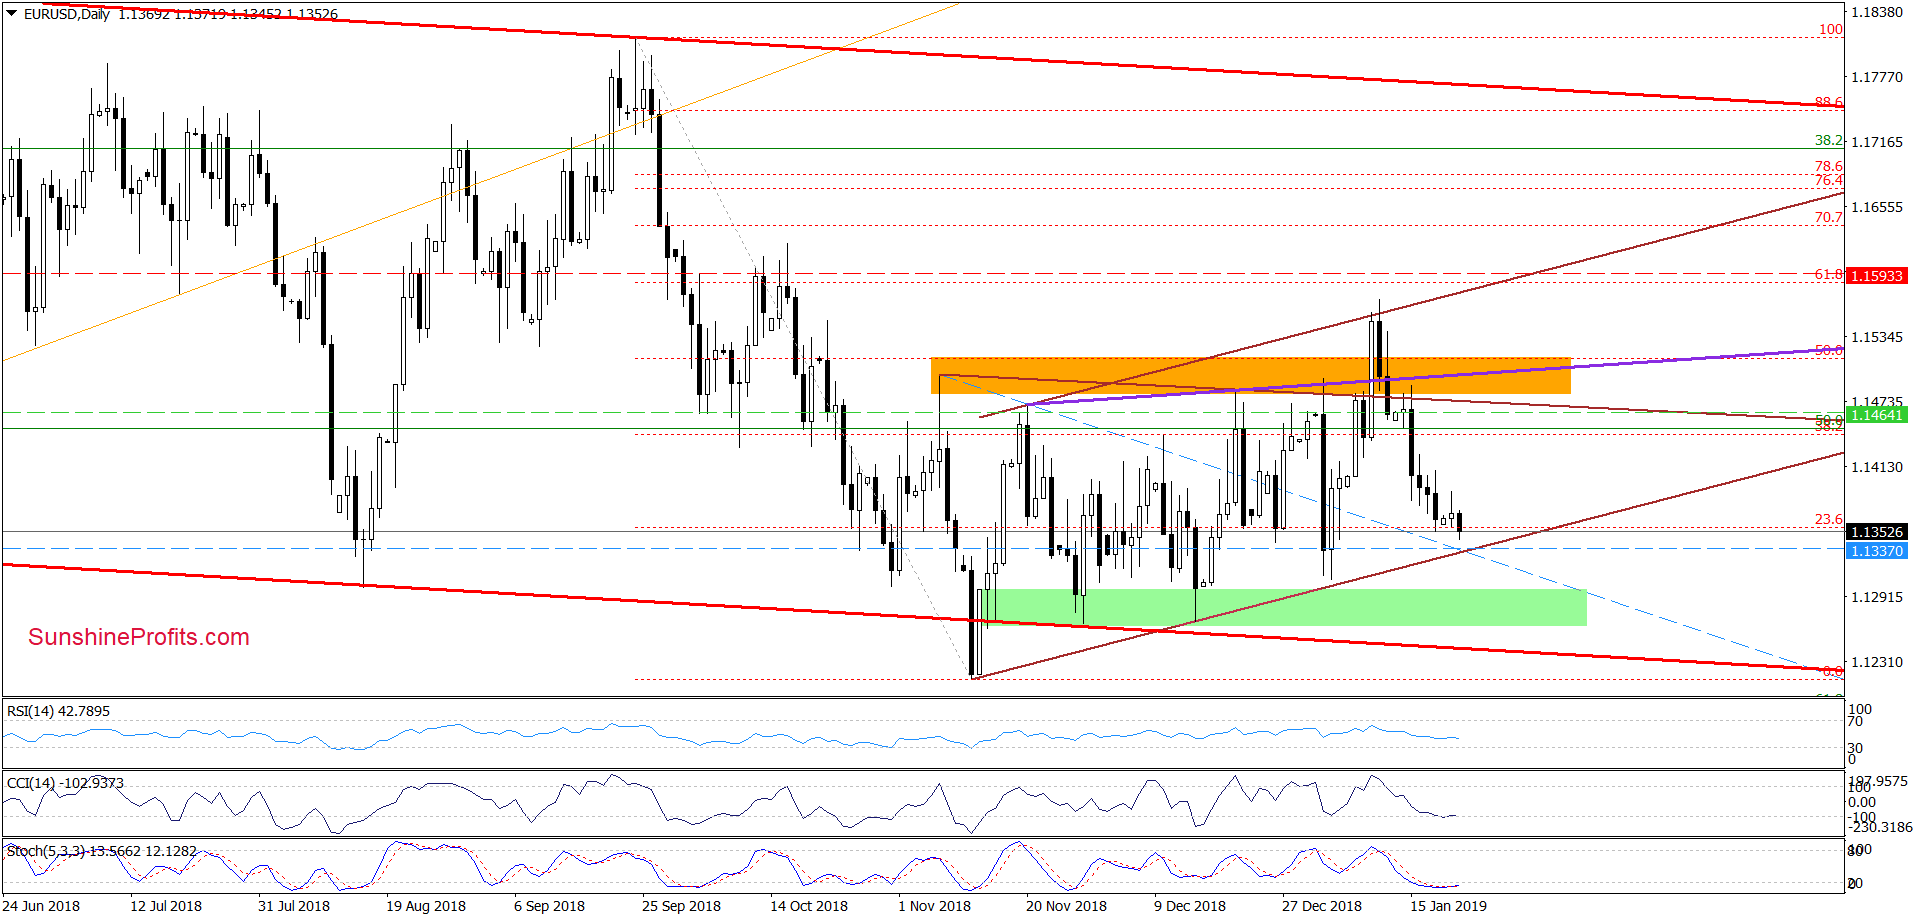
Earlier today, EUR/USD extended losses, which means that we’ll see realization of the pro-bearish scenario about which we wrote in our Forex Trading Alert posted on January 11, 2019:
(…) currency bears could take the pair to around 1.1335 or even the lower border of the brown triangle in the following days (currently at 1.1316).
Finishing today’s commentary on this currency pair, we would like to add, that we decided to close half our short positions at our initial downside target and take profits off the table. We also decided to leave the other half of the positions (in line with the principle “let the profits grow”) and at the same time lower the current stop-loss order to 1.1417, which means that in the case of a sudden rebound from current levels, our half of the currently existing profitable positions will also be closed with a profit (as a reminder, we opened our short positions when EUR/USD was trading at around 1.1464). We will keep you informed should anything change, or should we see a confirmation/invalidation of the above.
Trading position (short-term; our opinion): Half of existing profitable short positions with a stop-loss order at 1.1417 and the next downside target at 1.1298 are justified from the risk/reward perspective.
USD/JPY
On Thursday, we wrote the following:
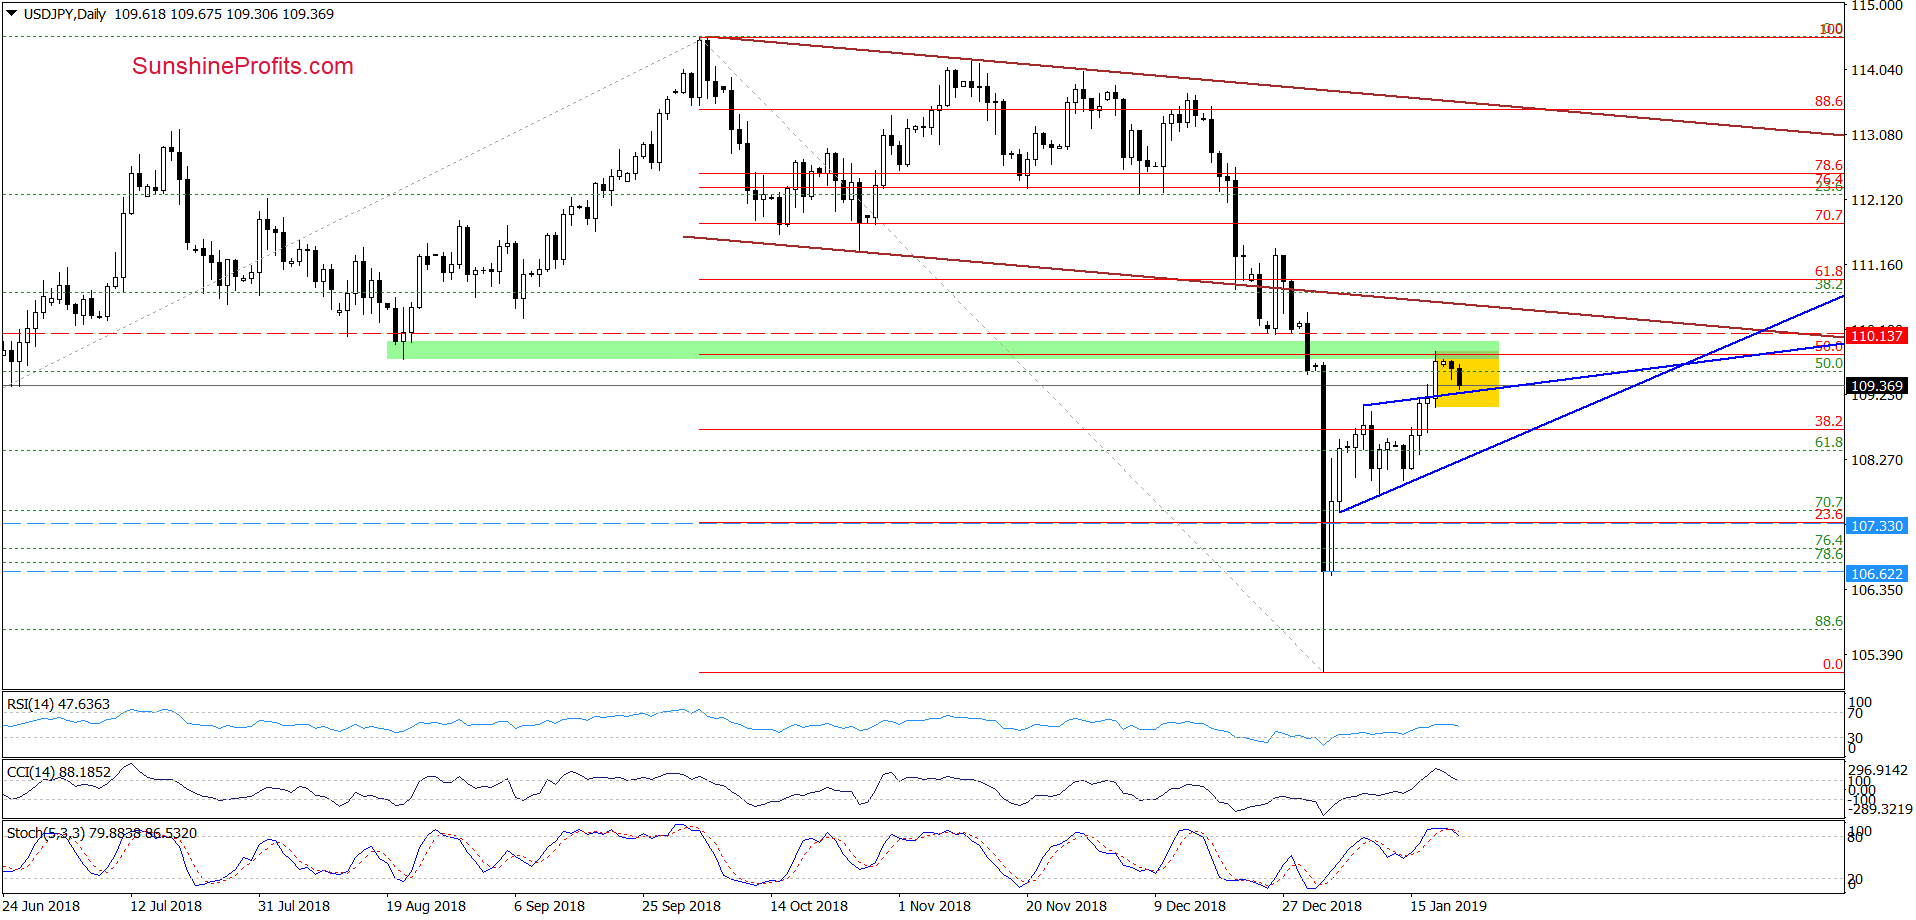
(…) the buyers took the exchange rate above the retracement once again, which resulted in a test of the upper border of the blue triangle and approached USD/JPY to the previously-broken late June lows (marked with the red horizontal dashed line).
Although this combination encouraged the sellers to act earlier today, the buy signals generated by the daily indicators remain in the cards, suggesting another attempt to move higher (to the above-mentioned red line or even the previously-broken green zone) in the very near future.
Looking at the daily char, we see that the situation developed in tune with the above assumption and USD/JPY reached our upside targets during recent sessions. As you see, the on the chart, the combination of the above-mentioned green zone and the 50% Fibonacci retracement triggered a pullback earlier this week, but despite this tiny deterioration, the exchange rate is still trading inside the yellow consolidation, which has formed around the upper border of the blue triangle.
Additionally, the pair is still trading above this support line, which means that as long as there is no breakdown below it all downswings could be nothing more than a verification of the last week’s breakout.
Nevertheless, taking into account the proximity to the above-mentioned resistances (that stopped the buyers in the previous week) and the current position of the daily indicators (the CCI and the Stochastic Oscillator are very close to generating sell signals), we think that another move to the downside is just around the corner.
Therefore, if we see an invalidation of the breakout above the blue triangle and a drop below the lower border of the yellow consolidation, we’ll likely open short positions, because USD/JPY would likely test at least the lower border of the triangle. We will keep you informed should anything change, or should we see a confirmation/invalidation of the above.
Trading position (short-term; our opinion): No positions are justified from the risk/reward perspective.
USD/CAD
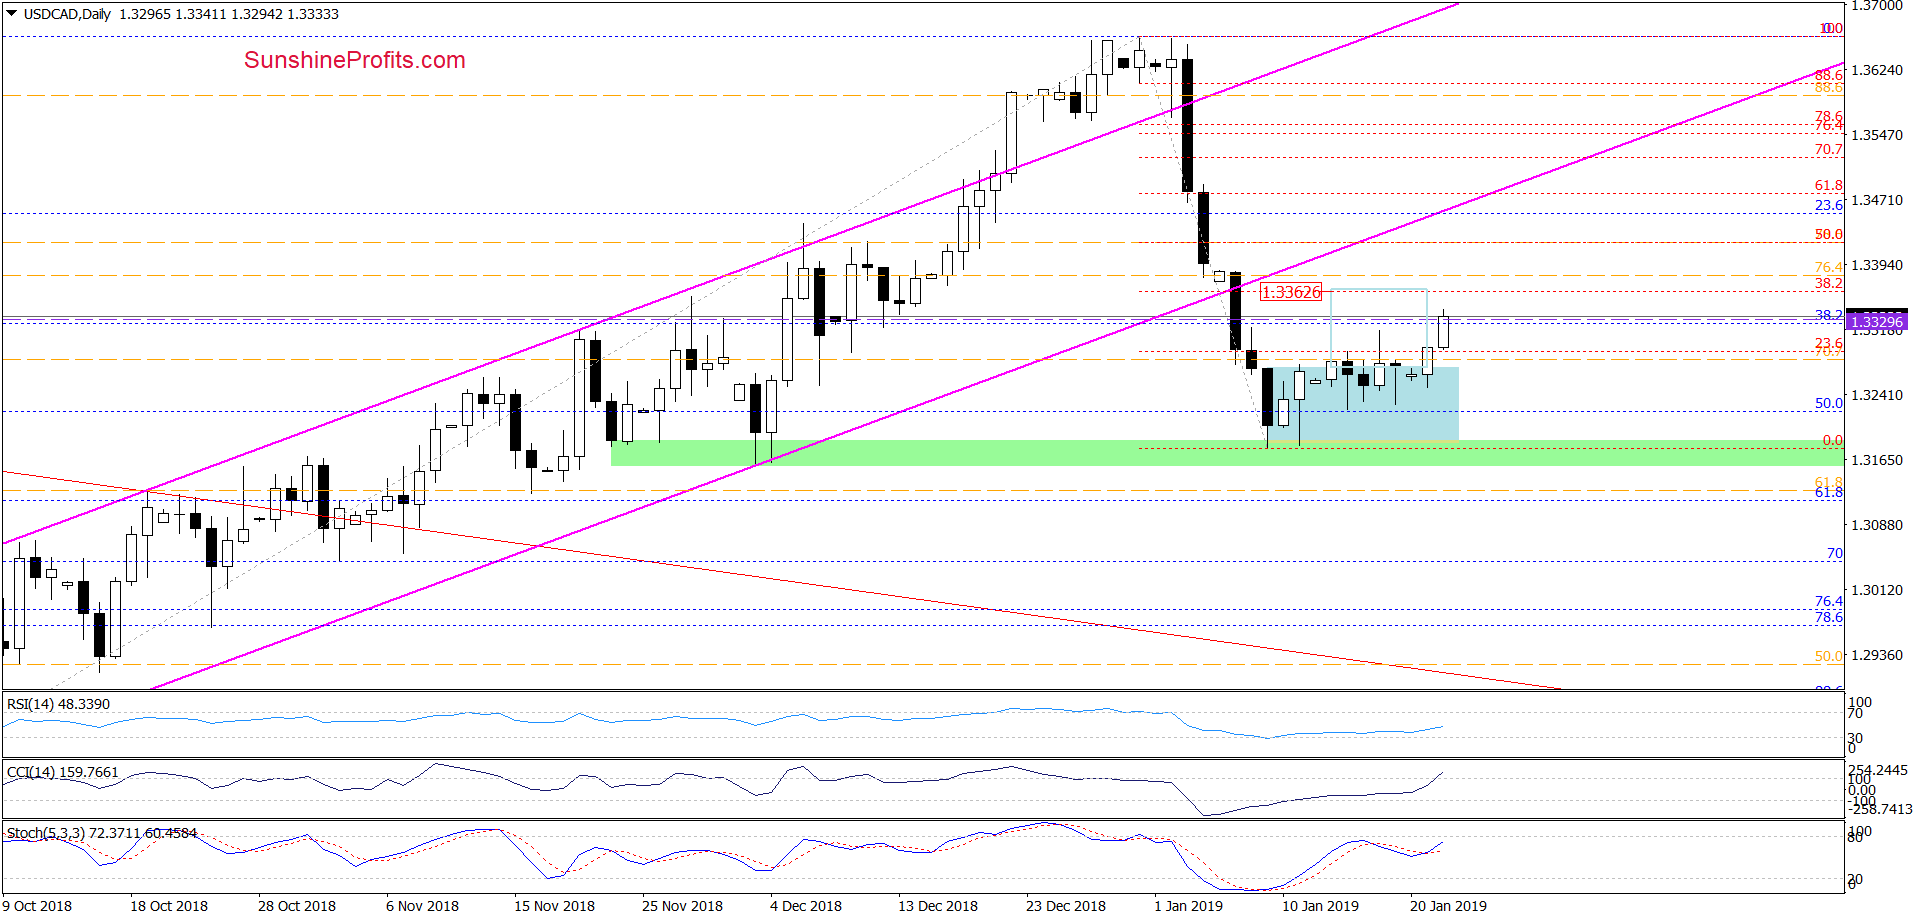
From today’s point of view, we see that although currency bulls had some problems with continuation of the upward move after the breakout above the upper line of blue consolidation, they finally closed the ranks and finished yesterday's sessions above this resistance.
This positive event encouraged the buyers to fight for higher values of USD/CAD earlier today, which suggests that we’ll see the realization of the pro-growth scenario, (about which we wrote in our last commentary on this currency pair) in the coming days:
(…) What could happen if the bulls win (…)? In our opinion, the likelihood of an upward move to around 1.3362 (where the size of the correction will be equal to the height of the blue consolidation (around the 38.2% Fibonacci retracement based on the entire recent decline)) will increase.
Trading position (short-term; our opinion): No positions are justified from the risk/reward perspective. We will keep you informed should anything change, or should we see a confirmation/invalidation of the above.
Thank you.
Nadia Simmons
Forex & Oil Trading Strategist
Przemyslaw Radomski, CFA
Editor-in-chief, Gold & Silver Fund Manager

