

Euro bulls are attempting another move higher today. Will they succeed? If so, what would that mean for the outlook going forward? With the Japanese yen and Canadian dollar moving in our favor to your delight, one could think that the forex market would give us an easy ride writing today’s Alert. Wrong! There is the recent candidate for opening long positions, have you forgotten? Its price action gives us some exciting scenarios ahead to share with you right now.
In our opinion, the following forex trading positions are justified - summary:
- EUR/USD: none
- GBP/USD: none
- USD/JPY: short (a stop-loss order at 112.32; the initial downside target at 109.82)
- USD/CAD:long (a stop-loss order at 1.3247; the initial upside target at 1.3530)
- USD/CHF: none
- AUD/USD: none
EUR/USD
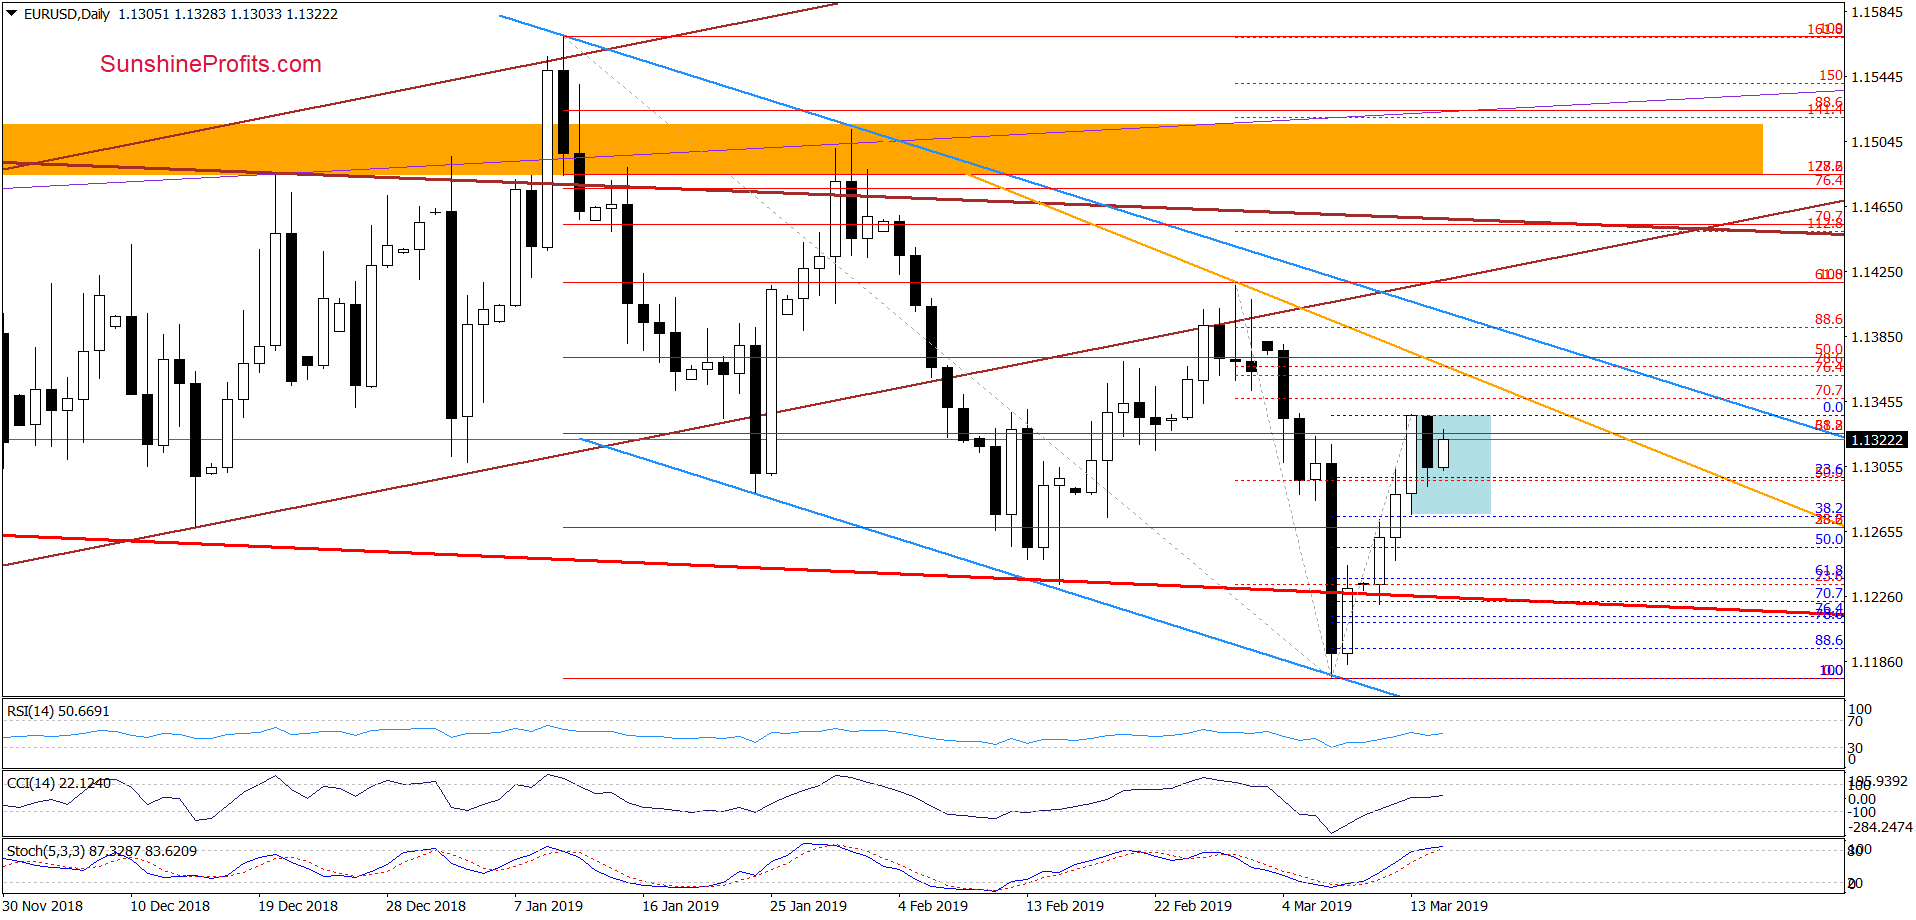
The overall situation in EUR/USD hasn’t changed much since yesterday. The exchange rate is still trading within the narrow range between Wednesday’s intraday high and low (marked for your convenience as the blue consolidation). Earlier today, the pair moved just to that Wednesday’s intraday high and currently trades at almost 1.1340 – we’ll wait for the closing prices to clarify the situation.
However, the Stochastic Oscillator has moved to its overbought area and looks like it’s flattening. It suggests that another attempt to move lower may be just around the corner. Should we see such price action, the first downside target would be around 1.1275. This is where yesterday’s low and the 38.2% Fibonacci retracement (based on the recent upward move) are.
Trading position (short-term; our opinion): No positions are justified from the risk/reward perspective. We will keep you informed should anything change, or should we see a confirmation/invalidation of the above.
USD/CHF
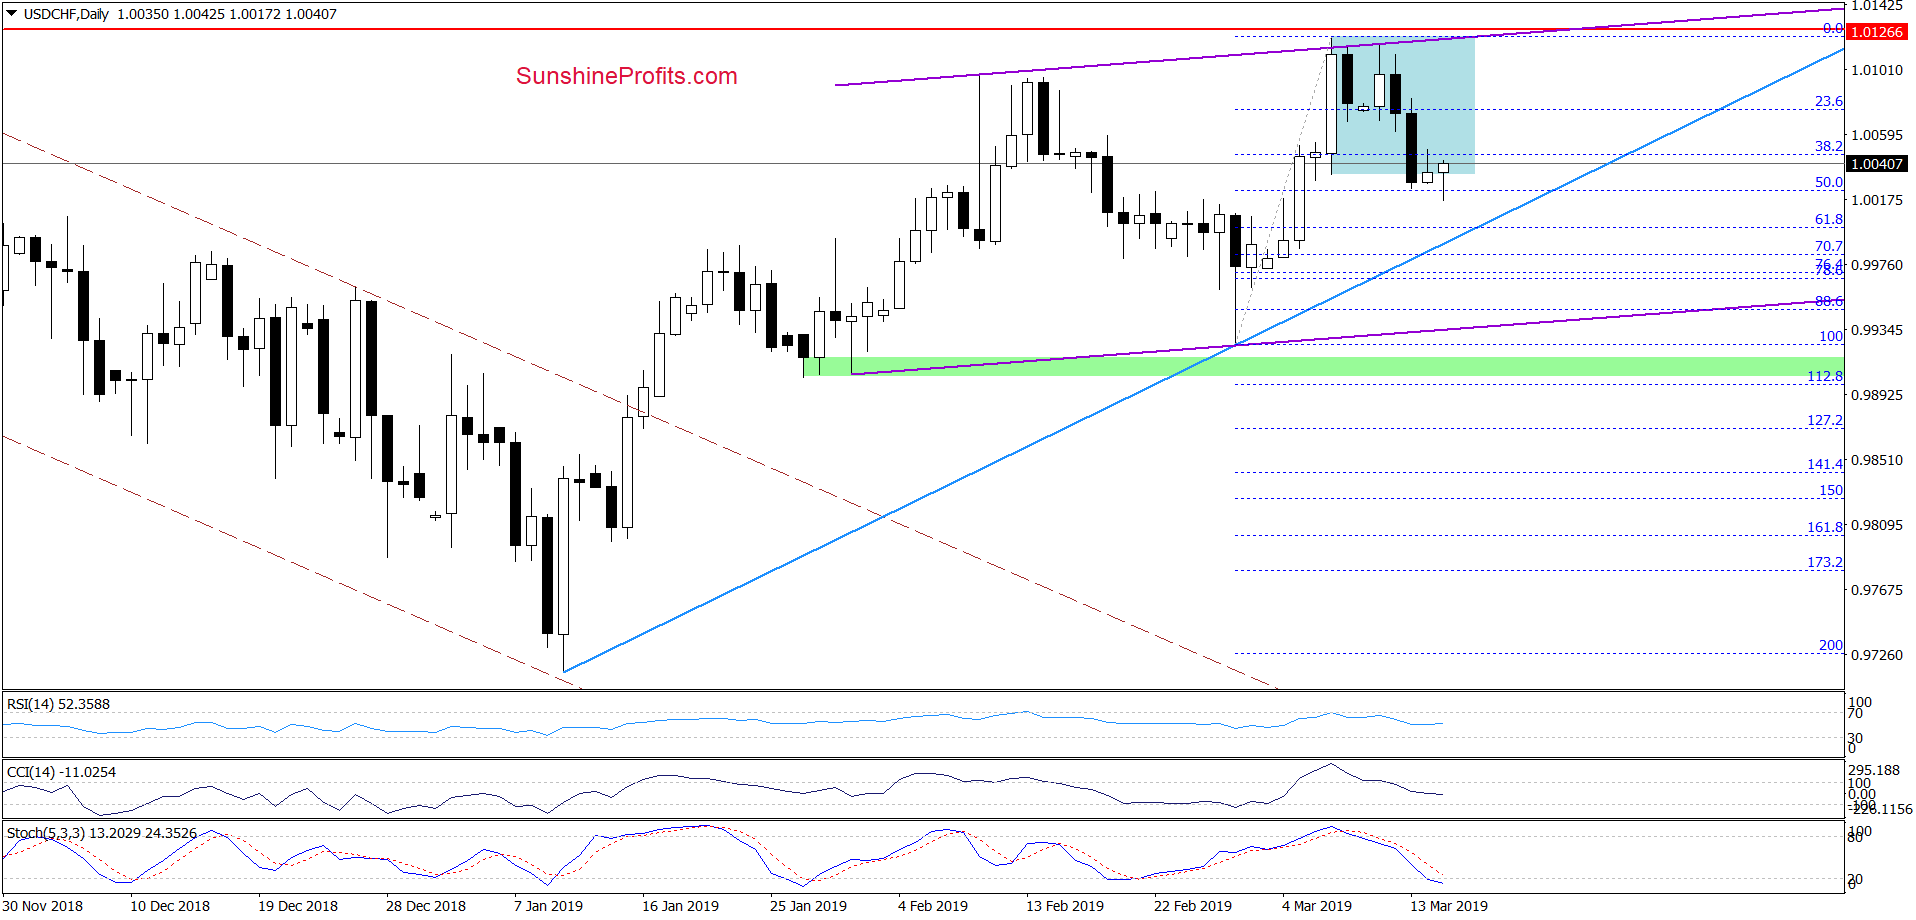
On Wednesday, USD/CHF moved sharply lower and broke below the lower border of the blue consolidation. The pair closed the day below the March 7th low. After yesterday’s pause, this triggered further deterioration earlier today, but the bulls are fighting hard to invalidate Wednesday’s breakdown.
If they succeed and USD/CHF closes today’s session back inside the consolidation, further improvement in the coming week would not surprise us in the least. If they fail however, today’s upswing could turn out to be just a verification of the breakdown below the blue consolidation, which could translate into a test of the blue rising support line based on the January and February lows further down the road.
Trading position (short-term; our opinion): No positions are justified from the risk/reward perspective. We will keep you informed should anything change, or should we see a confirmation/invalidation of the above.
AUD/USD
We wrote the following on Wednesday:
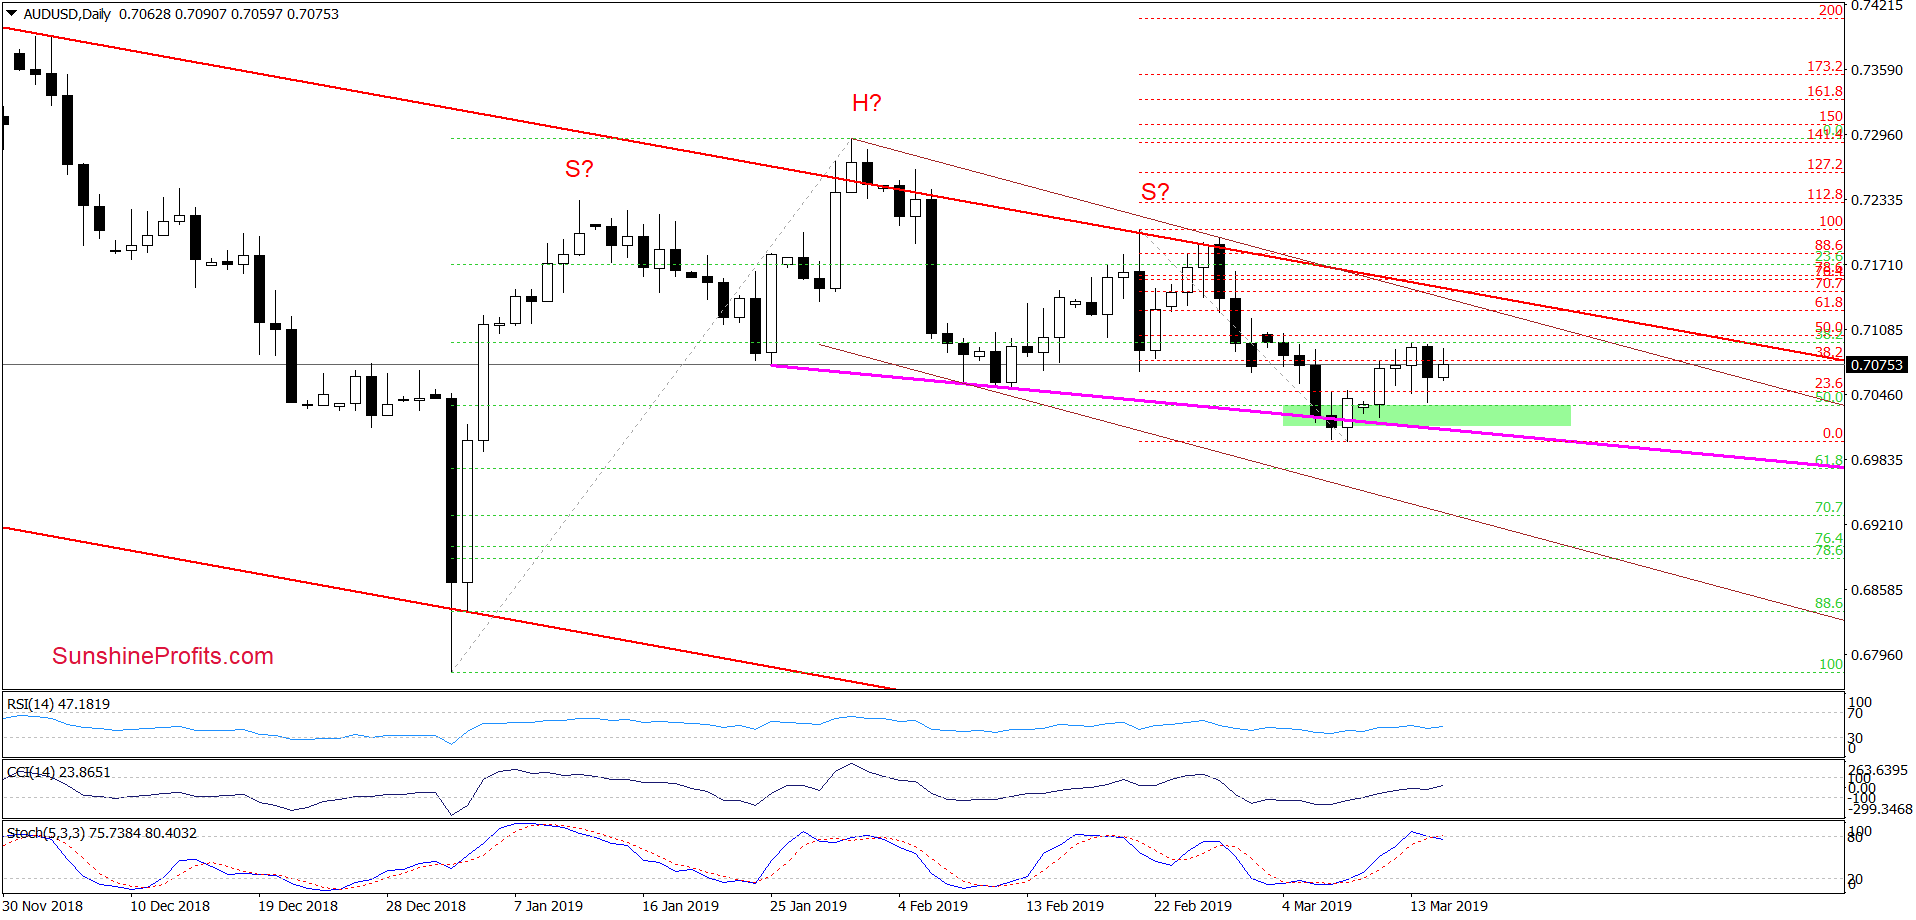
(…) In recent days, AUD/USD made a meek move above the green support zone. The size of rebound was indeed disappointing. The bulls reached the 38.2% Fibonacci retracement based on the entire February-March downward move only to see the rate roll over and aim down earlier today.
It appears that we’ll first see a verification of the earlier breakout above the green zone before another move to the upside becomes more likely again.
The situation in the very short term remains almost unchanged as AUD/USD is still trading between the green support zone and the 50% Fibonacci retracement (mostly around the 38.2% Fibonacci retracement). Yesterday, the pair almost touched the upper border of the green support zone. This made the Stochastic Oscillator curl down and issue its sell signal. The upswing earlier today doesn’t look to be significant enough to change the indicator’s signal.
As the Stochastic Oscillator is currently on a sell signal, it suggests that another attempt to move lower may be just around the corner. Such a move would then target the green zone in yet another retest.
We have mentioned previously that we were on the lookout for opening long positions. Two days ago, we also added that waiting on the sidelines is the prudent move here and now. The question that naturally follows is: when can we expect any bigger move? In our opinion, this will be more likely only if AUD/USD drops below the declining pink support line (this is the neck line of a potential top head and shoulders formation as marked with appropriate letters on the chart), or breaks above the upper border of the red declining trend channel. Until that time, short-lived moves in both directions should not surprise us in the least.
Trading position (short-term; our opinion): No positions are justified from the risk/reward perspective. We will keep you informed should anything change, or should we see a confirmation/invalidation of the above.
Thank you.
Nadia Simmons
Forex & Oil Trading Strategist

