

There are times to go long, times to go short, and times to go fishing. After all, who hasn't heard this or something along this line before. Let's see how the details tie in with today's analysis.
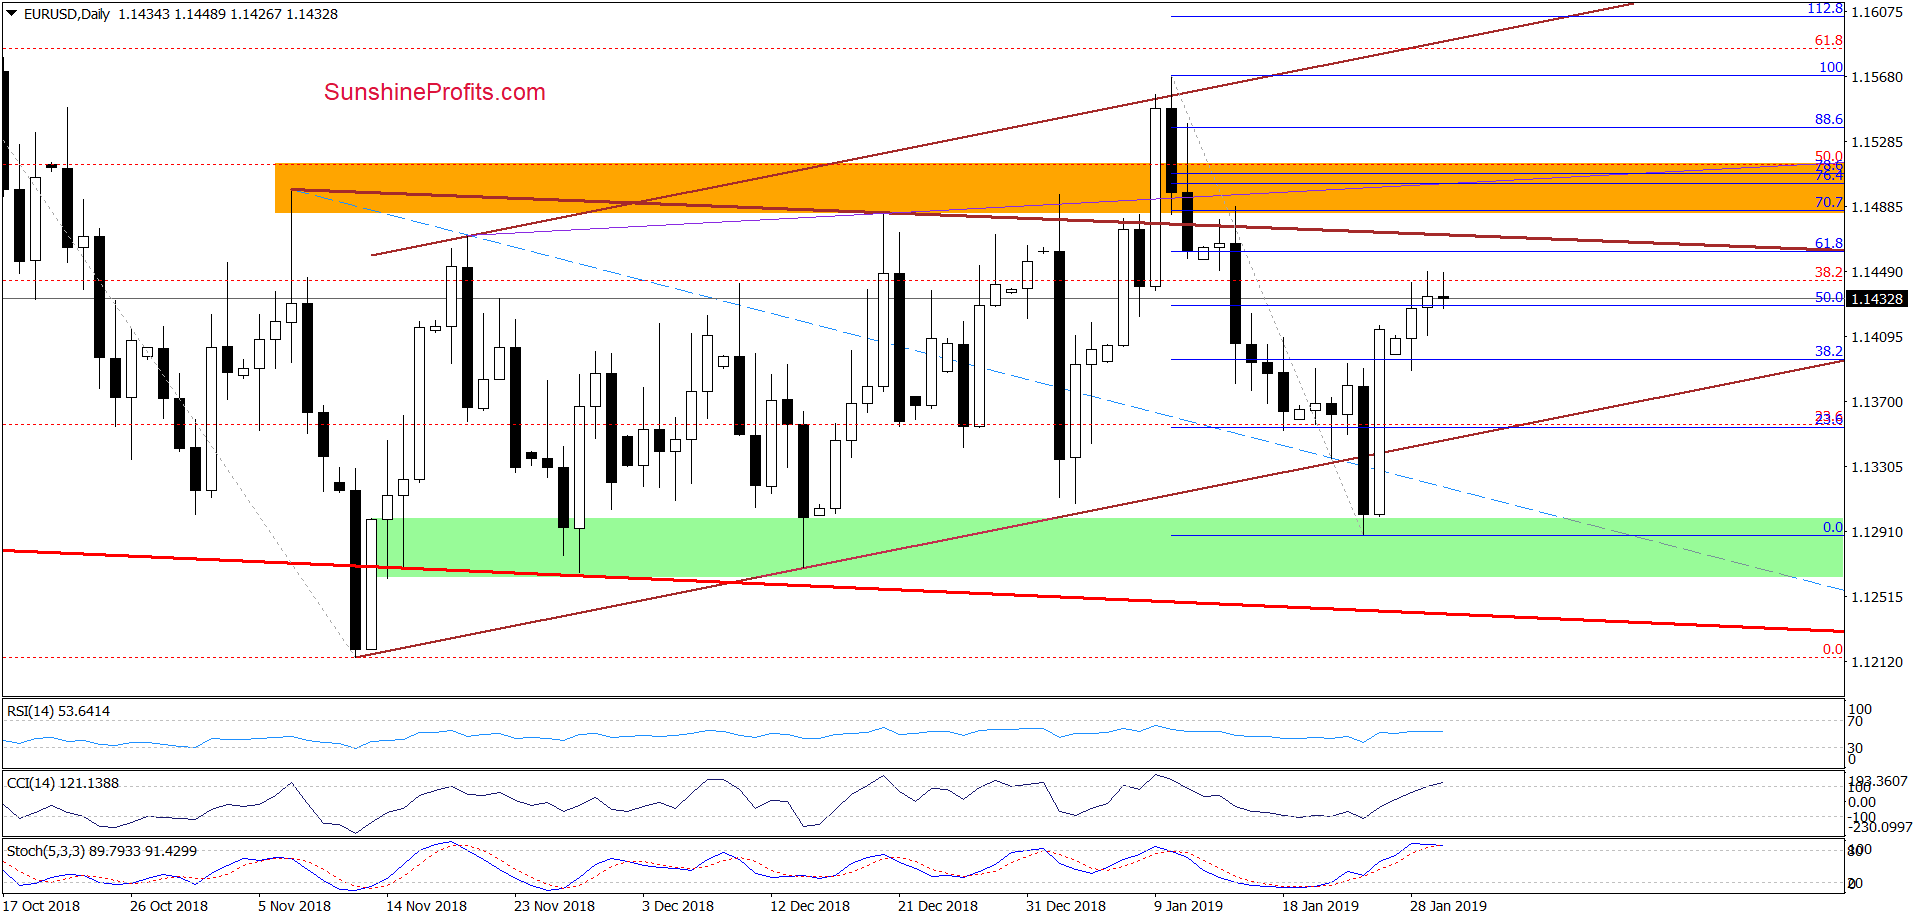
Yesterday, EUR/USD climbed above Monday’s intraday high and finished the day above Monday’s close. However, both the upper and lower knots are easily noticeable. This is especially true relative to the size of the body of the candle. The takeaway is indecision in the market before it commits to the next move. Both the CCI and the Stochastic Oscillator moved to their overbought areas, which suggests that reversal may be just around the corner. The bearish scenario gains more credibility with another rejection of the move higher that we are witnessing currently – and especially when we factor in the proximity to the 61.8% Fibonacci retracement and resistances about which we wrote on Monday:
(…) If (…) the pair extends gains from the current levels, we’ll likely see a test of the upper border of the brown triangle and the orange resistance zone in the coming days.
What does it mean for us? If we see reliable signals of the bulls’ weakness, we’ll consider re-opening short positions. It is always preferable to reopen positions once there is more clarity – preservation of capital is the first order of the game. We will keep you informed should anything change, or should we see a confirmation/invalidation of the above.
Trading position (short-term; our opinion): No positions are justified from the risk/reward perspective.
GBP/USD
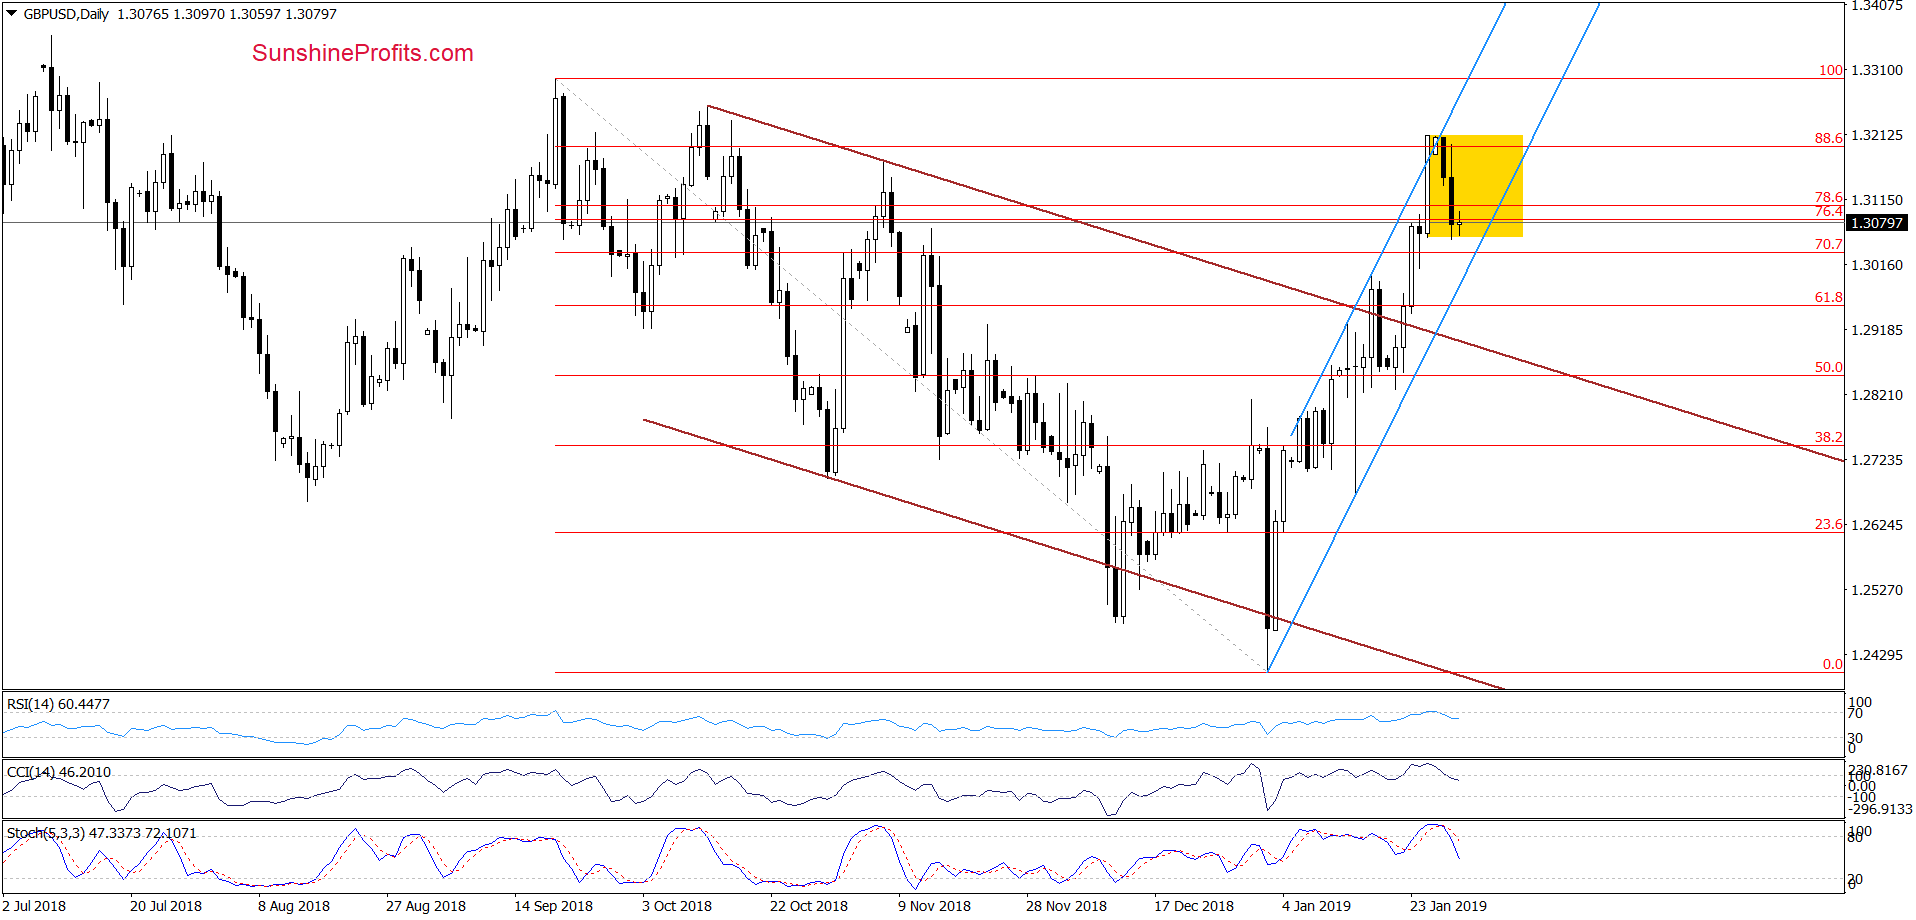
The sharp upward move shaped much of January's market action and landed the pair trading in the steeply rising blue trend channel. In recent days, GBP/USD paused and is currently stuck in the yellow consolidation area. Yesterday's session brought us retest of the highs that was soundly rejected and the pair finished the day near its lows. Additionally, the earlier tiny breakout above the upper line of the blue rising trend channel was invalidated and the daily indicators generated sell signals, increasing the probability of further deterioration.
Today's small retracement of the decline (the pair is currently trading at around 1.3115) is nothing to write home about and in line with the outlook presented above. The bearish developments we look for are a breakdown below the lower border of the yellow consolidation zone, preferably with a breakdown below the lower line of the blue trend channel, too. Remember, it would be wise to see the market commit to us first before we commit to the market. Therefore, if we see such a price action, we’ll consider opening short positions in the following day.
Trading position (short-term; our opinion): No positions are justified from the risk/reward perspective.
USD/JPY
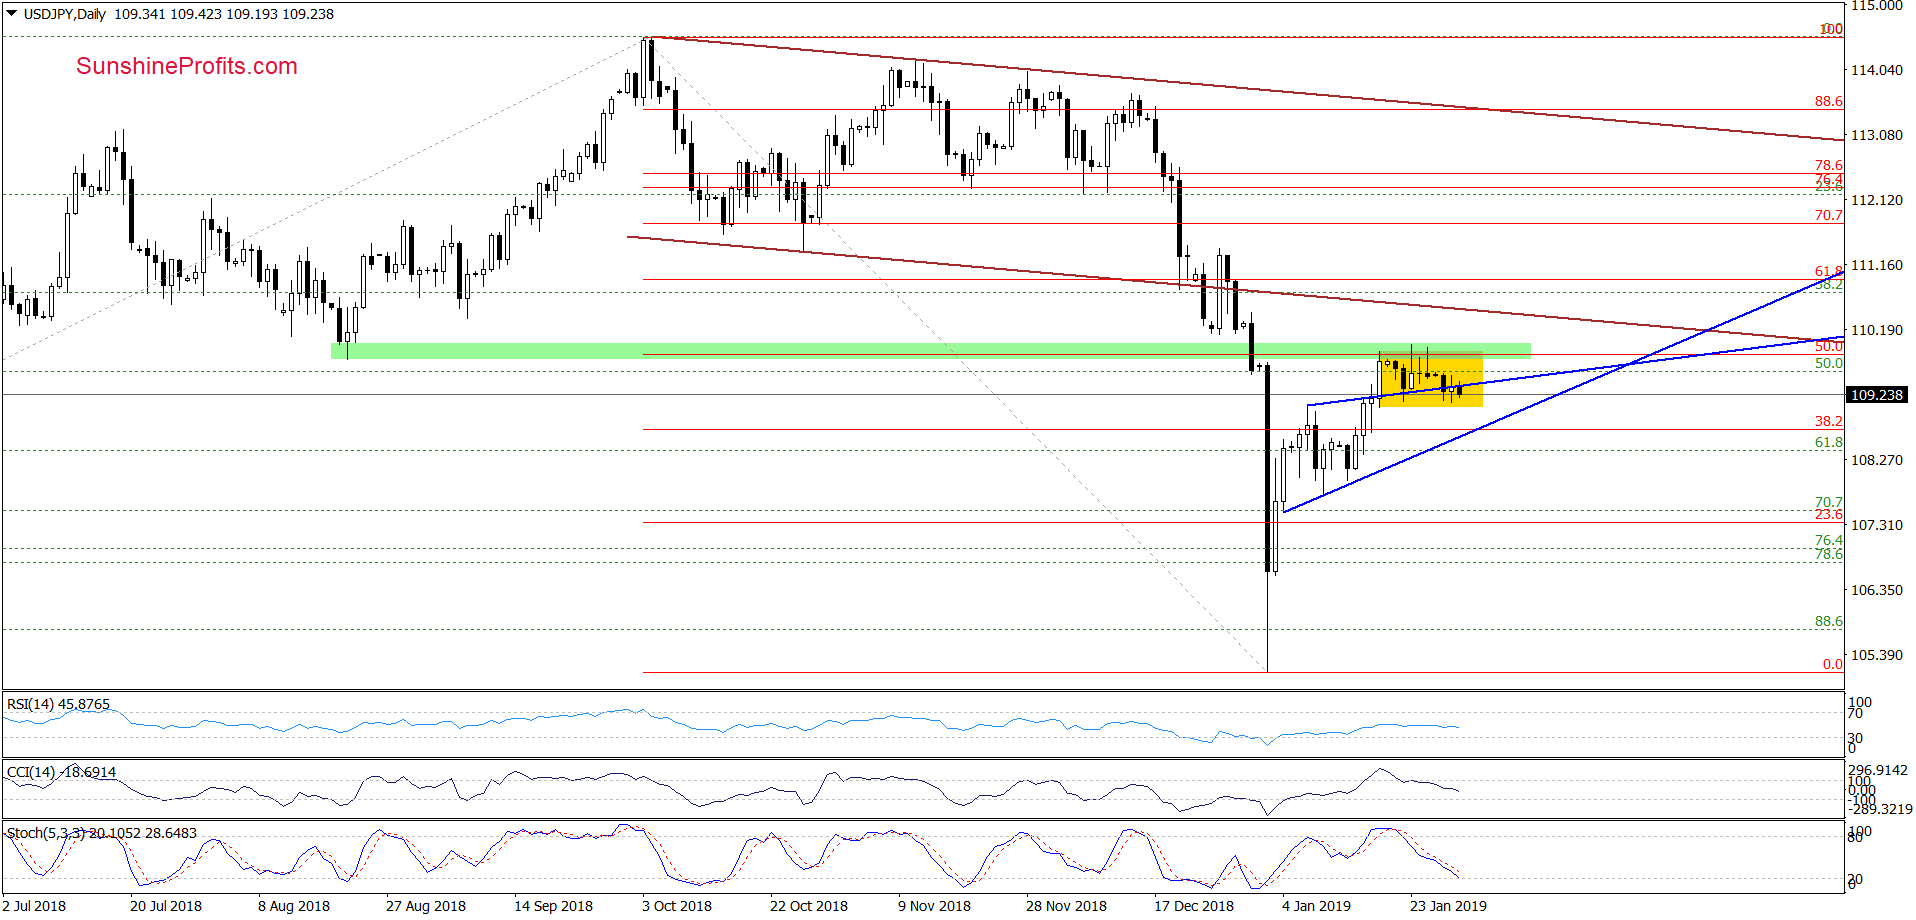
Although USD/JPY slipped under the upper border of the blue triangle earlier today, the overall situation in the very short term hasn’t changed much as the pair is still trading inside the yellow consolidation. Previous attempts to move back into the triangle have been rejected and as the pair currently trades at around 109.350, it looks like being another instance of being so today also.
It is our opinion that the situation is too unclear to justify opening any positions at the moment. Nevertheless, if we see a daily close below this formation (and preferably also under the lower line of the triangle) we’ll consider going short.
Until this time, we would not be surprised in the least by short-lived moves in both directions. Again, it is prudent to let the market guide us first where it truly wants to go.
Trading position (short-term; our opinion): No positions are justified from the risk/reward perspective.
USD/CAD
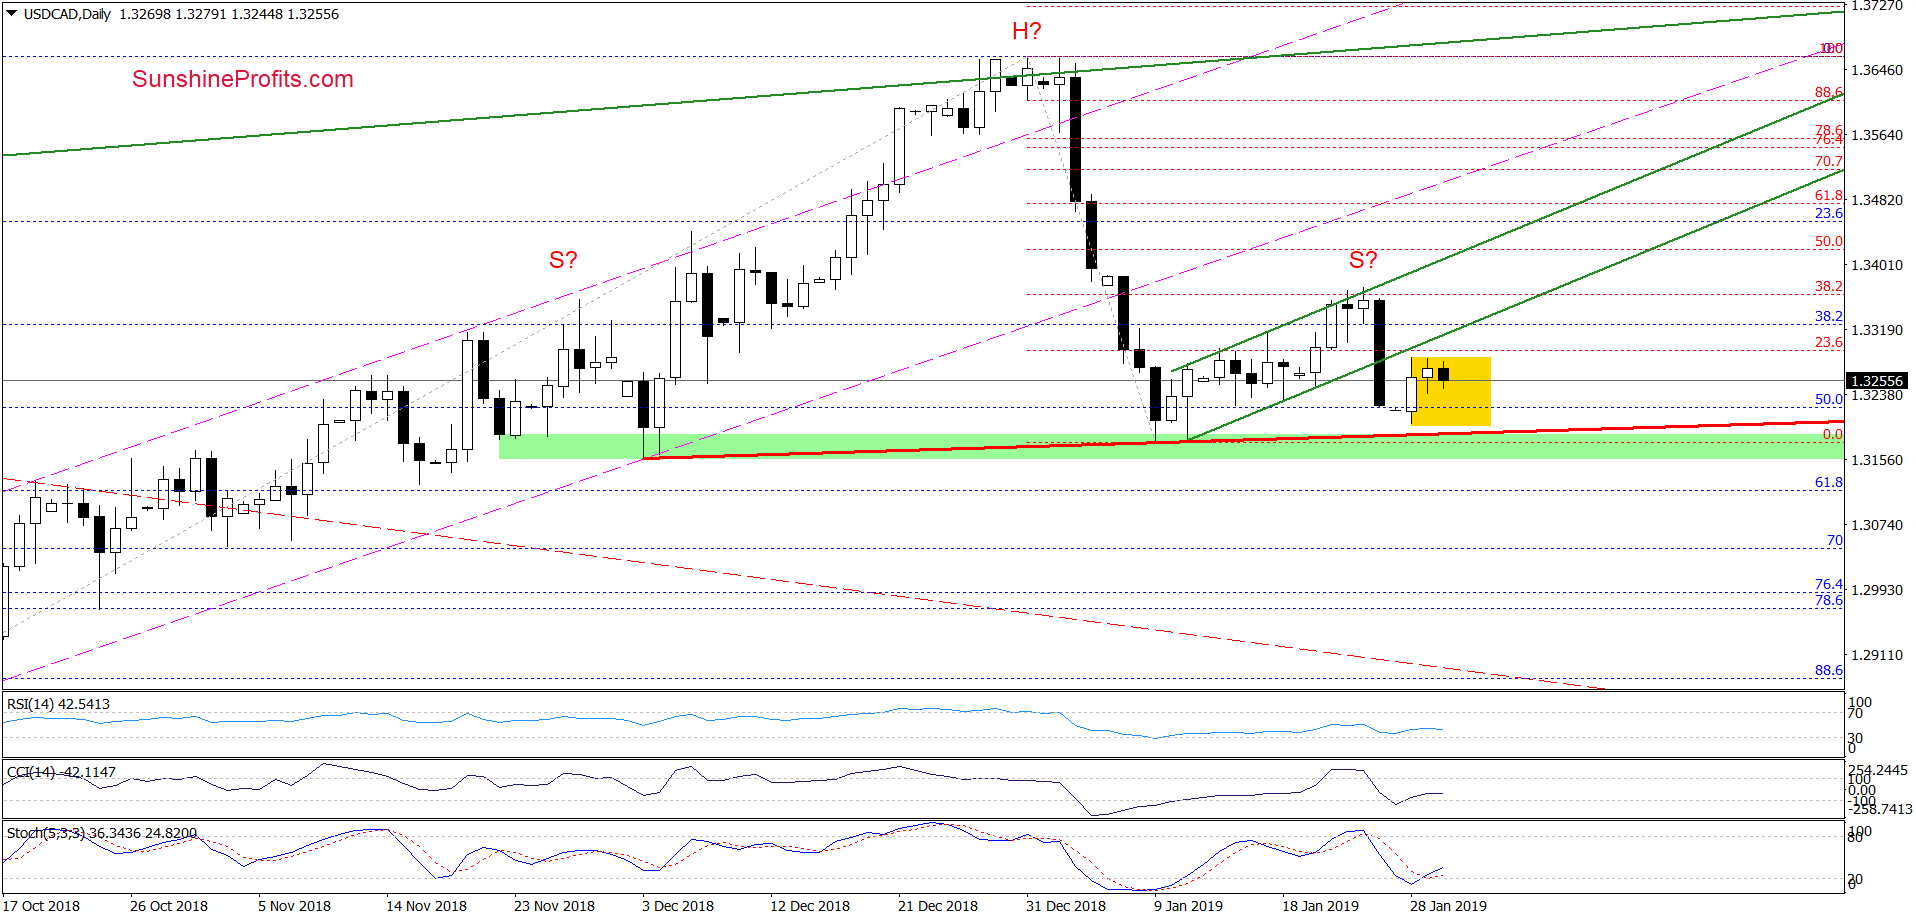
After last week’s sharp decline currency bulls tried to trigger a move to the north and erase Friday's drops, but instead, USD/CAD got stuck in consolidation (marked in yellow). Therefore, as long as there is no invalidation of the breakdown under the green rising trend channel, the potential head and shoulders formation remains in the cards. Just like we wrote recently:
(…) USD/CAD slipped under the very short-term trend channel and approached the green support zone, which serves as the nearest support. Additionally, in this area you can notice a red rising support line based on the early-December 2018 and early-January lows, which could be a neck line of a potential head and shoulders formation.
Nevertheless, as long as there is no breakdown and a daily closure below it the right arm can still be underway and opening any positions is not justified. However if the sellers show strength and take the pair under these supports, we’ll consider opening short positions.
The daily indicators have a slightly bearish feel to themselves but that is not enough. Just like we have seen with other pairs in today's alert - trading is a game of probabilities and we would like to see more reliable clues first and only then to commit capital with peace of mind."
Trading position (short-term; our opinion): No positions are justified from the risk/reward perspective.
Thank you.
Nadia Simmons
Forex & Oil Trading Strategist
Przemyslaw Radomski, CFA
Editor-in-chief, Gold & Silver Fund Manager

