

The USD Index scored some gains yesterday, and is rising also today. Just how similar is the situation to the September's breakdown before the rising support line? Let's examine whether the recent downswing brought any changes to the outlook or not.
Meanwhile, crude oil bounced from its yesterday's lows, and the oil bulls rebuffed another attempt to move lower earlier today. Does that mean that the upswing can continue now, or a cautious approach would win the day?
As you've read in the previous Oil Trading Alerts and Forex Trading Alerts, Nadia Simmons, who is the author of these reports has not been feeling well. This remains to be the case, and as it's been several days since you received crude oil or forex analysis from us, I (PR here) would like to help.
Consequently, I will be writing analyses of both: crude oil and the forex market and I will publish them combined, so that those, who normally enjoy access to only one of these reports, will get something extra. That's not much of a positive surprise for those, who already have access to both Alerts (for instance through the All-Inclusive Package), so if you have access through this package or you subscribed to both products individually, I will provide you with something extra. I will analyze any company of your choice with regard to its individual technical situation, and I will send you this on-demand analysis over e-mail. If this applies to you, please contact us with the name of the company that you're interested in.
Having said that, let's take a look at the crude oil market.
Crude Oil Analysis
In yesterday's Alert, we wrote the following:
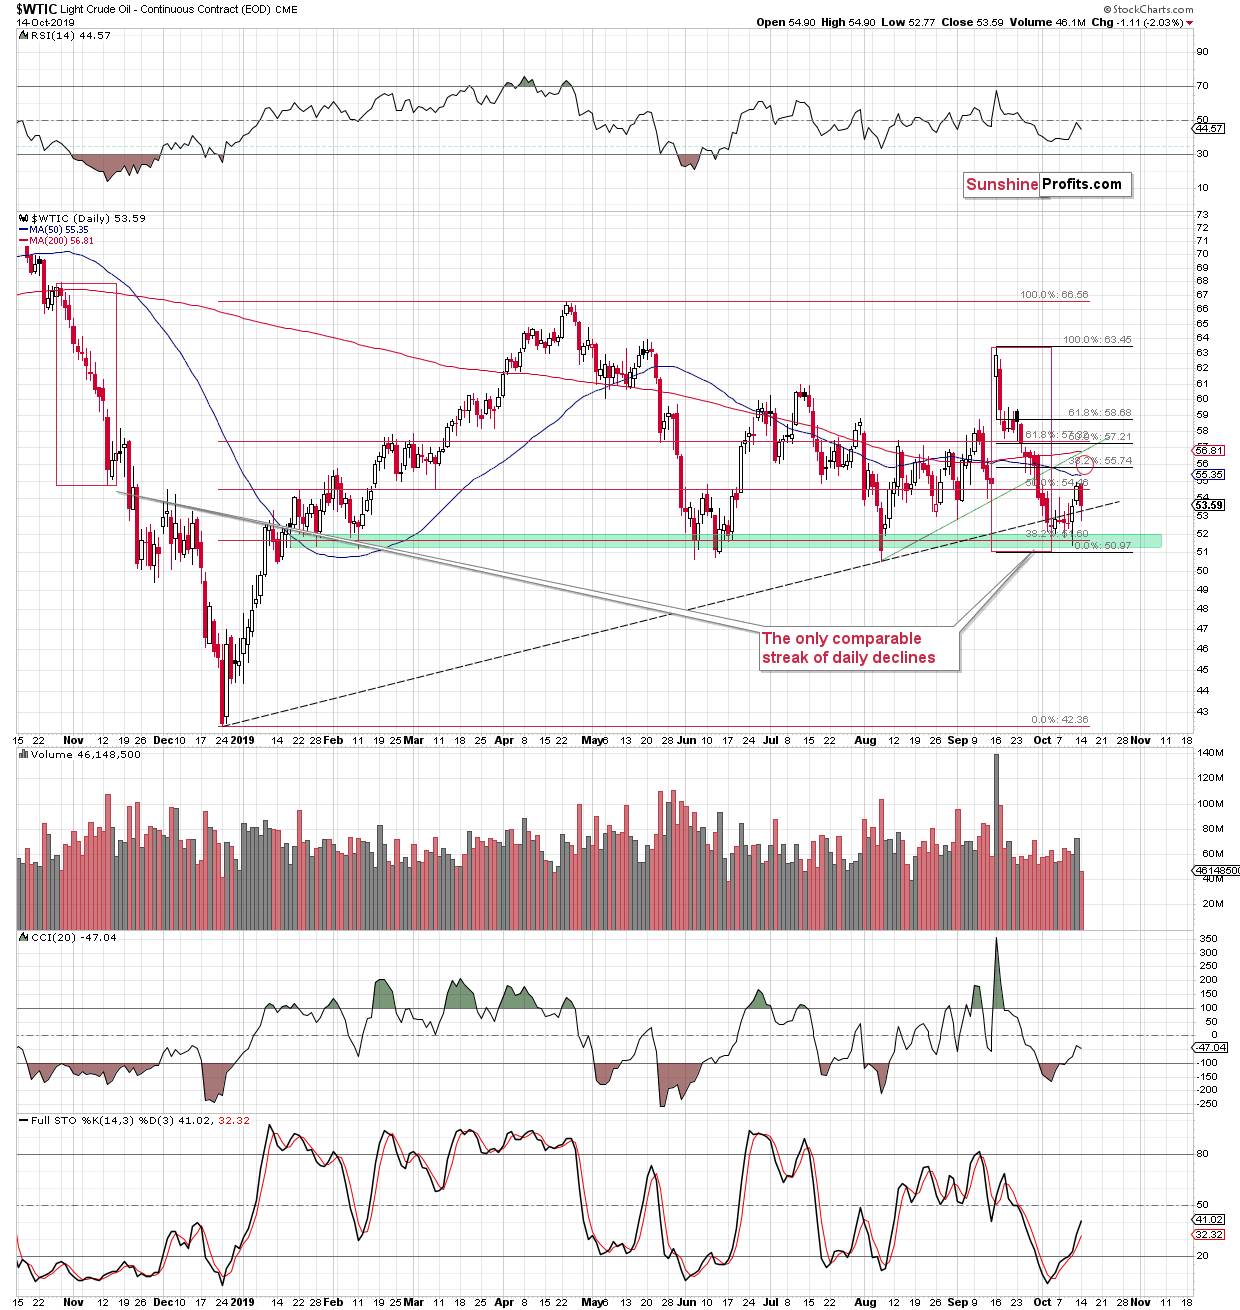
Crude oil moved higher last week, especially on Thursday and Friday. This rally was in tune with the clear buy signals from the CCI and Stochastic indicators. While crude oil pulled back in today's pre-market upswing, it's unlikely that the rally is completely over at this time. Why? Because of two factors: one that we covered previously, and one that we didn't cover so far.
The thing that we already discussed is the upside target based on the 38.2% Fibonacci retracement. It was not reached yet. Consequently, the price most likely has further to run.
The thing that we didn't mention previously is the fact that crude oil just invalidated the breakdown below the rising dashed support line that's based on the December 2018 and the August 2019 lows. Invalidations of breakdowns are bullish on their own. That's yet another reason to expect the profits on the current crude oil long position to increase further.
The above generally remains up-to-date. The price of crude oil declined today and then rose back up and at the moment, our long positions are about $1.50 in the black. The question is whether we run for the hills because of this week's decline, or do we wait for the price target to be reached.
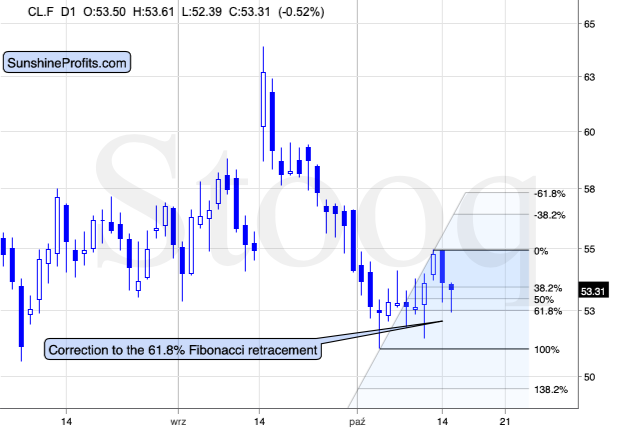
The latter still appears to be the better idea. Applying the Fibonacci retracements to the October rally shows that today's low formed almost exactly at the 61.8% Fibonacci retracement level. That's the classic way for any asset to correct its preceding move and then to resume the trend. The short-term trend remains up, which means that the odds are that our target area will be reached.
One concerning matter is the situation in the USD Index. In the very recent past - the last several days - the USD Index and crude oil moved in the opposite ways. Thursday's and Friday's upswing in crude oil corresponded to declining USD. And the USD Index seems to be bottoming.
Then again, the relationship may be very short-lived and crude oil might be able to rally despite USD's rally for a few days, anyway. After all, the USD Index is up at the moment of writing these words, and crude oil is almost done correcting its initial downswing.
Consequently, in our view, the current long position is justified from the risk-reward point of view.
Trading position: Long position in crude oil with a stop-loss order at $49.88 and the binding profit-take target at $55.78 is justified from the risk/reward perspective.
Forex Analysis
As far as the currency market is concerned, Nadia usually covers the individual currency pairs. However, that's not what I specialize in, so instead of the usual format of these analyses, I will maximize their usefulness and likely profitability. This means that instead of focusing on individual currency pairs, I will cover the USD Index, as that's what I've been following on a regular basis for years.
It's also tradable, as there are futures on it (DX symbol) as well as ETFs, for instance the UUP and the UDN.
The USD Index declined on Friday, moving a bit below the 50-day moving average, but you were prepared for this situation.
In Friday's Alert, we wrote the following:
The double support that was reached: the early October low and the rising red support line based on the August lows is likely to trigger a reversal, just as it did in September. Please note that, just as it was the case in September, the USD Index might move below the red line temporarily (perhaps to the 50-day moving average at about 98.15 or so) before rallying. Such a move would not invalidate the bullish setup at all.
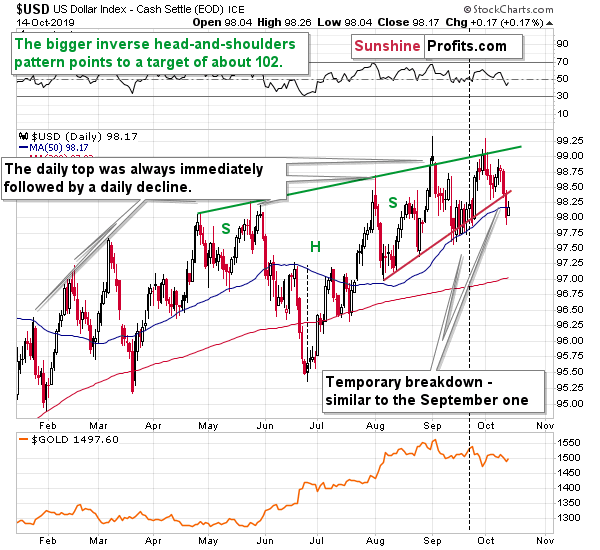
The decline didn't change the bullish outlook at all. In fact, the USD Index closed right at its 50-day moving average yesterday and it's already visibly above it today - see the chart below for details.
The 50-day moving average is not visible on the above chart, but since yesterday's session ended right at it, and the USDX is above yesterday's close today, then it's clearly above the 50-day MA as well. The decline appears to be over, also based on the symmetry of the recent and early-October rallies - just as we described it yesterday:
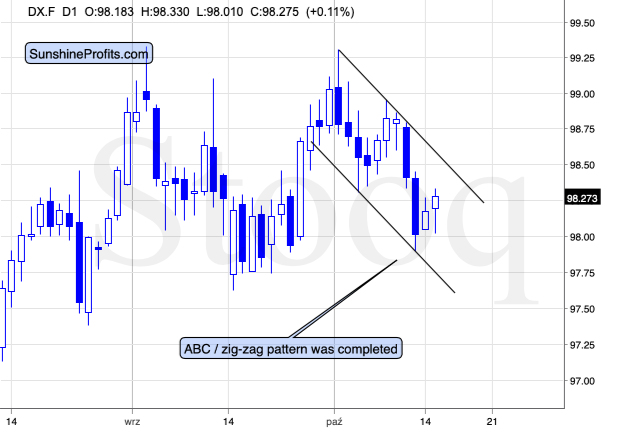
The size of the most recent downswing was practically identical to the size of the initial downswing that we saw earlier this month. This means that the pattern that seems to have just formed is a textbook example of a zig-zag. That's a classic corrective pattern that doesn't change the main trend.
Our comments on USD's medium-term and long-term charts remain up-to-date as well:
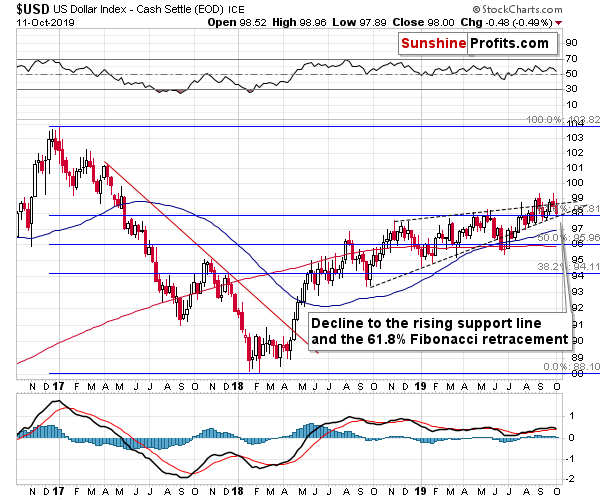
Moreover, as you can see on the above chart, the decline in the USDX stopped at the rising dashed line, which stopped most of this year's short-term declines. Only the mid-year decline was the exception from this rule.
Why are we focusing on the long positions in the USD Index? Because of the long-term trend, which remains up.
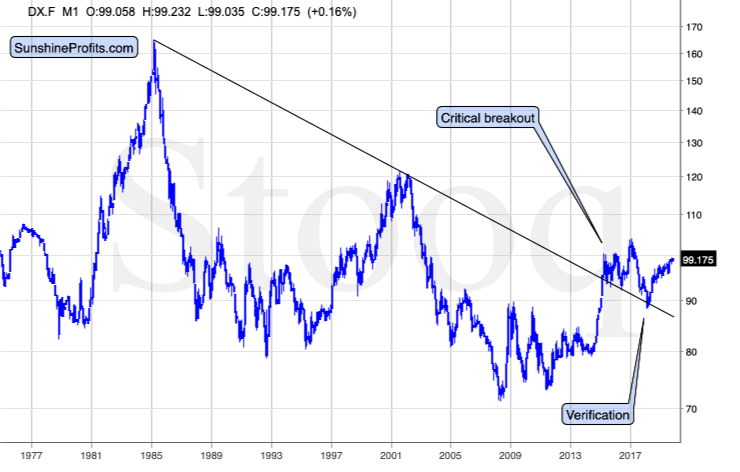
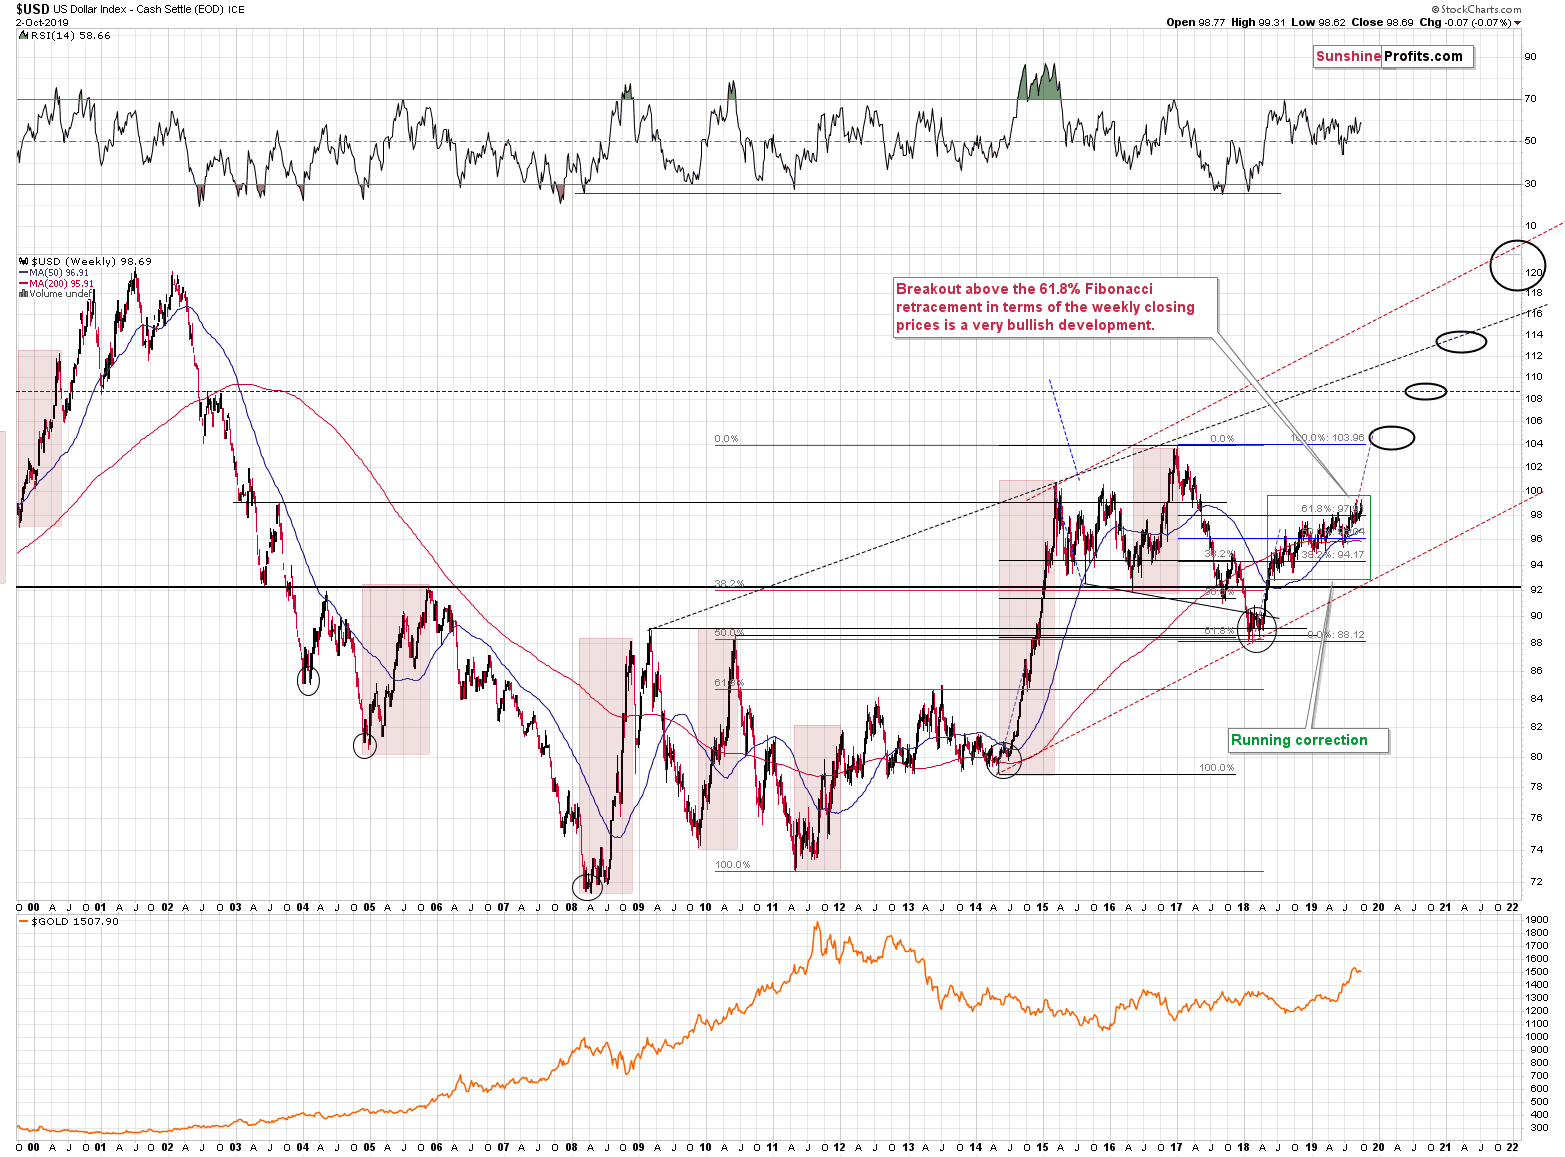
The USD Index is after a major long-term breakout and this breakout was already verified a few times. The most recent rally is just the very early part of the post-breakout rally. Much higher USD Index values are likely to follow in the upcoming months.
The long-term trend is up as even the dovish U-turn by the Fed, rate cuts, and myriads of calls from President Trump for lower U.S. dollar and much lower (even negative) interest rates, were not able to trigger any serious decline.
What we saw instead was a running correction that's the most bullish kind of corrections. It's the one in which the price continues to rally, only at significantly smaller pace.
Trading position (short-term; our opinion): Long position in the USD Index with a stop-loss order at 97.27 and the binding profit-take target at 99.17 is justified from the risk/reward perspective.
As always, we will keep you - our subscribers - informed.
Thank you.
Sincerely,
Przemyslaw Radomski, CFA
Editor-in-chief, Gold & Silver Fund Manager

